Recent Investigations on AA Doradus
Abstract
AA Dor is an eclipsing, post common-envelope binary with an sdOB-type primary and an unseen low-mass secondary, believed to be a brown dwarf. Eleven years ago, a NLTE spectral analysis of the primary showed a discrepancy with the surface gravity that was derived by radial-velocity and light-curve analysis that could not be explained.
Since then, emission lines of the secondary were identified in optical spectra and its orbital-velocity amplitude was measured. Thus, the masses of both components are known, however, within relatively large error ranges. The secondary’s mass was found to be around the stellar hydrogen-burning mass limit and, thus, it may be a brown dwarf or a late M-type dwarf. In addition, a precise determination of the primary’s rotational velocity showed recently, that it rotates at about 65 % of bound rotation – much slower than previously assumed.
A new spectral analysis by means of metal-line blanketed, state-of-the-art, non-LTE model atmospheres solves the so-called gravity problem in AA Dor – our result for the surface gravity is, within the error limits, in agreement with the value from light-curve analysis.
We present details of our recent investigations on AA Dor.
1 Introduction
AA Dor is a close, eclipsing binary (Kilkenny et al. 1978) and, thus, it is possible to determine its geometrical parameters (inclination , radii and ) precisely by high-speed photometry. This has been done now over a time-span of about 50 000 eclipses and orbital period = 0.261 539 7363 (4) d (Kilkenny 2011) and (Hilditch et al. 2003) were determined.
An early model of AA Dor (Paczyński 1980) based on a light-curve analysis assumed an sdOB-type primary with and a low-mass secondary with . Paczyński estimated that the common envelope was ejected years ago and the primary will become a degenerate, hot white dwarf in another years. Within years then, gravitational radiation will reduce the orbital period to about 38 minutes and the degenerate secondary will overflow its Roche lobe, making AA Dor a cataclysmic variable. However, since AA Dor is a PCEB and is now a pre-cataclysmic variable, it is a key object for understanding such an evolution. Moreover, the low-mass companion, just at the limit of the hydrogen-burning mass, and its angular momentum are important for the understanding of the common-envelope ejection mechanism (Livio & Soker 1984).
Paczyński (1980) already pointed out the importance to find signatures of the irradiated secondary to measure its radial-velocity curve in order to refine the model of AA Dor. Quite recently, Vučković et al. (2008) found spectral lines of the secondary in the UVES111Ultraviolet and Visual Echelle Spectrograph at ESO’s VLT KUEYEN spectra (ProgId 66.D180) and measured its orbital-velocity amplitude (), both components’ masses are known now and , albeit with large error bars.
Based on their spectral analysis of the sdOB primary, Klepp & Rauch (2011) found and within small error limits. The scenario (Trimble & Aschwanden 2001)
“that a planet belonging to AA Dor tried to swallow its star during common-envelope binary evolution, rather than the converse (Rauch 2000)”
() is not valid anymore.
The results of Klepp & Rauch (2011) for the primary, and , are now in good agreement with the photometric model of Hilditch et al. (2003). Detailed information about AA Dor and previous analyses are given in Rauch (2000, 2004), Fleig et al. (2008), and Klepp & Rauch (2011).
We will not repeat the description of the Klepp & Rauch (2011) analysis here but we will emphasize problems that we encountered during that analysis.
2 Atmosphere Modeling and Spectral Analysis of sd(O)B-type stars
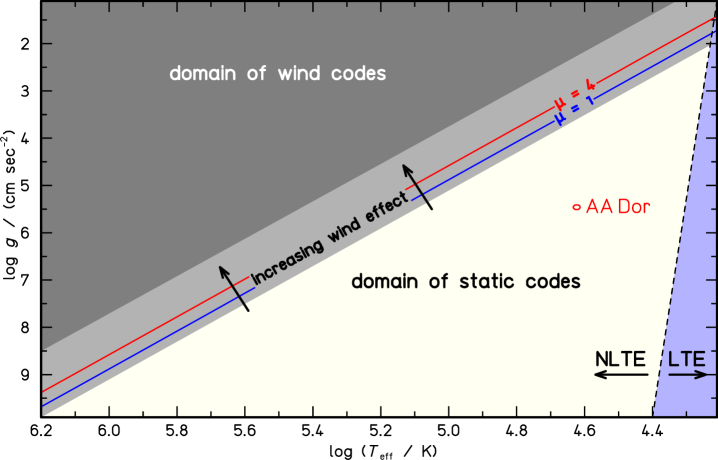
Müller et al. (2010) presented a spectral analysis of the primary of AA Dor that resulted in a too-low . This initiated the re-analysis of Klepp & Rauch (2011). They used the Tübingen Model-Atmosphere Package (TMAP222http://astro.uni-tuebingen.de/TMAP) to calculate plane-parallel NLTE models in hydrostatic and radiative equilibrium. Fig. 1 shows that the primary of AA Dor is located in the domain of static NLTE models. The limit between NLTE and LTE shown in Fig. 1 is not stringent. There are, however, deviations from LTE in any star, at least at high energies and high resolution. (cf. Jeffery, Pereira, Naslim, & Behara these proceedings.)
In addition to the necessity to use NLTE models for an appropriate analysis of the primary of AA Dor, fully metal-line blanketed model atmospheres should be used to avoid the so-called Balmer-line problem (cf. Napiwotzki & Rauch 1994; Rauch 2000). H+He and the intermediate-mass elements C+N+O+Mg+Si+P+S were considered using classical model atoms, while for Ca+Sc+Ti+V+Cr+Mn+Fe+Co+Ni, the so-called iron-group elements, a statistical approach (Rauch & Deetjen 2003) is employed to create model atoms. The most recent atomic data (TMAD333http://astro.uni-tuebingen.de/TMAD) were used. 530 levels are treated in NLTE with 771 individual lines (from H - S) and 19 957 605 lines of Ca - Ni from Kurucz’ line lists (Kurucz 2009) combined to 636 superlines. For all models, we use the same model atoms and the same frequency grid.
Two model-atmosphere grids were calculated, firstly a coarse grid (638 models) within ( ) and ( ). Secondly, a finer sub-grid (527 models) with ( ) and ( ). All calculations were performed on computational resources of the bwGRiD444bwGRiD (http://www.bw-grid.de), member of the German D-Grid initiative, funded by the Ministry for Education and Research (Bundesministerium für Bildung und Forschung) and the Ministry for Science, Research and Arts Baden-Württemberg (Ministerium für Wissenschaft, Forschung und Kunst Baden-Württemberg).
The computational time for single models to converge is relatively long, and it took more than a diploma student’s time to complete the grids. During their calculation, we performed quality control to check the grids’ status. Fig. 2 shows a comparison of actual and desired for two selected phases of model-atmosphere calculation. The left panel shows the situation just after a grid extension towards higher and . The right panel shows a later phase where the complete grid (but the highest ) is more homogeneously converged.


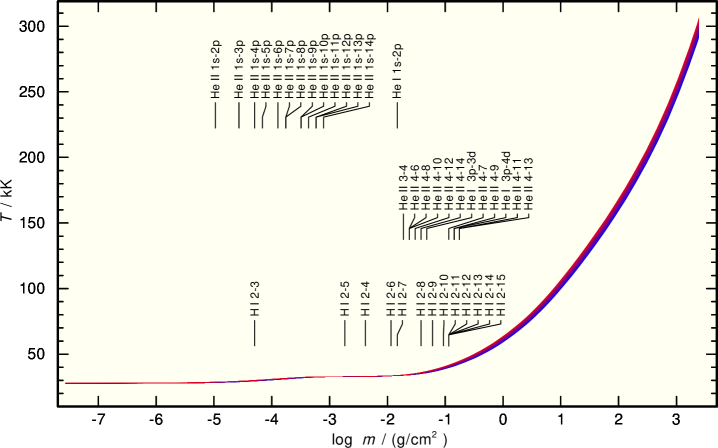
It turned out that the temperature structures of the models (Fig. 3) suggest that the models are converged much earlier than according to the criterion. However, even at the converged state, a close look to the temperature structures of the models reveals a surprise. Fig. 4 shows that there is obviously some grouping in the temperature structures within . The reason is that the formation depths of absorption edges and lines are dependent on and . This is demonstrated for in Fig. 4. E.g. the absorption edge of H i forms at in the model and at in the model. (The individual edge or line that is responsible for the grouping is not investigated.) Our TMAP model atmospheres consider by default 90 depth points. In a test calculation, we used 360 depth points (Fig. 4) and could clearly show that the depth-point discretization is the reason of the temperature grouping.
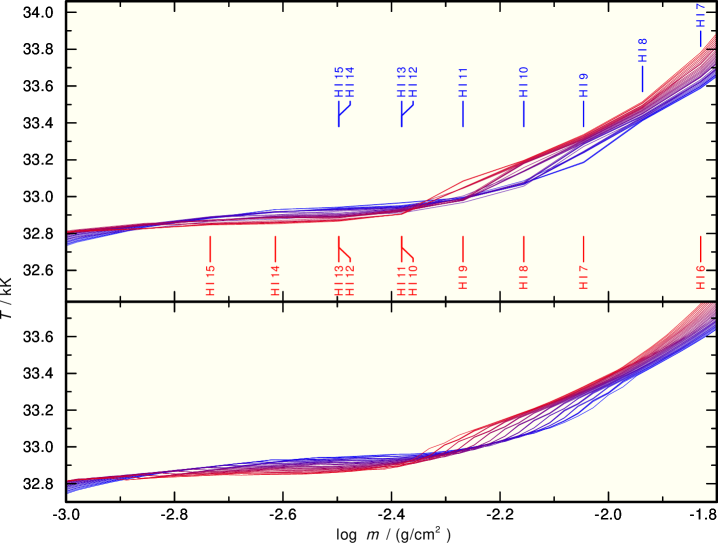
A higher number of depth points increases the calculation time linearly but has no significant impact on the analysis. However, one has to be aware that there may be artificial temperature jumps of a few hundred K in the line-forming regions of the atmosphere due to numerical limitations in the model-atmosphere calculations. This is especially important in case that fits are presented, with the extraordinary small statistical errors.
3 The Balmer-Line Problem – Still present?
The final Balmer-line fit (Fig. 5) of Klepp & Rauch (2011), got a comment by the A&A editor Ralf Napiwotzki:
“It is slightly depressing that after all this improvements and on this high level of sophistication, the Balmer lines are still not well fitted.”
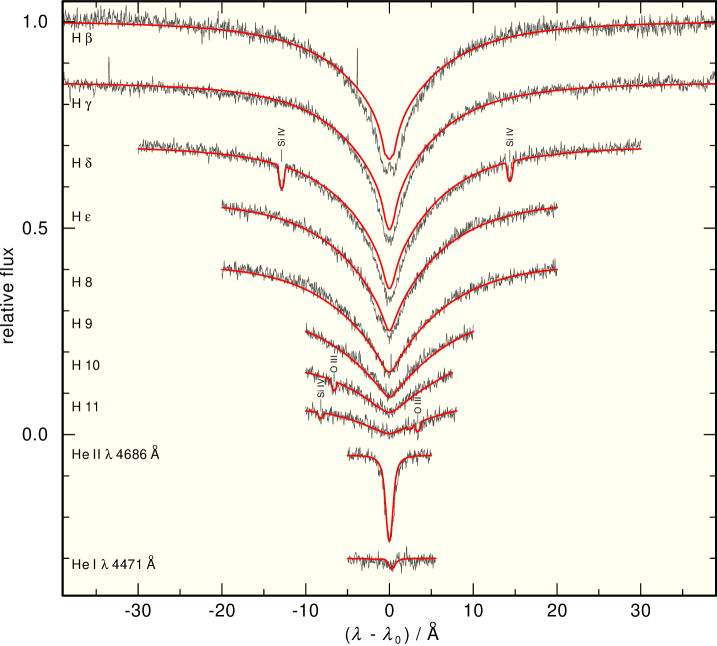
Indeed, the line cores as well as inner line wings of H - are not well reproduced. Their line centers form at (Fig. 3) where the temperature jumps (Fig. 4) occur. A higher number of depths points, however, did not improve the agreement.
The reason is more likely due to the Balmer-line problem (Napiwotzki & Rauch 1994), i.e. that opacities are still missing in our model-atmosphere calculations. These are on the one hand of chemical species that are as yet unconsidered and on the other hand of species whose abundance is determined too-low.
A new grid of models is already calculating, it will be used to further investigate this issue.
4 Conclusions
The sdOB primary of AA Dor is well studied and most of its parameters are determined within small error ranges. Additional opacities may improve the model atmospheres and e.g. the agreement of synthetic Balmer-line profiles with the observation. We summarize parameters of AA Dor in Table 1 and show a sketch of the binary in Fig. 6.
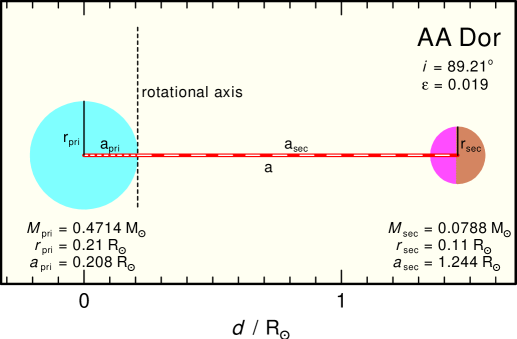
The masses of both components of AA Dor are well known, and (Klepp & Rauch 2011). Since the hydrogen-burning mass limit is (Chabrier & Baraffe 1997; Chabrier et al. 2000), it is still unclear whether the secondary is a brown dwarf or a late M-type dwarf. In order to make progress and to investigate on the nature of the secondary of AA Dor, phase-dependent spectra of AA Dor in the infrared are highly desirable in order to identify the secondary’s spectral contribution and to follow its spectral evolution during its orbit.
5 An Answer to an Important Question
At the very end of the question time following my talk, Darragh O’Donoghue asked
“Thomas, is it right, that with all your spectral analysis, you arrived at the same result that we got already 30 years ago from light-curve analysis?”
Of course, he meant the SAAO group and of the primary – and thus, the problem (Rauch 2000), that is solved now. The simple answer to Darragh’s question is yes. However, I would like to point out that – thanks to the comments of Ron Hilditch, who was referee of Rauch (2000) – we took the challenge to solve the problem and finally achieved agreement. This is a good example that, if carried out with care, theory works. The independent method to determine from light-curve analysis provided a crucial constraint to test our model atmospheres. Within this course, we improved our models, the atomic data, as well as our observational, spectral data base (Rauch & Werner 2003). The errors in , , and abundances (Fleig et al. 2008) for the primary of AA Dor were reduced.
In total, our picture of AA Dor improved, making this one of the best-analyzed PCEB. We are still not tired to improve the primary’s model, but it appears time to focus now on the outstanding question of the nature of the low-mass companion. Phase-dependent, high-S/N infrared spectroscopy, that covers the complete orbital period of AA Dor, will provide answers.
| Primary | ||||
|---|---|---|---|---|
| / | kK | 42. | 0 | 1 |
| / | 5. | 46 | 0.05 | |
| mass | number | |||||
|---|---|---|---|---|---|---|
| abundances | fraction | fraction | [X] | |||
| H | 9.94E-01 | 9.99E-01 | 12. | 144 | 0. | 130 |
| He | 2.69E-03 | 6.80E-04 | 8. | 977 | 1. | 967 |
| C | 1.78E-05 | 1.50E-06 | 6. | 320 | 2. | 124 |
| N | 4.15E-05 | 3.00E-06 | 6. | 621 | 1. | 223 |
| O | 1.01E-03 | 6.39E-05 | 7. | 950 | 0. | 754 |
| Mg | 4.08E-04 | 1.70E-05 | 7. | 375 | 0. | 240 |
| Si | 3.05E-04 | 1.10E-05 | 7. | 186 | 0. | 339 |
| P | 5.20E-06 | 1.70E-07 | 5. | 375 | 0. | 050 |
| S | 3.24E-06 | 1.02E-07 | 5. | 155 | 1. | 980 |
| Ca | 5.99E-05 | 1.52E-06 | 6. | 325 | 0. | 030 |
| Sc | 3.69E-08 | 8.33E-10 | 3. | 065 | 0. | 100 |
| Ti | 2.78E-06 | 5.89E-08 | 4. | 915 | 0. | 050 |
| V | 3.73E-07 | 7.42E-09 | 4. | 015 | 0. | 070 |
| Cr | 1.66E-05 | 3.24E-07 | 5. | 655 | 0. | 001 |
| Mn | 9.88E-06 | 1.82E-07 | 5. | 405 | 0. | 040 |
| Fe | 1.15E-03 | 2.09E-05 | 7. | 465 | 0. | 050 |
| Co | 3.59E-06 | 6.17E-08 | 4. | 935 | 0. | 069 |
| Ni | 3.48E-04 | 6.01E-06 | 6. | 923 | 0. | 689 |
| / | 0. | 4714 | 0.0050 | |
| / | 0. | 21 | ||
| / | 0. | 208 | ||
| / | 120 | |||
| / | 30 | 1 | ||
| Secondary | ||||
| / | 0. | 0788 | ||
| / | 0. | 11 | ||
| / | 1. | 244 | ||
| / | 352 | |||
| / | ||||
| 0. | 01 | 0.01 | ||
Acknowledgments
TR is supported by the German Aerospace Center (DLR, grant 05 OR 0806). The attendance of the sdOB5 meeting was funded from a DAAD grant. The UVES spectra used in this analysis were obtained as part of an ESO Service Mode run, proposal 66.D-1800. We gratefully thank the bwGRiD4 project for the computational resources. This research made use of the SIMBAD Astronomical Database, operated at the CDS, Strasbourg, France.
References
- Asplund et al. (2009) Asplund, M., Grevesse, N., & Sauval, A. J. 2009, ARA&A, 47, 481
- Chabrier & Baraffe (1997) Chabrier, G., & Baraffe, I. 1997, A&A, 327, 1039
- Chabrier et al. (2000) Chabrier, G., Baraffe, I., Allard, F., & Hauschildt, P. 2000, ApJ, 542, 464
- Fleig et al. (2008) Fleig, J., Rauch, T., Werner, K., & Kruk, J. W. 2008, A&A, 492, 565
- Hilditch et al. (1996) Hilditch, R. W., Harries, T. J., & Hill, G. 1996, MNRAS, 279, 1380
- Hilditch et al. (2003) Hilditch, R. W., Kilkenny, D., Lynas-Gray, A. E., & Hill, G. 2003, MNRAS, 344, 644
- Kilkenny (2011) Kilkenny, D. 2011, MNRAS, 412, 487
- Kilkenny et al. (1978) Kilkenny, D., Hilditch, R. W., Penfold, J. E. 1978, MNRAS, 183, 523
- Klepp & Rauch (2011) Klepp, S., & Rauch, T. 2011, A&A, 531, L7
- Kurucz (2009) Kurucz, R. L. 2009, in: Recent Directions in Astrophysical Quantitative Spectroscopy and Radiation Dynamics, eds. I. Hubeny, J. M. Stone, K. MacGregor, & K. Werner, AIP-CS 1171, 43
- Livio & Soker (1984) Livio, M., & Soker, N. 1984, MNRAS, 208, 763
- Müller et al. (2010) Müller, S., Geier, S., & Heber, U. 2010, Ap&SS, 329, 101
- Napiwotzki & Rauch (1994) Napiwotzki, R., & Rauch, T. 1994, A&A, 285, 603
- Paczyński (1980) Paczyński, B. 1980, Acta Astr., 30, 113
- Rauch (2000) Rauch, T. 2000, A&A, 356, 665
- Rauch (2004) Rauch, T. 2004, Ap&SS, 291, 275
- Rauch & Deetjen (2003) Rauch, T., & Deetjen, J. L. 2003, in: Stellar Atmosphere Modeling, eds. I. Hubeny, D. Mihalas, K. Werner, ASP-CS, 288, 103
- Rauch & Werner (2003) Rauch, T., & Werner, K. 2003, A&A, 400, 271
- Trimble & Aschwanden (2001) Trimble, V., & Aschwanden, K. 2001, PASP, 113, 1025
- Vučković et al. (2008) Vučković, M., Østensen, R., Bloemen, S., Decoster, I., & Aerts, C. 2008, in: Hot Subdwarf Stars and Related Objects, eds. U. Heber, C. S. Jeffery, R. Napiwotzki, ASP-CS, 392, 199
- Werner et al. (2003) Werner, K., Dreizler, S., Deetjen, J. L., Nagel, T., Rauch, T., & Schuh, S. L. 2003, in: Stellar Atmosphere Modeling, eds. I. Hubeny, D. Mihalas, K. Werner, ASP-CS, 288, 31
![[Uncaptioned image]](/html/1111.0540/assets/x8.png)
David Kilkenny, with small tribal face painting, at Spier wine estate, July 27, 2011.
sdOB5 marked the 65th birthday of David Kilkenny, who discovered that AA Dor is a short-period, eclipsing binary system. Since December 1974, he observed this system once in a while, covering now a period of more than 46 119 eclipses, and could show that the period increase or decrease is less that 10-14 d/orbit.
All the best wishes to you, Dave, and have the energy for the next tens of thousands of eclipses of AA Dor!