ON THE FLARE INDUCED SEISMICITY IN THE ACTIVE REGION NOAA 10930 AND RELATED ENHANCEMENT OF GLOBAL WAVES IN THE SUN
Abstract
A major flare (of class X3.4) occurred on 13 December 2006 in the active region NOAA 10930. This flare event has remained interesting for solar researchers for studies related to particle acceleration during the flare process and the reconfiguration of magnetic fields as well as fine scale features in the active region. The energy released during flares is also known to induce acoustic oscillations in the Sun. Here, we analyze the line-of-sight velocity patterns in this active region during the X3.4 flare using the Dopplergrams obtained by Global Oscillation Network Group (GONG) instrument. We have also analyzed the disk-integrated velocity observations of the Sun obtained by Global Oscillation at Low Frequency (GOLF) instrument onboard SOHO (Solar and Heliospheric Observatory) spacecraft as well as full-disk collapsed velocity signals from GONG observations during this flare to study any possible connection between the flare related changes seen in the local and global velocity oscillations in the Sun. We apply wavelet transform to the time series of the localized velocity oscillations as well as the global velocity oscillations in the Sun spanning the flare event. The line-of-sight velocity shows significant enhancement in some localized regions of the penumbra of this active region during the flare. The affected region is seen to be away from the locations of the flare ribbons and the hard X-ray footpoints. The sudden enhancement in this velocity seems to be caused by the Lorentz force driven by the “magnetic jerk” in the localized penumbral region. Application of wavelet analysis to these flare induced localized seismic signals show significant enhancement in the high-frequency domain (58 mHz) and a feeble enhancement in the -mode oscillations (25 mHz) during the flare. On the other hand, the wavelet analysis of GOLF velocity data and the full-disk collapsed GONG velocity data spanning the flare event indicate significant post-flare enhancements in the high-frequency global velocity oscillations in the Sun as evident from the Wavelet Power Spectrum and the corresponding scale-average variance. The present observations of the flare induced seismic signals in the active region in context to the driving force is different as compared to the previous reports on such cases. We also find indications of a connection between flare induced localized seismic signals and the excitation of global high-frequency oscillations in the Sun.
1 INTRODUCTION
Solar flares release a large amount of energy in the solar environment and produce energetic particles moving with relativistic speeds. The bremsstrahlung radiation generated by deceleration of the particles while striking the target (chromospheric material) produces hard X-ray emission (Brown, 1971), while the gyrosynchrotron emission due to motion of charged particles along magnetic fields produces microwave radiation (Kakinuma & Swarup, 1962; Hudson & Ohki, 1972) and -rays. Apart from these effects, the mechanical response of the solar atmosphere to flares has also been reported (Kumar et al., 2010, and references therein). In particular, the observations of Venkatakrishnan et al. (2008) show co-spatial evolution of the photospheric Doppler enhancements and the chromospheric H flare ribbons in the active region NOAA 10486 during the 4B/X17.2 class solar flare of 28 October 2003. In addition, a feeble enhancement in global high-frequency velocity oscillations was seen to be induced by this flare and two other flares (Kumar et al., 2010). A further opportunity to examine this effect was seen in active region NOAA 10930 which appeared on the solar disk during December 2006 and produced a lot of space weather related activity (Li et al., 2009; Ning, 2008). The most intense flare (of class X3.4) in this active region was reported on 13 December 2006. The X-ray Telescope (XRT; Golub et al. (2007)) on board Hinode spacecraft (Kosugi et al., 2007) observed the evolution of sheared coronal magnetic fields (Su et al., 2007) during this flare. The EUV Imaging Spectrometer (EIS; Culhane et al. (2007)) measured plasma flows (Imada et al., 2007; Asai et al., 2008) and turbulent motions (Imada et al., 2008) during the flare. In addition, some interesting photospheric and chromospheric disturbances were also reported in this active region during the flare (Minoshima et al., 2009). The Solar Optical Telescope (SOT; Tsuneta et al. (2008)) on board Hinode (Kosugi et al., 2007) spacecraft has obtained high-resolution photospheric and chromospheric observations of this flare event in G-band (4305 Å) and Ca ii H (3968 Å), respectively. These observations have shown elongated flare ribbons which moved apart as the flare progressed with time (Isobe et al., 2007; Jing et al., 2008). The hard X-ray (HXR) images of this flare event captured by RHESSI spacecraft show double-footpoint HXR sources located on the flare ribbons (Su et al., 2007; Minoshima et al., 2009). The Hinode observations of this active region have also shown lateral motion of penumbral filaments in the active region during the flare (Gosain et al., 2009) as well as interesting changes in the magnetic field inclinations (Gosain, & Venkatakrishnan, 2010) and the net current (Ravindra et al., 2011). Kosovichev & Sekii (2007) have revealed high-frequency oscillations excited by this flare in the sunspot chromosphere using the Ca ii H intensity images obtained by SOT on board Hinode spacecraft.
In this paper, we present a detailed study of the flare induced seismic signals in the active region NOAA 10930 during the flare using the full-disk Dopplergrams obtained by the Global Oscillation Network Group instrument (GONG; Harvey & The GONG Instrument Team (1995)). A preliminary report on the flare related localized enhancements seen in this active region during this flare event has been communicated by Kumar et al. (2011). We have used wavelet techniques (Torrence & Compo, 1998; Liu et al., 2007) to analyze the velocity time series. This gives us an opportunity to examine whether there are any short-lived pulsations induced by the flare. An important feature of the wavelet analysis is that we can see the evolution of any physical parameter in the frequency domain as a function of time. Recently, it has been shown that flares can also influence high-frequency (5–8 mHz) global acoustic oscillations in the Sun (Karoff & Kjeldsen, 2008; Kumar et al., 2010). Motivated by these findings, we have also looked for enhancements of the global velocity oscillations in the Sun for this X3.4 class flare of 13 December 2006 using the disk-integrated velocity observations of the Sun obtained from Global Oscillation at Low Frequency (GOLF; Gabriel et al. (1995)) on board SOHO (Solar and Heliospheric Observatory) spacecraft (Domingo et al., 1995) as well as full-disk collapsed velocity signals from GONG observations. We have applied wavelet analysis to these GOLF velocity data and the full-disk collapsed velocity data from GONG spanning the flare event. The idea behind this is to study any possible connection between the flare-induced enhancements in the local velocity oscillations and the global velocity oscillations in the Sun.
2 THE OBSERVATIONAL DATA
The active region NOAA 10930 was one of the largest group of sunspots observed during the minimum phase of the solar activity cycle 23. It appeared on the east limb of the Sun on 7 December 2006 in the southern hemisphere. This complex active region belonged to class and produced several X-, M- and C-class flares during its passage on the solar disk. On 13 December 2006, a major flare (of class X3.4) occurred in this active region when it was located at S06W27. This was one of the largest flares that occurred during the solar minimum of the activity cycle 23 and produced high-speed halo Coronal Mass Ejection (CME) and extremely energetic emissions (Wang et al., 2008; Li et al., 2009). This flare was well observed by Nobeyama Radio Polarimeters (NoRP), RHESSI, GOES, Hinode, GONG and other ground- or space-based instruments. Although RHESSI missed the first impulsive phase of the flare in hard X-ray emissions, the full event was covered in microwave emissions by NoRP and in soft X-ray emission by GOES. We have used data from GONG and GOLF for the analysis of velocity oscillations during the flare. The details of the data are given as follows.
2.1 GONG DATA
The GONG observations comprise of solar full-disk photospheric Dopplergrams taken in Ni i 6768 Å line. These full-disk Dopplergrams are obtained once a minute with a spatial sampling rate of 2.5 arcsec per pixel. In this study, we have used the calibrated and solar-rotation signal removed GONG Dopplergrams between 01:00 UT and 03:02 UT taken on 13 December 2006 spanning the flare event. The active region NOAA 10930 was tracked using heliographic coordinates in the full-disk Dopplergrams, which were interpolated to a 1 arcsec pixel size. We selected a grid of 6060 pixels (150150 arcsec) covering this active region for preparing the tracked data. The tracked velocity images were further co-aligned with a sub-pixel accuracy. We are interested in examining the effect of the flare on the line-of-sight velocity signals much beyond the impulsive phase of the flare (02:25 UT) as observed in microwave emissions by NoRP and the maximum of soft X-ray flux at 02:35 UT as reported by GOES. However, there was a disruption in the GONG observations after 03:02 UT and hence we have analyzed the GONG data only till 03:02 UT time. In the Figure 1(a), we show the continuum intensity map of the active region NOAA 10930 obtained by the GONG instrument on 13 December 2006 at 02:26 UT. The field-of-view of this intensity map is the same as that for the aforementioned rasters of co-aligned velocity images.
2.2 GOLF DATA
The GOLF observations comprise of disk-integrated photospheric line-of-sight velocity of the Sun using Na D lines. These observations are obtained at a cadence of 10 s. However, we have used rebinned velocity data from GOLF for every 60 s to match with the GONG observations. Before the beginning of ‘SOHO vacation’ in June 1998 and since December 2002 the GOLF experiment has been probing the blue wing of the Na D lines at two points separated by 0.0003 nm and displaced by 0.0108 nm from the centers of the lines (García et al., 2005). Hence, the GOLF observations are similar in nature to other known sun-as-a-star velocity measurements (Pallé et al., 1999), such as, IRIS and BiSON, and these observations are mostly confined to the solar photosphere but with a small contribution of the chromosphere which depends on the orbital velocity (Jiménez-Reyes et al., 2007; Jiménez et al., 2005). Therefore, the GOLF observations are also comparable with GONG observations with respect to the observing heights in the solar photosphere (Jiménez-Reyes et al., 2007). In this study, we have used the GOLF observations for the period from 01:00 UT to 04:15 UT on 13 December 2006, which covers the GONG observations used in our analysis. In fact, there was a disruption in GOLF observations after 04:15 UT and hence we could not use these velocity observations beyond this time. We have worked with the standard velocity time series (García et al., 2005; Ulrich et al., 2000) from GOLF. The GOLF housekeeping data have sometimes shown anomalous behaviour during major flares. We have checked and confirmed that the housekeeping data corresponding to our velocity time series are free from such effects. A two-point backward difference filter (García & Ballot, 2008) is applied to the velocity series to remove the effect of the orbital motion of the satellite with respect to the Sun.
3 ANALYSIS AND RESULTS
The sequence of the co-aligned grids (150150 arcsec) from the GONG Dopplergrams covering the active region NOAA 10930 are analyzed to see the effect of this flare event on the local line-of-sight velocity signals in different locations of the active region. Simultaneously, we analyze the velocity time series from GOLF to examine the effect of this flare on global velocity oscillations in the Sun. As mentioned earlier, we apply wavelet transform to these data to investigate the effect of the flare on the solar velocity oscillations. Wavelet techniques have the capability to detect episodic and weak pulsations in a given time series (Torrence & Compo, 1998). In the application of wavelet techniques, here we have limited our analysis to the periods of less than 25% of the time series length. This ensures a better reliability of the periods and technically this is known as “cone of influence”. Here, the cone of influence takes into account the fact that we should observe at least four periodicities to be confident that it is a real signal. This gives the limit in frequency above which any periodicity is reliable. For example, given a time series of two hours, we should be able to detect periods 30 min. However, the frequency resolution of the wavelet transform is still decided by the temporal resolution in our velocity time series, which is 60 s. In our wavelet analysis, we have estimated two confidence levels of detection corresponding to the probability of 90% and 50% . This helps in deciding the episodes when wavelet power is above noise. In the Wavelet Power Spectrum, the confidence levels corresponding to 90% and 50% are outlined using contour maps.
3.1 ANALYSIS OF VELOCITY SIGNALS IN THE ACTIVE REGION USING GONG DOPPLERGRAMS
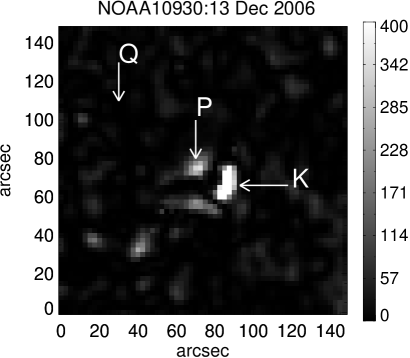
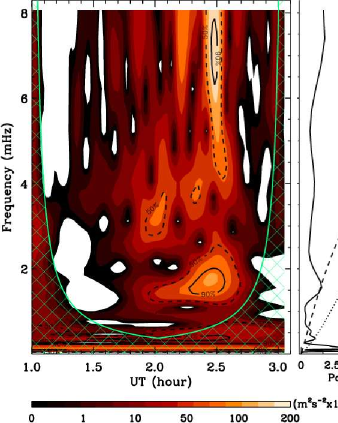
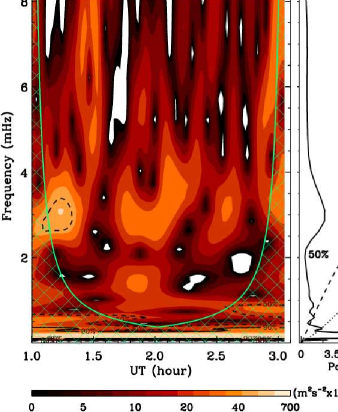
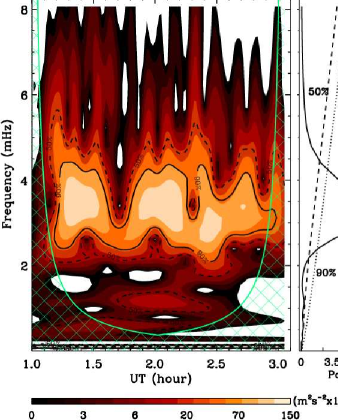
In order to understand the evolution of flare induced seismic waves in the Sun, we also require the information related to time evolution of high energy radiations from the Sun during the flare. As mentioned earlier, RHESSI missed the first impulsive phase of the flare in hard X-ray emissions. On the other hand, NoRP fully covered this flare in microwave emissions and simultaneously the GOES spacecraft has observed this event in soft X-ray emissions from the Sun before, during and after the flare. For this flare event, the flare intensity was highest at 02:25 UT as seen in microwave emission observations from NoRP (Ning, 2008; Minoshima et al., 2009). However, the soft X-ray observations from GOES show peak intensity around 02:35 UT. The difference in the peak time of the flare as observed by NoRP and GOES could be explained as follows. The microwave flare observations represent the energy released as a proxy for the hard X-ray observations while the soft X-ray observations track the thermal emission from the hot plasma that is evaporated into the coronal loops as a result of the energy release. Since the microwave emission profile during the flare has been already shown by Ning (2008) and Minoshima et al. (2009), here we plot the time evolution of GOES soft X-ray emissions from the Sun during the flare in the top panel of Figure 2. Getting back to the analysis of velocity signals in the active region during the flare, we have computed a root mean square (rms) velocity map from the tracked GONG Dopplergrams for the period between 02:00 UT and 03:02 UT and for the same field-of-view as shown in the Figures 1(a). The corresponding surface plot of this rms map is shown in the Figure 1(c). The Figure 1(b) clearly shows a relatively big bright patch (indicated by ‘K’ in this image) in the localized penumbral region of the active region, which is the site of flare induced large velocity flows. We have also marked another bright region ‘P’ in the penumbra (diagonally opposite to ‘K’). ‘K’ and ‘P’ are locations of peaks which are higher than 10, where is the rms of the spatial distribution of the values displayed in the Figures 1(b) and 1(c). We have also chosen a region ‘Q’ in the quiet region (far away from the active region) for comparison. We have analyzed the mean velocity flows in grids of 33 pixels surrounding the centroids of the regions ‘K’, ‘P’, and ‘Q’. In the Figure 2, we show the temporal evolution of line-of-sight velocity signals obtained for the regions ‘K’, ‘P’ and ‘Q’, respectively with respect to the evolution of GOES soft X-ray flux during the flare. We note that the line-of-sight velocity of the region ‘K’ evolves from a downflow of 500 m/s at 01:00 UT and changes into an upflow at 02:00 UT. It shows transient enhancement at 02:26 UT, during the main impulsive phase of the flare, and thereafter decreases to 100 m/s around 02:45 UT. This evolution is modulated by an oscillatory behavior. The region ‘P’ shows a more gradual evolution from an upflow of 200 m/s at 01:00 UT to a downflow of 200 m/s at 02:00 UT and finally reverts back to the original upflow after the flare. The oscillatory modulation is seen for this case also. The region ‘Q’ shows the normal solar oscillations about a zero mean. The Wavelet Power Spectrum (WPS) and Global-wavelet Power Spectrum (GWPS) obtained for the regions ‘K’, ‘P’ and ‘Q’, respectively, are shown in the Figures 3(a), 4(a), and 5(a). The GWPS is a collapsogram of the WPS along time. The Figures 3(b), 4(b) and 5(b) show the scale-average variance obtained from the corresponding WPS in the frequency regimes: (2–5 mHz), and (5–8 mHz), respectively in the top and the bottom panels. Basically, these are collapsograms of the WPS along the frequency of the wavelet in the chosen range. For this quantity, we have calculated the significance levels for 50% and 90% probability. These results indicates major enhancement in high-frequency (5–8 mHz) velocity oscillations in the region ‘K’ at about 02:30 UT which is around the impulsive phase of the flare. In the frequency regime (2–5 mHz) where the modes are expected, the power is suppressed in the penumbral regions ‘K’ and ‘P’ (top panels of Figure 3(b) and 4(b)), which is attributed to the absorption of modes by magnetic field concentrations in these penumbral regions. Whereas, in a quiet region ‘Q’ of the Sun, the power of the modes is above 50% and 90% significance levels (top panel of Figure 5(b)). Finally, at high frequency (5–8 mHz), significant increase of power after the flare is observed in the average variance (bottom panel of Figure 3(b)) for the region ‘K’. We do observe a feeble increase (less than 50% significance level) in power in the frequency regime (2–5 mHz) during the flare in the region ‘K’ while no flare related enhancements are observed for the regions ‘P’ and ‘Q’.
3.2 ANALYSIS OF GLOBAL VELOCITY OSCILLATIONS USING GOLF VELOCITY DATA
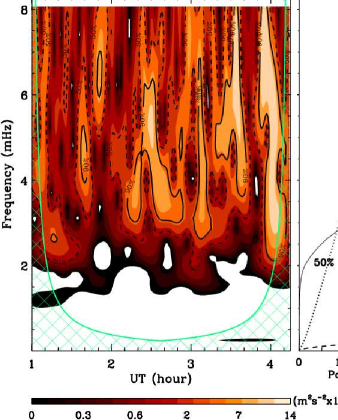
The temporal evolution of the filtered velocity signals from GOLF instrument between 01:00 UT and 04:15 UT spanning the flare event of 13 December 2006 is shown in the Figure 2 (second panel from the top). These velocity oscillations show a relative increase in the amplitude of velocity oscillations after the flare. Wavelet transform is applied to the time series of these velocity signals. The panels in Figure 6(a) show the WPS and GWPS obtained from the aforementioned velocity time series from GOLF. Here, we observe enhanced high-frequency power in the global-velocity oscillations in the Sun after the flare. In the Figure 6(b), we show the scale-average variance in the frequency regimes: (2–5 mHz) and (5–8 mHz), respectively in the top and the bottom panels, obtained from the WPS for GOLF data as shown in the Figure 2. A close inspection of the scale-average variance in the high-frequency regime reveals that there is a small enhancement in high-frequency pulses during the impulsive phase of the flare (02:30 UT), then it drops down and again depicts major pulses with confidence level more than 90% beginning 03:30 UT (an hour later to the flare maximum). We conjecture that the enhanced velocity pulses seen during the flare is the contribution from the chromospheric oscillations, whereas the major enhancement in the velocity pulses seen several minutes later to the flare is contribution from photospheric oscillations. This could be understood as follows. According to Cessateur et al. (2010), the GOLF observations will be limited to photospheric heights in the quiet Sun, however these observations will become sensitive to chromospheric heights during the flare. Hence, just after the flare, the pulses seen in the GOLF data could be a contribution from the chromospheric oscillations. These oscillations could be interpreted as a narrowband oscillatory response of the chromospheric acoustic resonator to a broadband impulsive excitation as suggested by Botha et al. (2011). However, the strong pulses observed by the GOLF much later to the flare should be from the photospheric oscillations as the GOLF observations would return to normal mode. Here, the presence of the pulses corresponding to the enhanced chromospheric oscillations is also consistent with the chromospheric umbral oscillations seen by Kosovichev & Sekii (2007) in the SOT/Hinode Ca ii H data during this flare event.
3.3 ANALYSIS OF GLOBAL VELOCITY OSCILLATIONS USING GONG VELOCITY DATA
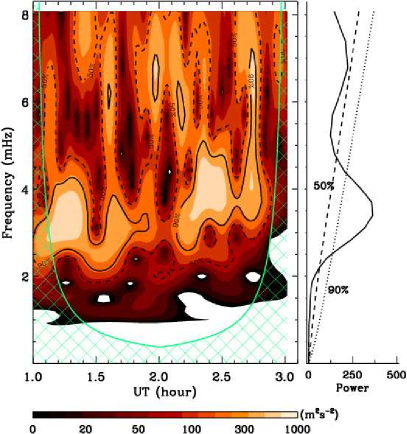
The sequence of GONG full-disk Dopplergrams obtained during 01:00-03:02 UT spanning the flare event is subjected to the two-point backward difference filter to enhance the velocity signals from modes and high-frequency waves above the solar background. These filtered Dopplergrams are then collapsed (excluding the limb pixels to avoid noise) to a single velocity value, which should represent the global modes of oscillations in the Sun (Kumar et al., 2010). The analysis of these velocity signals would give us the opportunity to compare the behaviour of flare induced global waves in the Sun at different heights in the solar atmosphere. The temporal evolution of these filtered full-disk collapsed velocity signals is shown in the Figure 2 (third panel from the top). Here, we observe that these velocity signals are dominated by normal -mode oscillations similar to those seen in the time series for the Q-region as shown in the Figure 2 (sixth panel from the top). In the Figure 7(a), we show the WPS and GWPS obtained from the aforementioned velocity time series from GONG. Here, we do observe enhanced high-frequency power in the global-velocity oscillations in the Sun after the flare. In the Figure 7(b), we show the scale-average variance in the frequency regimes: (2–5 mHz) and (5–8 mHz), respectively in the top and the bottom panels, obtained from the WPS as shown in the Figure 7(a). The scale-average variance in the high-frequency regime indicates enhancement in high-frequency pulse after the impulsive phase of the flare. However, the epoch of this enhancement is different from that seen in the GOLF data. This could be attributed to the different observing heights of these two instruments and their behaviour during the flare. As mentioned in the above Section, GOLF observations would get affected during the flare, however the GONG observations are expected to be maintained in the same height in the solar atmosphere during the flare.
4 DISCUSSION AND CONCLUSIONS
The flare event of 13 December 2006 that occurred in the active region NOAA 10930 has remained very interesting for the solar researchers as it has provided an opportunity to understand various inter-linked physical processes taking place in the different layers of the Sun, from photosphere to the corona. Also, there is an indication of a connection between the flare induced local and global oscillations in the Sun. The impact of this flare (of class X3.4) was very much pronounced on the solar photosphere and chromosphere. The G-band (4305 Å) photospheric images obtained by SOT on board Hinode spacecraft have shown flare ribbons and lateral motion of penumbral filaments during the flare. The chromospheric observations taken by SOT in Ca ii H (3968 Å) show sustained high-frequency umbral oscillations induced by this flare (Kosovichev & Sekii, 2007). The photospheric velocity observations from GONG also show enhanced high-frequency seismic signals in the localized regions of the active region following the impulsive phase of the flare. Sych et al. (2009) have reported bursts of microwave emission with 3 minute intervals during several flares which they relate to the photospheric 3 minute oscillations in the active regions. It is quite possible that the sustained chromospheric high-frequency umbral oscillations as seen by (Kosovichev & Sekii, 2007) are also related to the enhanced high-frequency oscillations in the localized regions of the active region as seen in the GONG data. The location of the velocity change is stationary and away from the G-band flare ribbons (c.f. Minoshima et al. (2009)). This is in contrast to the sites of velocity changes reported for the 28 October 2003 flare by Venkatakrishnan et al. (2008), which were located in the photospheric Doppler ribbons and were seen to move co-spatially with the H flare ribbons. The earlier studies have reported seismic emissions either at the location of moving hard X-ray footpoints or in the H flare kernels (Venkatakrishnan et al., 2008, and references therein). Therefore, their observations could be explained by the possible physical processes like: (i) chromospheric shocks propagating through the photosphere and into the solar interior (Fisher et al., 1985), or (ii) high-energy particle beam impinging on the solar photosphere (Zharkova & Zharkov, 2007). However, the present observation is a new kind of photospheric response to a solar flare. Therefore, it requires a different mechanism to produce the seismic response. The Lorentz force generated by the magnetic field changes has been shown to be large enough to power seismic waves (Hudson et al., 2008; Petrie & Sudol, 2010). Hudson et al. (2008) have estimated that the Lorentz forces of the size dynes could be responsible for generating seismic waves. It is worth noting that we do see sudden line-of-sight magnetic field changes (85 G) as obtained from GONG magnetograms in the affected region ‘K’ (mean magnetic field 1200 G) that could result in Lorentz force () of the required order ( dynes) over the area of the region ‘K’ (). We have also examined whether the magnetic fluctuations in the penumbral region ‘K’ are the result of any serious cross-talk from the velocity fluctuations in this region and found no evidence for this. However, our estimate suffers from the lack of vector magnetic field data spanning the flare event. In this context, it is important to mention the findings of Brown et al. (1992). Their observations indicate that there are localized patches of magnetic flux which act as sources of high-frequency oscillations. This conclusion was based on spatial maps of acoustic power distribution and magnetograms. However, they had not looked at the transient effects. On the other hand, we report on localized enhancement in line-of-sight velocities in the active region related to a flare and these flare induced seismic signals have significant high-frequency oscillations. But in both cases, the magnetic field seems to be the driving force behind these high-frequency oscillations.
The results of wavelet analysis of GOLF velocity data spanning the flare event are shown in the Figures 6(a) and 6(b). As mentioned earlier, we could use the GOLF data for the period from 01:00 UT to 04:15 UT on 13 December 2006, which covers the GONG observations of the flare as well as post-flare periods. The WPS obtained from the GOLF data shows post-flare enhancements in the global velocity oscillations. The corresponding GWPS shows significantly enhanced power beyond 5.5 mHz, the acoustic cut-off frequency of the solar photosphere. This is different from the high-frequency power enhancement seen in the GWPS obtained from the full-disk collapsed GONG velocity data (c.f., right panel of the Figure 7(a)). However, the bands of enhancements seen in the two cases are different, which is because of the following. The GONG observations will remain photospheric in nature during the quiet and flaring conditions as Ni i line is formed deep in the photosphere. However, GOLF observations are sensitive to photospheric heights during the quiet phase while it becomes sensitive to chromospheric heights during the flare (Cessateur et al., 2010). Therefore, the global pseudo-modes observed by the GOLF will have contributions from chromospheric oscillations during the flare and later to the flare, it will be sensitive to the photospheric oscillations. The GWPS obtained from the GOLF data will have mixed effect from both, chromospheric and photospheric oscillations. The Figure 6(b) shows the scale-average variance obtained from the GOLF data for the period 01:00 UT to 04:15 UT. This is again a little different from the scale-average variance obtained from the GONG full-disk collapsed velocity data (Figure 7(b)) which could be attributed to the same: different heights of formation of the Na D and Ni i lines. In the Figure 6(b), one can notice a clear difference in the behavior of the scale-average variance before the flare as compared to its behavior after the flare . We observe strong high-frequency pulses (above 90 confidence level) in the Sun after the flare. This power enhancement is higher than what was seen for a X17 class flare (Kumar et al., 2010). However, at this point in time, we can not give any definite physical scenario to explain this global behavior. In summary, we note that the significant enhancement of power above the photospheric cut-off frequency (5.3 mHz) in the localized velocity oscillations during the flare appears to be accompanied by the flare related enhancements seen in disk-integrated velocity observations of the Sun. If confirmed, these results might be indicative of a connection between flare induced localized seismic response of the solar photosphere and the excitation of global oscillations in the Sun. However, the future multi-wavelength observations of the Sun-as-a-star with GOLF-NG (Turck-Chièze et al., 2008) and SONG (Grundahl et al., 2011) along with the high-cadence full-disk data from Solar Dynamics Observatory (SDO) spacecraft would be very useful for this kind of study.
The above studies will refine our knowledge about the seismic counterparts of transient events, such as flares, in the Sun. The recent space missions dedicated to asteroseismology, such as Kepler (Basri et al., 2005; Chaplin et al., 2011) and CoRot (Michel et al., 2008; García et al., 2009), provided high-quality data to probe the magnetic activity cycles (García et al., 2010) and starspots (Mosser et al., 2009; Mathur et al., 2010) in other stars. Therefore, we can also hope for identifying the astroseismic signature of stellar flares with better understanding of such connections.
References
- Asai et al. (2008) Asai, A., Hara, H., Watanabe, T., Imada, S., Sakao, T., Narukage, N., Culhane, J. L., & Doschek, G. A. 2008, ApJ, 685, 622
- Basri et al. (2005) Basri, G., Borucki, W. J., & Koch, D. 2005, New A Rev., 49, 478
- Botha et al. (2011) Botha, G. J. J., Arber, T. D., Nakariakov, V. M., et al. 2011, ApJ, 728, 84
- Brown (1971) Brown, J. C. 1971, Sol. Phys., 18, 489
- Brown et al. (1992) Brown, T. M., Bogdan, T. J., Lites, B. W., et al. 1992, ApJ, 394, L65
- Cessateur et al. (2010) Cessateur, G., Kretzschmar, M., Dudok, W., et al. 2010, Sol. Phys., 263, 153
- Chaplin et al. (2011) Chaplin, W. J., Kjeldsen, H., Christensen-Dalsgaard, J., et al. 2011, Science, 332, 213
- Culhane et al. (2007) Culhane, J. L., Harra, L. K., James, A. M., et al. 2007, Sol. Phys., 243, 19
- Domingo et al. (1995) Domingo, V., Fleck, B., & Poland, A. I. 1995, Sol. Phys., 162, 1
- Fisher et al. (1985) Fisher, G. H., Canfield, R. C., & McClymont, A. -N. 1985, ApJ, 289, 425
- Gabriel et al. (1995) Gabriel, A. H., Grec, G., Charra, J., et al. 1995, Sol. Phys., 162, 61
- García et al. (2010) García, R. A., Mathur, S., Salabert, D., Ballot, J., Régulo, C., Metcalfe, T. S., & Baglin, A. 2010, Science, 329, 1032
- García et al. (2009) García, R. A., et al. 2009, A&A, 506, 41
- García et al. (2005) García, R. A., et al. 2005, A&A, 442, 385
- García & Ballot (2008) García, R. A., Ballot, J. 2008, A&A, 477, 611
- García et al. (1998) García, R. A., et al. 1998, ApJ, 504, L51
- Golub et al. (2007) Golub, L., et al. 2007, Sol. Phys., 243, 63
- Gosain et al. (2009) Gosain, S., Venkatakrishnan, P., & Tiwari, S. K. 2009, ApJ, 706, L240
- Gosain, & Venkatakrishnan (2010) Gosain, S., & Venkatakrishnan, P. 2010, ApJ, 720, L137
- Grundahl et al. (2011) Grundahl, F., et al. 2011, J. Phys. Conf. Ser., 271a, 2083
- Harvey & The GONG Instrument Team (1995) Harvey, J., & The GONG Instrument Team. 1995, in Astronomical Society of the Pacific Conference Series, Vol. 76, GONG 1994. Helio- and Astro-Seismology from the Earth and Space, ed. R. K. Ulrich, E. J. Rhodes Jr., & W. Dappen, 432
- Hudson & Ohki (1972) Hudson, H. S., & Ohki, K. 1972, Sol. Phys., 23, 155
- Hudson et al. (2008) Hudson, H. S., Fisher, G. H., & Welsch, B. T. 2008, in Subsurface and Atmospheric Influence in Solar Activity, ASP Conf. Series, 383, 221
- Imada et al. (2008) Imada, S., Hara, H., Watanabe, T., Asai, A., Minoshima, T., Harra, L. K., & Mariska, J. T. 2008, ApJ, 679, L155
- Imada et al. (2007) Imada, S., Nakamura, R., Daly, P. W., Hoshino, M., Baumjohann, W., Mühlbachler, S., Balogh, A., & Rème, H. 2007, Journal of Geophysical Research (Space Physics), 112, 3202
- Isobe et al. (2007) Isobe, H., et al. 2007, PASJ, 59, 807
- Jing et al. (2008) Jing, J., Chae, J., & Wang, H. 2008, ApJ, 672, L73
- Jiménez-Reyes et al. (2007) Jiménez-Reyes, S. J., et al. 2007, ApJ, 654, 1135
- Jiménez et al. (2005) Jiménez, A., Jiménez-Reyes, S. J., Garcia, R. A. 2005, ApJ, 623, 1215
- Kakinuma & Swarup (1962) Kakinuma, T., Swarup, G. 1962, ApJ, 136, 975
- Karoff & Kjeldsen (2008) Karoff, C., Kjeldsen, H. 2008, ApJ, 678, 73
- Kosovichev & Sekii (2007) Kosovichev, A. G., Sekii, T. 2007, ApJ, 670, 147
- Kosugi et al. (2007) Kosugi, T., et al. 2007, Sol. Phys., 243, 3
- Kosugi et al. (2007) Kosugi, T., et al. 2007, Sol. Phys., 243, 3
- Kumar et al. (2011) Kumar, B., et al. 2011, J. Phys. Conf. Ser., 271a, 2020
- Kumar et al. (2010) Kumar, B., Mathur, S., García, R. A., & Venkatakrishnan, P. 2010, ApJ, 711, L12
- Li et al. (2009) Li, C., Dai, Y., Vial, J., Owen, C. J., Matthews, S. A., Tang, Y. H., Fang, C., & Fazakerley, A. N. 2009, A&A, 503, 1013
- Liu et al. (2007) Liu, Y., Liang, X. S., & Weisberg, R. H. 2007, J. Atmos. and Ocean. Tech., 24, 2093
- Mathur et al. (2010) Mathur, S., García, R.A., Catala, C. et al. 2010, A&A, 518, 53
- Minoshima et al. (2009) Minoshima, T., et al. 2009, ApJ, 697, 843
- Michel et al. (2008) Michel, E., Baglin, A., Auvergne, M. et al. 2008, Science, 322, 558
- Mosser et al. (2009) Mosser, B., Michel, E., Appourchaux, T. et al. 2009, A&A, 506, 33
- Ning (2008) Ning, Z. 2008, Sol. Phys., 247, 53
- Pallé et al. (1999) Pallé, P. L., et al. 1999, A&A, 341, 625
- Petrie & Sudol (2010) Petrie, G. J. D., & Sudol, J. J. 2010, ApJ, 724, 1218
- Ravindra et al. (2011) Ravindra, B., Venkatakrishnan, P., Tiwari, S. K. et al. 2011, ApJ, 740, 19
- Su et al. (2007) Su, Y., et al. 2007, PASJ, 59, 785
- Sych et al. (2009) Sych, R., Nakariakov, V. M., Karlicky, M. et al. 2009, A&A, 505, 791
- Torrence & Compo (1998) Torrence, C., & Compo, G. P. 1998, Bulletin of the American Meteorological Society, 79, 61
- Tsuneta et al. (2008) Tsuneta, S., et al. 2008, Sol. Phys., 249, 167
- Turck-Chièze et al. (2008) Turck-Chièze, S., et al. 2008, J. Phys. Conf. Ser., 118a, 2044
- Ulrich et al. (2000) Ulrich, R. K., et al. 2000, A&A, 364, 799
- Venkatakrishnan et al. (2008) Venkatakrishnan, P., Kumar, B., Uddin, W. 2008, MNRAS, 387, L69
- Wang et al. (2008) Wang, S. J., Yan, Y. H., Liu, Y. Y., Fu, Q. J., Tan, B. L., & Zhang, Y. 2008, Sol. Phys., 253, 133
- Zharkova & Zharkov (2007) Zharkova, V. V., Zharkov, S. I. 2008, ApJ, 664, 573
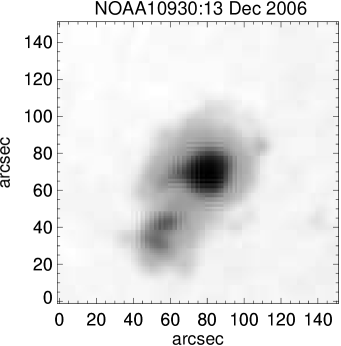
(a)
(b)

(c)


(a) (b)

(a) (b)

(a) (b)
(a) (b)

(a) (b)