11email: bianchin@iasfbo.inaf.it 22institutetext: INAF/IASF-Milano, Via Bassini 15, I-20133 Milano, Italy 33institutetext: Dipartimento di Fisica, Università di Ferrara, Via Saragat 1, I-44100, Ferrara, Italy 44institutetext: INAF - Osservatorio Astronomico di Brera, Via Bianchi 46, I-23807 Merate, Italy 55institutetext: W. W. Hansen Experimental Physics Laboratory, Kavli Institute for Particle Astrophysics and Cosmology, Department of Physics and SLAC National Accelerator Laboratory, Stanford University, Stanford, CA 94305, USA
The first GRB survey of the IBIS/PICsIT archive
Abstract
Context. The multi-purpose INTEGRAL mission is continuously contributing to Gamma Ray Burst (GRB) science, thanks to the performances of its two main instruments, IBIS and SPI, operating in the hard X-ray / soft -ray domain.
Aims. We investigate the possibilities offered to the study of GRBs by PICsIT, the high-energy detector of the IBIS instrument.
Methods. We searched for transient episodes in the PICsIT light curves archive from May 2006 to August 2009, using stringent criteria optimized for the detection of long events. In the time interval under examination PICsIT provides an energy coverage from 208 to 2600 keV, resolved in eight energy channels, combined with a fine time resolution of 16 ms.
Results. PICsIT successfully observes GRBs in the keV energy range with an incoming direction spread over half the sky for the brightest events. We compiled a list of 39 bursts, most of which are confirmed GRBs or simultaneous to triggers from other satellites/instruments. We produced light curves with a time sampling down to 0.25 s in three energy intervals for all events. Because an adequate response matrix is not yet available for the PICsIT burst sample, we obtained a calibration coefficient in three selected energy bands by comparing instrumental counts with physical fluences inferred from observations with different satellites. The good time resolution provided by the PICsIT data allows a spectral variability study of our sample through the hardness ratio.
Key Words.:
Gamma-ray burst: general - Instrumentation: detectors1 Introduction
The INTEGRAL satellite (Winkler et al. 2003), launched in October 2002 and still in operation, is an international observatory exploiting a set of coded mask instruments to explore the sky in the hard X-ray / soft -ray domain with fine imaging and high spectral resolution. Although INTEGRAL was conceived as a multi-purpose high-energy mission not specifically optimized for the observation of GRBs, it has been making a relevant contribution to the study of these fascinating and in many respects still mysterious events thanks to the high sensitivity and good imaging performances of its two main instruments IBIS (Ubertini et al. 2003) and SPI (Vedrenne et al. 2003). Gamma ray bursts are detected in the IBIS field of view at a rate of 10 per year. Their positions, with an accuracy of few arcminutes, are automatically distributed in near real time thanks to the INTEGRAL burst alert system (IBAS, Mereghetti et al. 2003), enabling rapid follow-up observations. A systematic spectral analysis of all GRBs detected with IBIS until 2008 has been presented by Vianello et al. (2009), while Foley et al. (2008) carried out a comprehensive study of a sample of 46 bursts, focusing mainly on their timing properties using IBIS and SPI. INTEGRAL is also providing light curves for about 15 triggers per month (Rau et al. 2005), detected with the anticoincidence shield (ACS) of the SPI instrument. These light curves, with 50 ms resolution, are used for GRB triangulations with other satellites of the inter planetary network (IPN, Hurley et al. 2004). Although SPI-ACS provides no spectral information, Viganò & Mereghetti (2009) derived a calibration factor to convert the instrumental count rate to physical flux on the basis of the observation of a large sample of GRBs.
In this paper we explore the possibilities for GRB studies offered by PICsIT (Di Cocco et al. 2003), the high-energy detector of the IBIS instrument, by presenting the results of a search for GRBs detected from May 2006 to August 2009.
2 Data analysis
2.1 PICsIT data
| Channel | Energy Band |
|---|---|
| (keV) | |
| 1 | 208-260 |
| 2 | 260-312 |
| 3 | 312-364 |
| 4 | 364-468 |
| 5 | 468-572 |
| 6 | 572-780 |
| 7 | 780-1196 |
| 8 | 1196-2600 |
INTEGRAL moves along a highly eccentric orbit with a revolution period around the Earth of 3 days, perigee of km and apogee of km. Observations are carried out when the satellite is above the radiation belts, at an altitude higher than km. To optimize the image reconstruction a dithering strategy is adopted during most scientific acquisitions: each observation is split into a set of pointings (science windows - ScWs) covering a grid of directions spaced apart according to a rectangular or an hexagonal pattern. The typical duration of each ScW is s.
The PICsIT detector consists of a pixels array of CsI(Tl) scintillators, operating in the nominal energy band 175 keV-10 MeV. A combination of active and passive shieldings partially surrounds the detector to reduce the background and to limit its field of view to the directions corresponding to the coded mask (). With increasing energy the passive shielding becomes progressively transparent to the incoming radiation and PICsIT is expected to detect GRBs even at far off-axis directions, outside its nominal field of view.
The first GRB detected by PICsIT (GRB 021125-Malaguti et al. 2003) occurred during the in-flight calibration phase, when data acquisition (in photon-by-photon mode) maintained the full spatial, temporal and energy information. When PICsIT is operated in standard scientific mode, its data are pre-processed on-board and organized in different kinds of histograms before they are sent to the ground. This is required to comply with the tight telemetry rate available, which does not permit to transmit the whole information (time, energy and position) of each detected count. The standard histograms consist of spectral imaging (SI) and spectral timing (ST) data, optimized for spatial and temporal resolution, respectively. Spectral imaging histograms preserve the full spatial information and can be used to derive sky images in different energy bands. However, they are integrated over the whole duration of each ScW (typically a few thousand seconds), and are in general useless for GRBs, which are bright on shorter time scales and therefore diluted and not detectable in the SI data (the only exception to date is the very bright and long GRB 041219A, which has been detected in both SI and ST data sets - Di Cocco et al. 2007).
In this work we used the ST data, which provide the total rate of events on the detector plane with a configurable time binning down to 1 ms, and an energy resolution in up to eight energy channels. The ST data do not permit to produce images because the spatial information is not preserved. The on-board configuration of the ST data has been changed a few times during the mission lifetime to refine the energy sampling and enhance the signal-to-noise level of the detected sources. We restricted the analysis to the time period from May 2006 to August 2009 (revolutions 440–834), during which the ST time binning was set to 16 ms and the energy channels, covering the range 208-2600 keV, remained fixed at the nominal values given in Table 1.
| Burst | ScW | UT | T90 | Fluence | Peak Flux | Energy range | Instrument | Ref | Notes |
|---|---|---|---|---|---|---|---|---|---|
| (hh:mm:ss) | (s) | (ct) | (ct/s) | (keV) | |||||
| 060805B | 4650034 | 14:27:15 | 4.7 0.4 | 6315186 | 3600208 | 260-2600 | IA, K, R | (1) | |
| 060819 | 4700017 | 18:28:13 | 14 2 | 12228305 | 2394195 | 260-2600 | IA, K | (a) | |
| 060901 | 4740058 | 18:43:56 | 8 1 | 2199182 | 1671186 | 260-780 | II, K | (2) | (b) |
| 060905 | 4750078 | 14:48:51 | 239 47 | 25055849 | 1918188 | 260-572 | |||
| 060928 | 4830025 | 01:20:06 | 31 4 | 38936462 | 4966220 | 260-2600 | B, IA, K, R, S | (3) | (c) |
| 061031 | 4940040 | 12:19:47 | 34 3 | 4707329 | 1367186 | 260-572 | K | (d) | |
| 061122 | 5010073 | 07:56:52 | 1.50 | 2196 | 3212 | 260-780 | II, K | (4) | (e) |
| 061222A | 5110078 | 03:30:15 | 10.5 1.5 | 3509236 | 1871191 | 260-1196 | B, K | (5) | (f) |
| 070207 | 5270055 | 21:00:48 | 10.0 0.5 | 6178255 | 3700210 | 260-2600 | B, IA, K, S | (6) | |
| 070227B | 5340043 | 21:39:23 | 32 13 | 3341316 | 672179 | 260-572 | IA, R | (g) | |
| 070326 | 5430018 | 00:45:26 | 26.2 0.7 | 3080302 | 1466189 | 260-468 | IA | (f) | |
| 070329 | 5440037 | 14:59:48 | 40 3 | 8720495 | 1048185 | 260-2600 | IA, K | (g) | |
| 070403 | 5460003 | 12:40:28 | 47 3 | 5788347 | 701181 | 260-468 | |||
| 070418 | 5510013 | 17:16:19 | 31 2 | 5471369 | 1461192 | 260-780 | K | (f) | |
| 070429 | 5540054 | 02:40:28 | 20.500.4 | 3081326 | 1634192 | 260-2600 | (f) | ||
| 070829 | 5950047 | 20:08:36 | 73 1 | 9766618 | 1762194 | 260-1196 | IA, K | ||
| 070917 | 6010058 | 04:41:24 | 7 2 | 2946202 | 111995 | 260-780 | IA, K | (f) | |
| 071003 | 6070014 | 07:40:54 | 12.0 0.3 | 16175302 | 4013218 | 260-2600 | B, K, II | (7) | |
| 071006 | 6080009 | 06:42:08 | 47 8 | 3332401 | 940188 | 260-572 | B, K, IA | (8) |
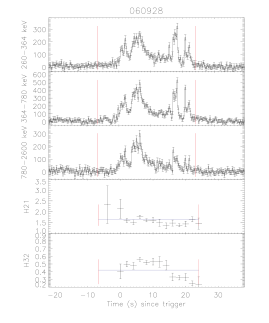
Column description: Burst: name of the event (YYMMDD); ScW: pointing ID in which the event occurred; UT: trigger time; : duration of the event; Fluence: fluence in units of counts, referring to the interval and to the energy interval given in column 7; Peak Flux: in units of count/s in the same time and energy intervals as for fluence; Instrument: telescopes/instruments that observed the event (A = AGILE, B= Swift/BAT, F = Fermi/GBM, II = INTEGRAL/ISGRI, IA = INTEGRAL/SPI-ACS, K= Wind/Konus, R = RHESSI, S = Suzaku/WAM); Ref: GRBs have been documented by: (1) = Hurley et al. (2006b), (2) = Mereghetti et al. (2006b), (3) = Hurley et al. (2006a), (4) = Mereghetti et al. (2006a), (5) = Grupe et al. (2006), (6) = Golenetskii et al. (2007c), (7) = Schady et al. (2007), (8) = Cummings (2007), Notes: (a) = T90 refers to the 260-312 keV range, that gives a better signal to noise ratio. (b) = The bright GRB 060901, detected by INTEGRAL over 20 s, saturated ISGRI telemetry but did not affect PICsIT data. In PICsIT light curve the burst shows a multipeak structure extending over 8 s, in accordance with Konus main event (followed, in Konus data, by a faint tail up to 15 s). (c) = GRB 060928 is structured in two main episodes at 01:17:05 and 01:17:20, with duration s and s, respectively. PICsIT observed both events (Fig. 13) but our analysis has been restricted to the main second event (Fig. 14). (d) = A linear fit of the background was required for T90 computation. (e) = PICsIT light curves are severely affected by data gaps at all energies (Fig. 16). A of 11 s was obtained by McGlynn et al. (2009) with SPI. (f) = For T90 computation the background was fitted to a polynomial function of the third degree. (g) = For T90 computation the background was fitted to a polynomial function of the second degree.
| Burst | ScW | UT | T90 | Fluence | Peak Flux | Energy range | Instrument | Ref | Notes |
|---|---|---|---|---|---|---|---|---|---|
| (hh:mm:ss) | (s) | (ct) | (ct/s) | (keV) | |||||
| 071108 | 6190025 | 21:40:29 | 20.0 0.5 | 9976372 | 5072229 | 260-2600 | IA, K, A | (h) | |
| 080122 | 6440034 | 18:32:43 | 105 4 | 10796743 | 2112199 | 260-1196 | IA, K, S, A, B | (9) | |
| 080204 | 6480067 | 13:56:35 | 14 3 | 9901312 | 4254220 | 260-2600 | K, IA, S, A, B | (10) | |
| 080303 | 6580014 | 21:34:45 | 29.2 1.5 | 31507461 | 8283254 | 260-2600 | IA | ||
| 080319B | 6630025 | 06:12:50 | 42 1 | 29392536 | 1905198 | 260-2600 | B, K | (11) | |
| 080328 | 6660038 | 08:03:12 | 33 2 | 6593419 | 2243200 | 260-1196 | B, K, S, IA | (12) | |
| 080408 | 6700004 | 10:23:25 | 40 1 | 6355424 | 1464194 | 260-780 | (i, f) | ||
| 080514B | 6820005 | 09:55:58 | 6 1 | 5611195 | 3495214 | 260-2600 | A, K, S,IA | (13) | |
| 080607 | 6900002 | 06:07:27 | 10 1 | 4748195 | 2225201 | 260-2600 | B, A, K, IA | (14) | |
| 080613B | 6920007 | 11:12:40 | 31.7 0.5 | 5181417 | 1712197 | 260-1196 | B, K, IA | (15) | |
| 080615 | 6920047 | 04:07:33 | 9.5 0.3 | 6769239 | 2768206 | 260-1196 | K, R | ||
| 080721 | 7040083 | 10:25:14 | 16.0 0.3 | 14627340 | 4888227 | 260-2600 | B, K, IA, R | (16) | |
| 080723B | 7050036 | 13:22:34 | 45 2 | 9936 | 3030 | 260-780 | II, A, K | (17) | (j) |
| 080817A | 7130052 | 03:52:16 | 42 2 | 10461528 | 1509196 | 260-1196 | F, K, IA | (18) | |
| 080918 | 7240065 | 09:44:37 | 2.5 0.3 | 3986147 | 3916220 | 260-2600 | K, IA | ||
| 090528B | 8080058 | 12:22:57 | 81 7 | 6665622 | 1141199 | 260-780 | F, S, K, IA | (19) | (f) |
| 090618A | 8150054 | 08:29:26 | 15 7 | 3032301 | 865198 | 260-1196 | B,A,F,K,S,IA | (20) | (k, f) |
| 090623 | 8170026 | 02:34:30 | 40 2 | 6517489 | 1540204 | 260-1196 | F, S, K, IA | (21) | |
| 090626A | 8180029 | 04:32:11 | 42 1 | 13167545 | 3577221 | 260-2600 | F, S, K, IA, B | (22) | |
| 090809B | 8330036 | 23:28:17 | 9 1 | 3399257 | 1501203 | 260-1196 | F, K IA | (23) | (f) |
Ref: GRBs have been documented by: (9) = Hurley et al. (2008), (10) = Golenetskii et al. (2008f), (11) = Racusin et al. (2008) (12) = Perri et al. (2008), (13) = Rapisarda et al. (2008), (14) = Mangano et al. (2008), (15) = Markwardt et al. (2008), (16) = Marshall et al. (2008), (17) = Götz et al. (2008), (18) = Bissaldi et al. (2008), (19) = von Kienlin (2009a), (20) = Schady et al. (2009), (21) = Rau (2009), (22) = von Kienlin (2009b), (23) = van der Horst (2009). Notes: (h) = We analyzed the main pulse of the event, which is composed of three peaks over 70 s. (i) = The burst was observed by PICsIT in two main episodes separated by 50 s and extending over 120 s. The first smaller peak seems to be affected by count drops and therefore the analysis was conducted on the second event only. (j) = The bright GRB 080723B fell in the ISGRI FoV, with an off-axis angle , and saturated the available telemetry. PICsIT data show gaps at all energies that are limited to few time bins, however, and did not affect the T90 computation. We report the lower limits of the peak flux and fluence. (k) = in PICsIT data the burst occurs 60 s after the Swift/BAT trigger and coincides with the brightest portion of this long event ( s).
2.2 GRB search
In order to search for possible GRBs detected in the PICsIT ST data, we examined the light curves looking for statistically significant excesses above the background counts. The detector background level is not constant: intra-revolution variations are visible when the satellite is close to the radiation belt passage, the relative position of strong sources can cause different background level as a function of the pointing direction, and solar activity can also produce background variations. In addition, the background count rate shows a long-term evolution, which can be ascribed to the detector activation and to the variable cosmic ray environment, modulated with the solar cycle.
We performed our GRB search analyzing each ScW individually, because these are the longest homogeneous periods with a fixed satellite attitude, and are sufficiently short, compared to the timescales of orbital background variations, to approximate the background with a constant value. Therefore, we evaluated the expected background level as follows for any given ScW, energy channel and time rebinning. We first removed all time intervals with large spikes or drops verifying: , where is the number of counts in bin and and are the mean and standard deviation of counts, respectively, computed over the whole ScW. We then defined and as the mean and standard deviation over the cleaned ScW. Once the energy band and the time binning were selected, we defined a burst candidate as an excess in the light curve where the number of counts is higher than a threshold given by . The value of and the sample size (in units of bins) establish the probability of detecting statistical fluctuations above the threshold.
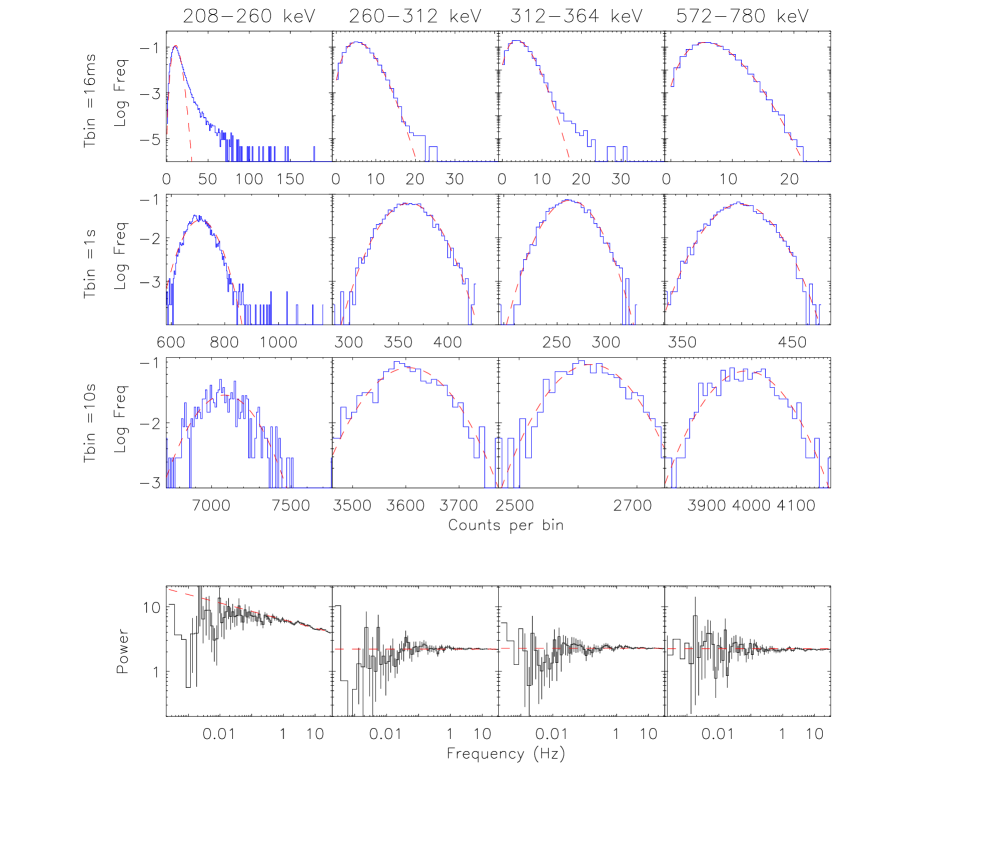
In order to select the most convenient energy range and time binning for the GRB search, we inspected the distribution of counts within ScWs where no GRBs occur for different time binnings and in all available energy channels. Some examples of these count distributions are shown in Fig. 1. We found that the count distribution strongly deviates from the Poissonian statistics in the lowest energy channel. This is confirmed by the Fourier analysis of the light curves. As shown in Fig. 1 (bottom panels), the power spectra above 0.2 Hz are consistent with a constant model (, , , in , and keV, respectively), with the exception of the first energy band, which follows a power law trend above 0.1 Hz. Above keV the count distribution is still not consistent with the expected Poissonian statistics, because power spectra describe a white noise process with observed variance exceeding the Poissonian of at least 10%. For this reason the threshold level for the GRB search is expressed in terms of standard deviation. The different behavior of the first energy band can be ascribed to a significant contribution of charged particles interacting with the detector CsI crystals and inducing long-lasting phosphorescence emission, which is not eliminated by the anti-coincidence system (Segreto et al. 2003). On the basis of this analysis we decided to perform the GRB search in the keV energy band, which seems to be the least affected by the systematic background component and, for the typical spectra of GRBs, maximizes the signal-to-noise ratio.
A preliminary analysis was conducted on the data sample to explore several rebinning and several threshold levels. We selected a threshold level applied to light curves rebinned on s time bins. This value guarantees a probability of statistical fluctuation above the threshold, over the whole data set, of time bins. The search with s bins was carried out twice, with a half-bin offset.
We searched for the GRB candidates using the pre-processed data of all ScWs, without an a priori selection to eliminate the ScWs with potential problems caused by, e.g., high solar activity, bright variable sources, high particle background close to the radiation belt entrance/exit, particular instrumental settings or deviations from the nominal operating parameters. The resulting ScWs with GRB candidates were then manually screened for the above conditions and re-analyzed with the specific standard analysis software osa v.7.0, described in Goldwurm et al. (2003) to derive the relevant physical quantities of the events. The time of occurrence of each burst was refined using light curves with 1 s resolution and then cross-checked with solar flares or high activity revealed by the INTEGRAL radiation environment monitor (IREM, Hajdas et al. 2003), the GEOS net111http://www.sec.noaa.gov and RHESSI monitoring (Lin et al. 2002) to exclude particle events.
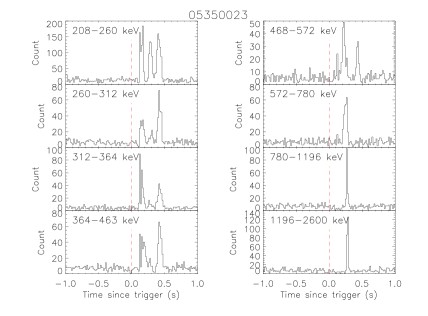
We also performed a search with binning of 1 s and on a subset of our data (revs. ). This resulted in 21 events, 10 of which were also detected with the 10 s bin search. However, a deeper analysis of the remaining 11 events suggests that they are not GRBs. Indeed, the light curves of all these events with the on-board resolution ( ms) show a similar pattern, consisting of three peaks separated by s, the central one dominating the high-energy bands and progressively dimming as energy decreases (Fig.2). Although the origin of these short events is uncertain, they are probably an instrumental effect caused by charged particles interactions. Since the search for short episodes did not add genuine GRBs to the sample of bursts, we restricted the search to the 10 s binning.
3 Results
The PICsIT burst sample selected with the 10 s binning as described above in the period May 2006 - August 2009 consists of the events listed in Table 2. Most of these events (23) have also been detected by other satellites, which provided their localizations, confirming their GRB nature. We are confident that the other events, for which no localizations have been obtained, are also most likely GRBs. Indeed, 11 of them have also been detected by other instruments such as the INTEGRAL/SPI-ACS (sensitive to photons above 80 keV), Wind/Konus (energy range 10 keV-10 MeV), and RHESSI (50 keV-17 MeV). Only four events were detected exclusively by PICsIT. Sixteen bursts are hard events detected up to the highest energy channel (1196-2600 keV), 26 reach the 780-1196 keV band, 5 are not visible above 572 keV, and 2 are observed only up to 468 keV.


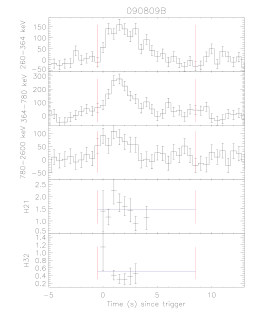
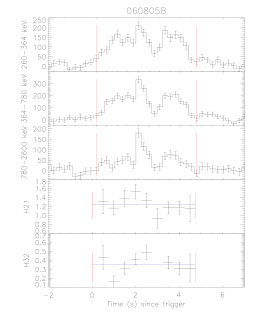
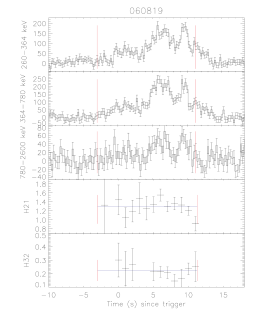
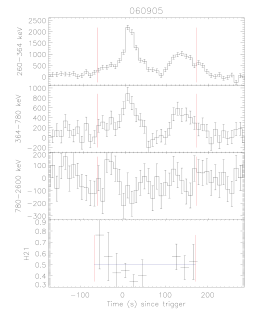
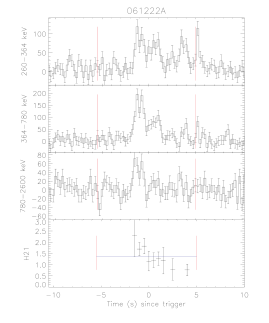
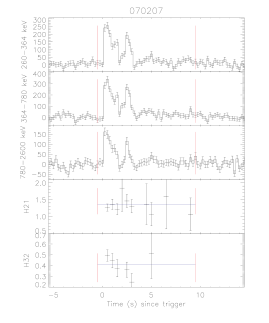
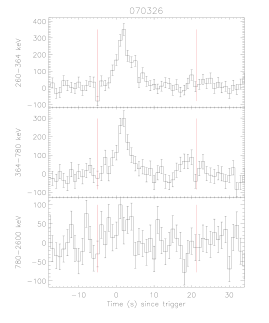
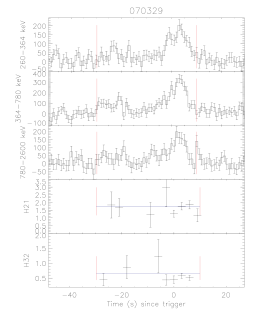
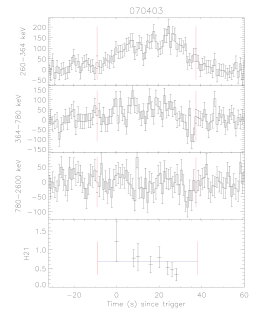
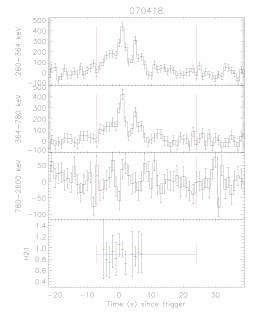
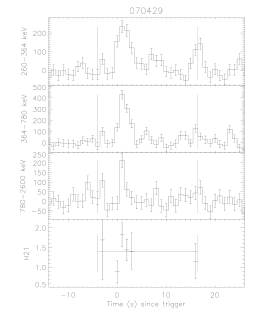
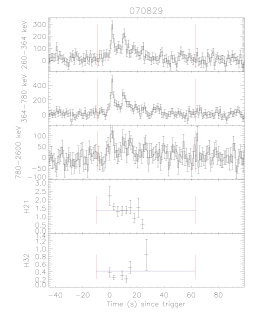
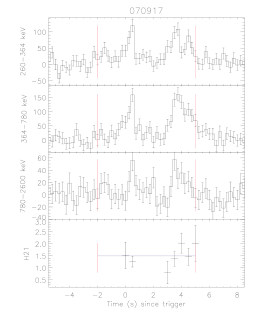
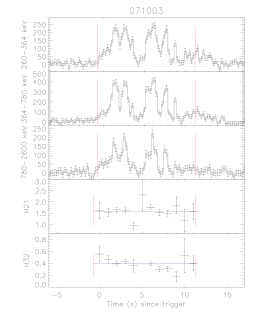
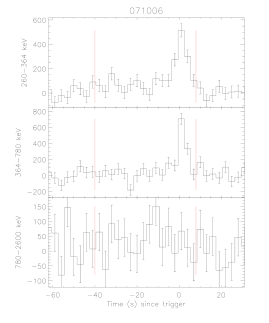
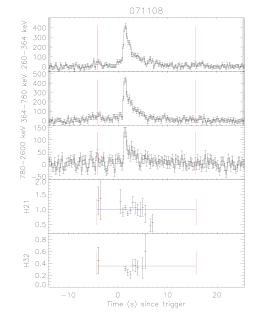
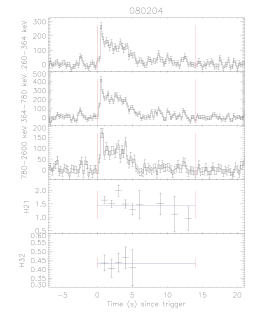
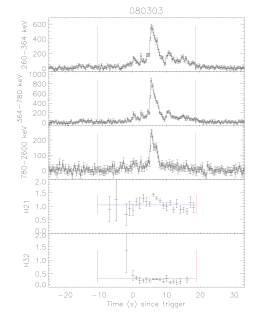
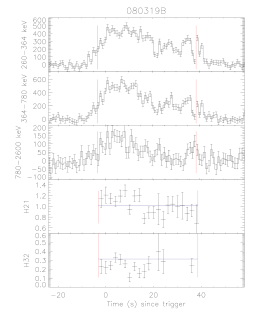
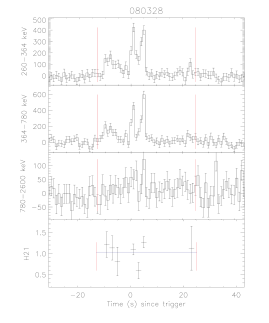
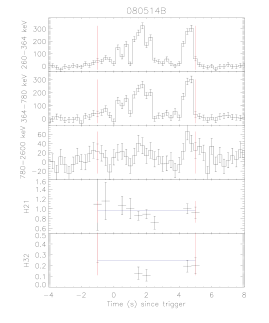
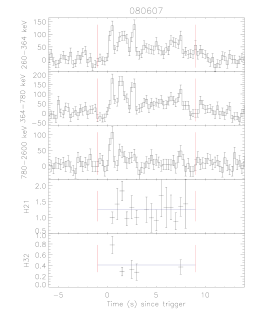
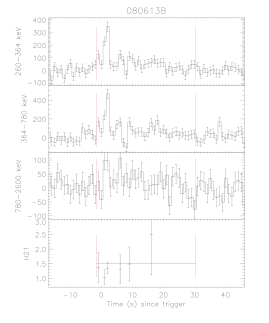
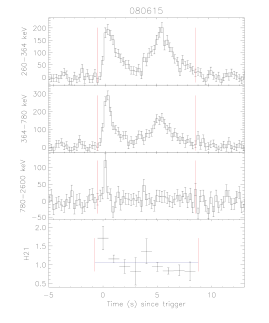
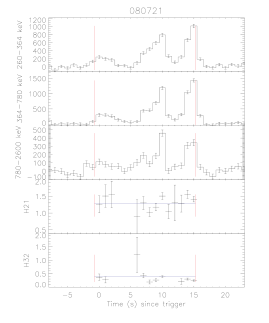
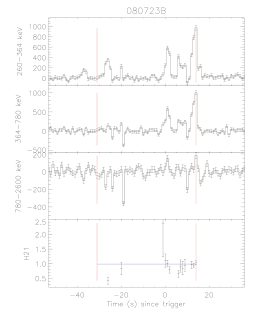
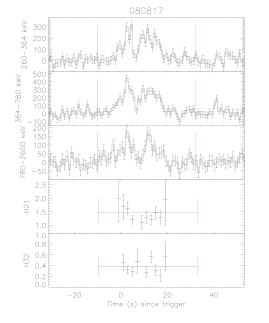
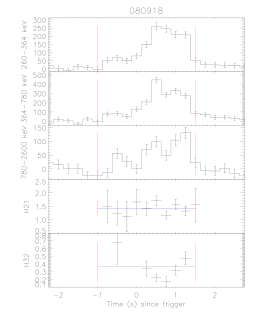
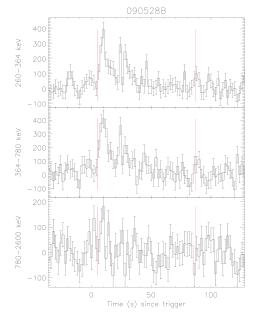
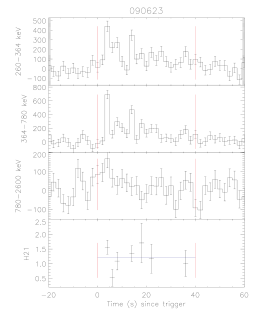
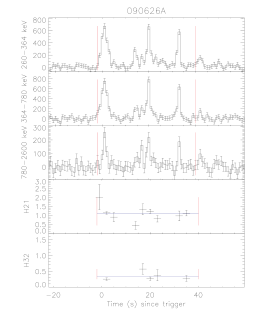
We evaluated the background level in each energy channel by fitting a polynomial to counts measured in two time intervals of a few hundred seconds manually selected before and after the GRB. In all cases a constant was adequate, while a polynomial function up to the third degree was required for a better determination of the T90 interval of 12 events (see notes in Table 2). The T90 duration was computed as described in Koshut et al. (1996) from the background-subtracted light curves in the energy range 260-2600 keV, with the exception of 060819, whose duration was evaluated in the 260-312 keV light curve. The background-subtracted light curves in three energy bands are reported in Figs. 9-48.
The values of fluence and peak flux in Table 2 are reported in instrumental units. Indeed, in the next section we argue that a large part of bursts is expected to occur far off-axis, where a response matrix is not available yet. The fluences refer to the T90 intervals and to the energy range reported in column 7: the energy coverage for each event is given by the energy channels where the fluence verifies the condition , where is the error on the fluence. The first energy channel (208-260 keV) was excluded because it is dominated by the systematic background component described in the previous section. The peak fluxes in the same energy range are for an integration time of 1 s.
3.1 Spectral characterization and PICsIT effective area
| Burst | F (260-2600 keV) | Ref. | ||
|---|---|---|---|---|
| (∘) | (∘) | ( erg cm-2) | ||
| 060805B | 72.4 | 359.3 | 5.90.2 | (1) |
| 060901 | 14.1 | 297.4 | 0.76 | (2) |
| 060928 | 62.4 | 43.2 | 19.17 | (3) |
| 061122 | 7.4 | 220.9 | 0.52 | (4) |
| 061222 | 22.3 | 226.5 | 1.5 | (5) |
| 071003 | 13.5 | 273.1 | 3.8 | (6) |
| 071006 | 55.6 | 233.3 | 1.03 | (7) |
| 080122 | 48.0 | 240 | 4 | (8) |
| 080204 | 18 | 101 | 1.6 | (9) |
| 080319B | 79.7 | 215.7 | 39.5 | (10) |
| 080328 | 22.6 | 0.9 | 1.0 | (11) |
| 080514B | 37.7 | 355.4 | 1.5 | (12) |
| 080607 | 73.7 | 201.4 | 4.8 | (13) |
| 080613B | 39.4 | 134.2 | 1.5 | (14) |
| 080721 | 58.2 | 353.9 | 5.0 | (15) |
| 080723B | 7.9 | 104.7 | 4.3 | (16) |
| 080817A | 57.7 | 94 | ||
| 090528B | 32 | 215 | 2.29 | (17) |
| 090618A | 85.4 | 14.6 | 9.8 | (18) |
| 090623 | 47 | 244 | 2.6 | (19) |
| 090626A | 46 | 182 | 3.1 | (20) |
| 090809B | 53.7 | 41.1 | 1.63 | (21) |
The errors in polar coordinates were neglected when . Fluences were extrapolated in the 260-2600 keV energy range from spectral parameters reported in: (1) = Bellm et al. (2006), (2) = Golenetskii et al. (2006a), (3) = Golenetskii et al. (2006b), (4) = Golenetskii et al. (2006c), (5) = Golenetskii et al. (2006d), (6) = Golenetskii et al. (2007a), (7) = Golenetskii et al. (2007b), (8) = Golenetskii et al. (2008a), (9) = Golenetskii et al. (2008b), (10) = Golenetskii et al. (2008c), (11) = Golenetskii et al. (2008d), (12) = Golenetskii et al. (2008e), (13) = Golenetskii et al. (2008g), (14) = Golenetskii et al. (2008h), (15) = Golenetskii et al. (2008i), (16) = Golenetskii et al. (2008j), (17) = von Kienlin (2009a), (18) = Golenetskii et al. (2009a), (19) = Nakagawa et al. (2009), (20) = Golenetskii et al. (2009b), (21) = van der Horst (2009)
| Energy | K | |
| (keV) | ( erg cm-2 ct-1) | |
| 260-364 | 0.9 | 0.3 |
| 364-780 | 1.6 | 0.6 |
| 780-2600 | 5.7 | 2.0 |
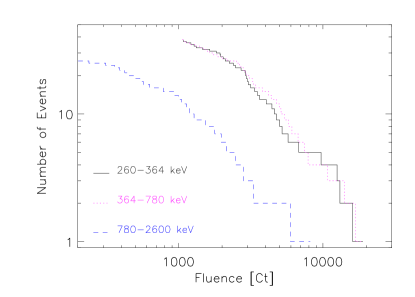
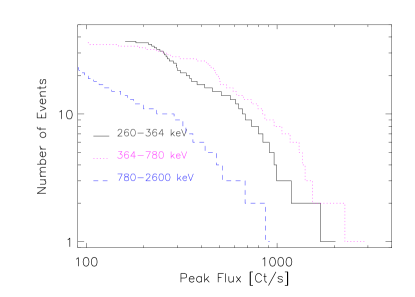
In Fig. 3 we show the cumulative distributions of the instrumental fluences and peak fluxes of the PICsIT burst sample in three energy intervals: 260-364 keV, 364-780 keV and 780-2600 keV. The irregular behavior is likely caused by a non linear relation between instrumental observables and physical fluences and peak fluxes.
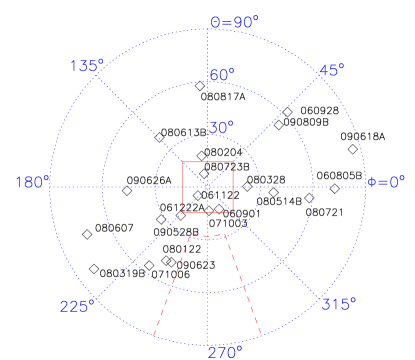
Although not provided by the ST data, the arrival direction of the photons can be expressed in PICsIT coordinates for GRBs with known sky positions from observations with other satellites. This can be made using the instrument attitude parameters stored in the housekeeping data on-board. In Fig. 4 we show the spatial distribution in PICsIT coordinates of 22 events in our sample. The polar angle is the off-axis angle, while is the azimuth, defined so that the direction toward the Sun is at . In the figure we indicated the IBIS FoV and the approximate region occupied by the spectrometer SPI (, ). Despite the low number of events, we note that the region that includes the directions shielded by SPI in the (, ) plane is scarcely populated.
For 21 GRBs in our sample the fluences in physical units and the average spectral parameters are available from observations with other satellites. The spectrum of six events in this subsample is described by a cut-off powerlaw, while 15 events follow a Band function with mean parameters , , keV. On the basis of the spectral parameters reported for each single GRB, we converted the fluence to the PICsIT energy range (260-2600 keV), assuming no spectral evolution and neglecting differences in the reported burst duration. When the same event was measured by more than one instrument, we chose the one whose energy coverage overlapped the most with that of PICsIT. The derived fluences are reported in Table 3 and plotted in Fig. 5 as a function of PICsIT angular coordinates. We note that the four bursts within the PICsIT FoV () span about one order of magnitude in fluence, while at wider off-axis angles only bursts with higher fluences were detected. No significant dependence on the azimuthal angle is evident.
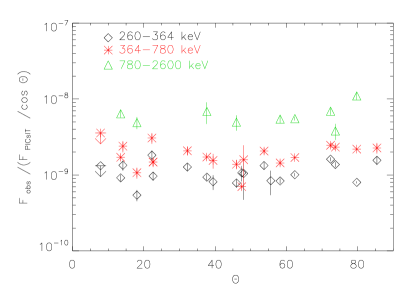
With the exception of GRB 061122, whose light curve is compromised by telemetry saturation, we compared the fluences observed by PICsIT to those derived in the same energy range for 20 GRBs with known spectral parameters. The ratio of the fluences in physical and instrumental units shows a strong dependence on the off-axis angle (see Fig. 6, upper panel), which can be partly compensated by a simple factor, accounting for the geometrical projection effect of the PICsIT detection plane (see Fig. 6, lower panel). The spread (in the worst case of a factor ) is caused by a more complicated energy- and direction-dependent instrumental response as well as to the spectral parameters assumed for each single GRB. Neglecting the residual dispersion, the strong correlation shown in Fig. 7 between physical and instrumental fluences corrected for the geometrical projection can be assessed by a simple conversion coefficient:
| (1) |
computed as the weighted average of the ratio of the two quantities. The derived values of in the three selected energy bands are given in Table 4, with errors estimated as the standard deviation.
The rough calibration derived above allows us to compare the number of GRBs in our sample with the expected burst rate based on results from previous experiments. From the peak flux cumulative distribution in the 260-364 keV energy band (Fig. 3), we can estimate a completeness flux limit at 600 ct/s, where the slope of the distribution flattens because of the decreasing efficiency to detect fainter GRBs at different off-axis angles. Assuming =0.5, and a Band spectrum with average values of the parameters = -1, =-2.3, and Epeak=300 keV (Kaneko et al. 2006), this count-rate limit corresponds to a flux of approximately 1 ph cm-2 s-1 in the 50-300 keV energy domain. From the BATSE LogN-LogP in this energy range (Kommers et al. 2000, Fenimore & Bloom 1995) the expected rate of GRBs with flux above the PICsIT limit is 10 events/yr over a solid angle of 4. This agrees reasonably well with the PICsIT detection rate of 5.5 bursts per year (13 bursts in a net exposure time of 850 days) in approximately half sky.
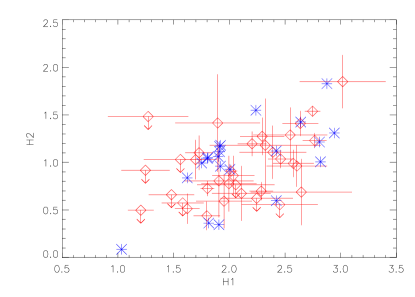
Because most of the dependence on the burst incoming direction is accounted for by the detector area projection coefficient, the ratio between fluences in different energy bands is almost direction-independent. We defined the quantities and , where , , and are the fluences observed by PICsIT in the three selected energy bands, multiplied for the conversion coefficients in Table 4. Figure 8 shows (red diamonds) the hardness ratios H1 and H2 for the 35 bursts in our sample with non-null fluence in the 780-2600 keV band, including also those events without localization. Star (blue) symbols mark the same quantities derived from spectral parameters of GRBs in Table 3. The region populated by PICsIT observables is well confined within the expected values and characterizes the spectral colors of a typical burst observed by PICsIT.
For those spectra described by a Band function we inspected the dependence of instrumental hardness ratio on the spectral parameters, but we found no straightforward correlation of the soft color with the parameter, nor for hard color with the and parameters.
3.2 Spectral variability
| Burst | Const | N | ||
|---|---|---|---|---|
| H21 | ||||
| 060928 | 1.6 | 28.4 | 14 | |
| 070829 | 1.4 | 15.0 | 9 | |
| 071003 | 1.6 | 22.9 | 12 | |
| 080303 | 1.0 | 106.4 | 23 | |
| 080319B | 1.0 | 37.0 | 21 | |
| 080615 | 1.0 | 17.5 | 9 | |
| 080721 | 1.3 | 19.0 | 13 | |
| 080723B | 1.0 | 38.0 | 13 | |
| H32 | ||||
| 060805B | 0.3 | 13.8 | 8 | |
| 060928 | 0.4 | 120.1 | 13 | |
| 071003 | 0.4 | 18.5 | 11 | |
| 080303 | 0.3 | 46.4 | 17 | |
| 080319B | 0.3 | 44.6 | 15 | |
| 080721 | 0.4 | 53.2 | 10 | |
While a spectral characterization of a burst can be attempted only for events with known incoming direction, the hardness ratio evolution along the event is not dependent on the off-axis angle. From the background-subtracted count curves in the three selected energy bands 260-364 keV (soft), 364-780 keV (medium), and 780-2600 keV (hard), we computed the hardness ratios (medium to soft) and (hard to medium) along each burst. The hardness ratios were derived over the interval only for bins where counts are at least above the background. The spectral variability was estimated by a simple test:
| (2) |
where is the mean value over the bins verifying the condition above, is the error on the hardness ratio in the th time bin. When allowed by the signal-to-noise ratio, the hardness evolution for each burst is plotted in Figs. 9-48 together with the event light curves. Note that a different binning time is usually adopted for light curve and HR plots.
Table 5 reports the mean hardness ratio, the number of bins , the value of and the associated null hypothesis probability of no-variability. Only bursts with a -probability higher than % and at least 8 bins are given.
Despite the strong limitation owing to the low SNR in short time bins, we identified nine events with significant variability (%), among which six are known GRBs and three are bursts without a documented position. The spectral variability in both hard to medium and medium to soft bands does not show a common evolution, as observed in different energy regimes by other instruments (see e.g. Guidorzi et al. 2011).
4 Conclusions
We have investigated the capabilities of the IBIS/PICsIT instrument applied to the study of GRBs. We analyzed spectral timing light curves over about three years, provided by PICsIT with energy resolution of eight channels and time sampling of 16 ms. Under stringent selection criteria, optimized for the search of long events, we identified 39 bursts, most of which are documented GRBs or events detected by other telescopes. We showed that PICsIT successfully detects GRBs extending up to MeV at a rate of events/year above the instrumental threshold of ct/s in the 260-364 keV energy band. Bright events are observed even extremely off-axis, well beyond the nominal FoV. For all detected events we produced light curves with a time resolution down to 0.25 s. We used the spectral properties available in the literature of a subsample of GRBs to attempt a rough calibration between fluences in physical and instrumental units by separating the off-axis and energy dependence and computing an average calibration coefficient in three selected energy bands. For sufficiently intense events the fine time and energy sampling of ST data allowed us to trace spectral evolution. We showed that it is possible to exploit the PICsIT archive for GRB spectral and temporal characterization in the hard X-ray / soft -ray regime.
Acknowledgements.
This paper is based on observations of INTEGRAL, an ESA project with instrument and science data center funded by ESA member states (principal investigator countries: Denmark, France, Germany, Italy, Switzerland and Spain), the Czech Republic and Poland, and with participation of Russia and US. V. B. thanks E. Maiorano, M. Orlandini and L. Amati for useful suggestions and discussion. This work has been partially supported by ASI contract I/008/07/0.References
- Bellm et al. (2006) Bellm, E., Bandstra, M., Boggs, S., et al. 2006, GRB Coordinates Network, 5418, 1
- Bissaldi et al. (2008) Bissaldi, E., Briggs, M., von Kienlin, A., & McBreen, S. 2008, GRB Coordinates Network, 8108, 1
- Cummings (2007) Cummings, J. R. 2007, GRB Coordinates Network, 6858, 1
- Di Cocco et al. (2007) Di Cocco, G., Bianchin, V., Foschini, L., et al. 2007, in ESA Special Publication, Vol. 622, ESA Special Publication, 619–622
- Di Cocco et al. (2003) Di Cocco, G., Caroli, E., Celesti, E., et al. 2003, A&A, 411, L189
- Fenimore & Bloom (1995) Fenimore, E. E. & Bloom, J. S. 1995, ApJ, 453, 25
- Foley et al. (2008) Foley, S., McGlynn, S., Hanlon, L., McBreen, S., & McBreen, B. 2008, A&A, 484, 143
- Goldwurm et al. (2003) Goldwurm, A., David, P., Foschini, L., et al. 2003, A&A, 411, L223
- Golenetskii et al. (2006a) Golenetskii, S., Aptekar, R., Mazets, E., et al. 2006a, GRB Coordinates Network, 5498, 1
- Golenetskii et al. (2006b) Golenetskii, S., Aptekar, R., Mazets, E., et al. 2006b, GRB Coordinates Network, 5689, 1
- Golenetskii et al. (2006c) Golenetskii, S., Aptekar, R., Mazets, E., et al. 2006c, GRB Coordinates Network, 5841, 1
- Golenetskii et al. (2006d) Golenetskii, S., Aptekar, R., Mazets, E., et al. 2006d, GRB Coordinates Network, 5984, 1
- Golenetskii et al. (2007a) Golenetskii, S., Aptekar, R., Mazets, E., et al. 2007a, GRB Coordinates Network, 6849, 1
- Golenetskii et al. (2007b) Golenetskii, S., Aptekar, R., Mazets, E., et al. 2007b, GRB Coordinates Network, 6867, 1
- Golenetskii et al. (2008a) Golenetskii, S., Aptekar, R., Mazets, E., et al. 2008a, GRB Coordinates Network, 7219, 1
- Golenetskii et al. (2008b) Golenetskii, S., Aptekar, R., Mazets, E., et al. 2008b, GRB Coordinates Network, 7263, 1
- Golenetskii et al. (2008c) Golenetskii, S., Aptekar, R., Mazets, E., et al. 2008c, GRB Coordinates Network, 7482, 1
- Golenetskii et al. (2008d) Golenetskii, S., Aptekar, R., Mazets, E., et al. 2008d, GRB Coordinates Network, 7548, 1
- Golenetskii et al. (2008e) Golenetskii, S., Aptekar, R., Mazets, E., et al. 2008e, GRB Coordinates Network, 7751, 1
- Golenetskii et al. (2007c) Golenetskii, S., Aptekar, R., Mazets, E., et al. 2007c, GRB Coordinates Network, 6089, 1
- Golenetskii et al. (2008f) Golenetskii, S., Aptekar, R., Mazets, E., et al. 2008f, GRB Coordinates Network, 7256, 1
- Golenetskii et al. (2008g) Golenetskii, S., Aptekar, R., Mazets, E., et al. 2008g, GRB Coordinates Network, 7862, 1
- Golenetskii et al. (2008h) Golenetskii, S., Aptekar, R., Mazets, E., et al. 2008h, GRB Coordinates Network, 7884, 1
- Golenetskii et al. (2008i) Golenetskii, S., Aptekar, R., Mazets, E., et al. 2008i, GRB Coordinates Network, 7995, 1
- Golenetskii et al. (2008j) Golenetskii, S., Aptekar, R., Mazets, E., et al. 2008j, GRB Coordinates Network, 8015, 1
- Golenetskii et al. (2009a) Golenetskii, S., Aptekar, R., Mazets, E., et al. 2009a, GRB Coordinates Network, 9553, 1
- Golenetskii et al. (2009b) Golenetskii, S., Aptekar, R., Mazets, E., et al. 2009b, GRB Coordinates Network, 9595, 1
- Götz et al. (2008) Götz, D., Paizis, A., Mereghetti, S., et al. 2008, GRB Coordinates Network, 8002, 1
- Grupe et al. (2006) Grupe, D., Barbier, L. M., Brown, P. J., et al. 2006, GRB Coordinates Network, 5954, 1
- Guidorzi et al. (2011) Guidorzi, C., Lacapra, M., Frontera, F., et al. 2011, A&A, 526, A49
- Hajdas et al. (2003) Hajdas, W., Bühler, P., Eggel, C., et al. 2003, A&A, 411, L43
- Hurley et al. (2008) Hurley, K., Cline, T., Boynton, W., et al. 2008, GRB Coordinates Network, 7211, 1
- Hurley et al. (2006a) Hurley, K., Cline, T., Golenetskii, S., et al. 2006a, GRB Coordinates Network, 5684, 1
- Hurley et al. (2006b) Hurley, K., Cline, T., Mitrofanov, I., et al. 2006b, GRB Coordinates Network, 5407, 1
- Hurley et al. (2004) Hurley, K., Rau, A., von Kienlin, A., & Lichti, G. 2004, in ESA Special Publication, Vol. 552, 5th INTEGRAL Workshop on the INTEGRAL Universe, ed. V. Schoenfelder, G. Lichti, & C. Winkler, 645
- Kaneko et al. (2006) Kaneko, Y., Preece, R. D., Briggs, M. S., et al. 2006, ApJS, 166, 298
- Kommers et al. (2000) Kommers, J. M., Lewin, W. H. G., Kouveliotou, C., et al. 2000, ApJ, 533, 696
- Koshut et al. (1996) Koshut, T. M., Paciesas, W. S., Kouveliotou, C., et al. 1996, ApJ, 463, 570
- Lin et al. (2002) Lin, R. P., Dennis, B. R., Hurford, G. J., et al. 2002, Sol. Phys., 210, 3
- Malaguti et al. (2003) Malaguti, G., Bazzano, A., Beckmann, V., et al. 2003, A&A, 411, L307
- Mangano et al. (2008) Mangano, V., Cummings, J. R., Cusumano, G., et al. 2008, GRB Coordinates Network, 7847, 1
- Markwardt et al. (2008) Markwardt, C. B., Barthelmy, S. D., Baumgartner, W. H., et al. 2008, GRB Coordinates Network, 7873, 1
- Marshall et al. (2008) Marshall, F. E., Beardmore, A. P., Burrows, D. N., et al. 2008, GRB Coordinates Network, 7988, 1
- McGlynn et al. (2009) McGlynn, S., Foley, S., McBreen, B., et al. 2009, A&A, 499, 465
- Mereghetti et al. (2003) Mereghetti, S., Götz, D., Borkowski, J., Walter, R., & Pedersen, H. 2003, A&A, 411, L291
- Mereghetti et al. (2006a) Mereghetti, S., Paizis, A., Götz, D., et al. 2006a, GRB Coordinates Network, 5834, 1
- Mereghetti et al. (2006b) Mereghetti, S., Paizis, A., Götz, D., et al. 2006b, GRB Coordinates Network, 5491, 1
- Nakagawa et al. (2009) Nakagawa, Y. E., Tamagawa, T., Ohmori, N., et al. 2009, GRB Coordinates Network, 9577, 1
- Perri et al. (2008) Perri, M., Burrows, D. N., Campana, S., et al. 2008, GRB Coordinates Network, 7525, 1
- Racusin et al. (2008) Racusin, J. L., Gehrels, N., Holland, S. T., et al. 2008, GRB Coordinates Network, 7427, 1
- Rapisarda et al. (2008) Rapisarda, M., Costa, E., Del Monte, E., et al. 2008, GRB Coordinates Network, 7715, 1
- Rau (2009) Rau, A. 2009, GRB Coordinates Network, 9566, 1
- Rau et al. (2005) Rau, A., Kienlin, A. V., Hurley, K., & Lichti, G. G. 2005, A&A, 438, 1175
- Schady et al. (2009) Schady, P., Baumgartner, W. H., Beardmore, A. P., et al. 2009, GRB Coordinates Network, 9512, 1
- Schady et al. (2007) Schady, P., Evans, P. A., Gehrels, N., et al. 2007, GRB Coordinates Network, 6837, 1
- Segreto et al. (2003) Segreto, A., Labanti, C., Bazzano, A., et al. 2003, A&A, 411, L215
- Ubertini et al. (2003) Ubertini, P., Lebrun, F., Di Cocco, G., et al. 2003, A&A, 411, L131
- van der Horst (2009) van der Horst, A. J. 2009, GRB Coordinates Network, 9760, 1
- Vedrenne et al. (2003) Vedrenne, G., Roques, J., Schönfelder, V., et al. 2003, A&A, 411, L63
- Vianello et al. (2009) Vianello, G., Götz, D., & Mereghetti, S. 2009, A&A, 495, 1005
- Viganò & Mereghetti (2009) Viganò, D. & Mereghetti, S. 2009, ArXiv e-prints 0912.5329
- von Kienlin (2009a) von Kienlin, A. 2009a, GRB Coordinates Network, 9447, 1
- von Kienlin (2009b) von Kienlin, A. 2009b, GRB Coordinates Network, 9579, 1
- Winkler et al. (2003) Winkler, C., Courvoisier, T., Di Cocco, G., et al. 2003, A&A, 411, L1
9
10
11

12
13

14
15

16

17
18
19

20
21
22
23
24
25
26
27
28
29
30

31
32
33
34
35

36
37
38
39
40
41
42
43
44
45

46
47
48