On a new theoretical calibration of the Stömgren metallicity index: NGC 6522 as a first test case 11affiliation: Based on observations collected with the 1.54m Danish telescope (ESO, La Silla). Period 65
Abstract
We present a new theoretical calibration of the Strömgren metallicity index using -enhanced evolutionary models transformed into the observational plane by using atmosphere models with the same chemical mixture. We apply the new Metallicity–Index–Color (MIC) relations to a sample of 85 field red giants (RGs) and find that the difference between photometric estimates and spectroscopic measurements is on average smaller than 0.1 dex with a dispersion of = 0.19 dex. The outcome is the same if we apply the MIC relations to a sample of eight RGs in the bulge globular cluster NGC 6522, but the standard deviation ranges from 0.26 () to 0.49 (). The difference is mainly caused by a difference in photometric accuracy. The new MIC relations based on the Ca–y color provide metallicities systematically more metal-rich than the spectroscopic ones. We found that the -band is affected by abundance and possibly by chromospheric activity.
1 Introduction
The intermediate-band Strömgren photometric system (Strömgren 1966) has, for stars with spectral types from A to G, several indisputable advantages when compared with broad-band photometric systems.
i) the Strömgren index was specifically devised to estimate stellar metallicity of both evolved (horizontal branch [HB], red-giant branch [RGB]) and main sequence stars (Hilker & Richtler 2000; Anthony-Twarog & Twarog 2000; Calamida et al. 2007, hereafter CA07), while the index, defined as (Twarog & Anthony-Twarog 1991), replaces the with the filter centered on the and lines, and it is primarily sensitive to the star abundance. The plane has been adopted to estimate the metallicity of both RG (Anthony-Twarog, Twarog, & Craig 1995) and Lyrae stars (Baird 1996; Rey et al. 2000). The main advantage of Strömgren metallicity indices over stellar spectroscopy is that they provide simultaneous metallicity estimates for large samples of stars. However, the use of the Strömgren indices does require precise multiband photometry and absolute calibration.
ii) The filter is strongly affected by two molecular absorption bands ( and Å). Stars with an over-abundance of carbon () and/or nitrogen (), i.e. - and/or -strong stars, will have, at fixed color, larger , a fundamental property for identifying stars with different abundances in Globular Clusters (GCs, CA07, Calamida et al. 2009).
iii) The index is based on the lines that, at fixed metal abundance, are stronger than weak metallic lines falling across the filter. This means that the index in the metal-poor regime is more sensitive to metallicity changes than . For cool stars, saturation of the lines leads to a reversal of this trend in the metal-rich regime (Anthony-Twarog, Twarog, & Craig 1995).
iv) Lee et al. (2009b), using data for 37 GGCs, found that most of them show a discrete or broad RGB in the plane, and suggested a spread in and/or heavy element abundance in these GGCs.
2 Observations and calibration of the metallicity index.
Ca-uvby Strömgren images were collected during two observing nights (July 6-7, ) with the 1.54m Danish Telescope (ESO) and the DFOSC camera, with a pixel scale of 0.39″and a field of view of 13.7′13.7′. The pointing was centered on the Baade’s Window ( = 18:03:34, = -30:04:10), including NGC 6522. We secured 16 images (), with exposure times ranging from 60s () to 1000s (), and seeing between 12 and 16. Standard stars were selected from the catalog by Hauck & Mermilliod (1998) and observed across each night.
The photometry was performed with DAOPHOT IV/ALLFRAME (Stetson 1987, 1994) and aperture photometry on the standards with ROMAFOT (Buonanno & Iannicola 1989). Extinction coefficients were estimated from observations of standards at different air-mass values. Calibration curves from the two observing nights agreed quite well and we selected the best photometric night, July 6, as the reference night. The final calibrated catalog includes 80,000 stars with an accuracy of 0.1 and 0.2 mag at 20 mag. The accuracy of the calibration is 0.02 mag for the bands and 0.05 mag for the bands.
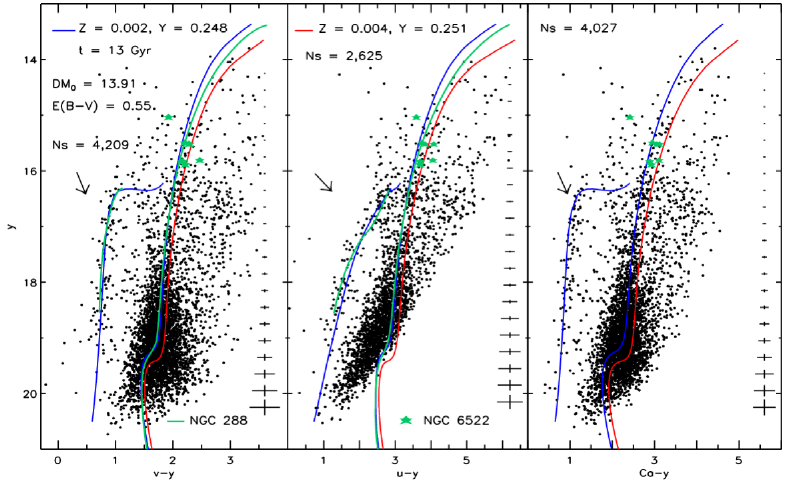
In this investigation we are focusing on NGC 6522, therefore the final catalog was restricted by photometric accuracy and star position. Only stars with distances from the cluster center ( = 18:03:34, = -30:02:02) in the range 0.65′– 1.65′ were plotted in the , v–y (left panel), , u–y (middle) and , Ca–y (right) Color-Magnitude Diagrams (CMDs) of Fig. 1. The cluster center was excluded due to crowding, but stars up to about 1.5 the half-light radius (′, Harris 2003) are selected. The entire photometric catalog will be presented in a forthcoming paper.
In order to validate current absolute calibration we compared cluster photometry with both theoretical predictions and Strömgren photometry of NGC 288 (CA07). We adopted this GC, because current spectroscopic measurements indicate an iron abundance ([Fe/H]= -1.320.02 dex) similar to NGC 6522 ([Fe/H]= -1.450.08 dex, Carretta et al. 2009).
We adopted a true distance modulus for NGC 6522 of and a mean reddening (Barbuy et al. 1998). The extinction coefficients for the Strömgren colors were estimated by applying the Cardelli et al. (1989) reddening relation and , according to the reddening dependence of on (Olson 1975, see also Barbuy et al. 1998) We found: , , and .
The blue and the red solid lines in Fig. 1 show two cluster isochrones at fixed age ( Gyr) and different chemical compositions, namely and , and the predicted Zero Age Horizontal Branch (ZAHB) for . Isochrones are from the BASTI data base and are based on -enhanced () evolutionary models (Pietrinferni et al. 2006, hereafter PI06), transformed into the observational plane using atmosphere models computed assuming -enhanced mixtures. Data plotted in Fig. 1 show that theory and observations, within the errors, agree quite well over the entire magnitude range.
In particular, the two isochrones bracket the RGs with known metal abundance, i.e. dex ( dex). The small discrepancy between the ZAHB and the HB might be due to the effect of differential reddening, which also produces part of the RGB spread. The reddening vector is shown for each CMD in Fig. 1.
The green solid lines show the ridge lines of NGC 288 along the RGB and the HB. To compare the two GCs we adopted a true distance modulus of (Ferraro et al. 1999) and a reddening of (CA07). Unfortunately, -band photometry for this cluster is not available.
The RGB ridge line of NGC 288 is systematically bluer than RGs in NGC 6522, thus suggesting that the latter GC is slightly more metal-rich than the former one. This result agrees quite well with recent iron abundances for eight RGs (green stars) provided by Barbuy et al. (2009, hereafter BA09). The measurements are based on high-resolution spectra collected with FLAMES/GIRAFFE at the VLT (ESO) and give [Fe/H]= -1.00.2 dex on the Carretta & Gratton (1997) metallicity scale.
The consistency between theoretical and empirical scenario is further supported by the evidence that the NGC 288 ridge lines agree quite well with more metal-poor () evolutionary predictions.
Independent Metallicity–Index–Color (MIC) relations are derived using cluster isochrones based on -enhanced evolutionary models (PI06). Theoretical predictions were transformed into the observational plane by adopting bolometric corrections (BCs) and Color–Temperature Relations (CTRs) based on atmosphere models computed assuming the same heavy element abundances (PI06, Castelli & Kurucz 2006). The Vega flux adopted is from Castelli & Kurucz (1994)111The complete set of BCs, CTRs and the Vega flux are available at http://wwwuser.oat.ts.astro.it/castelli. The metallicities adopted for the calibration are: Z=0.0001, 0.0003, 0.0006, 0.001, 0.002, 0.004, and 0.01. We neglected more metal-rich structures because the index loses sensitivity in the metal-rich regime (Anthony-Twarog & Twarog 1998, hereafter ATT98, and references therein). The adopted Z values indicate the global abundance of heavy elements in the chemical mixture, with a solar metal abundance of .
To unredden the index we adopted = -0.155 (Anthony-Twarog et al. 1991, hereafter AT91). Together with the unreddened index, , we also derive independent MIC relations for the reddening-free parameter , to overcome deceptive uncertainties caused by differential reddening.
Fig. 2 shows the seven isochrones plotted in the plane, covering the evolutionary phases from the base of the RGB to the tip. Note the nonlinearity of the relations for RGs and the decrease in sensitivity of the index when moving from the metal-poor to the metal-rich regime ( -0.5 dex), as originally suggested by ATT98.
To select the and values along the individual isochrones we follow the same approach adopted for the calibration of the index (CA07). A multilinear regression fit was performed to estimate the coefficients of the MIC relations for the and the indices as a function of four Color Indices (CIs): :
where the symbols have their usual meaning. The adoption of eleven terms, compared to the four of the calibration, is due to the nonlinearity of the vs relations for RGs. The coefficients of the fits, together with their uncertainties, for the eight MIC relations, are listed in Table 1.

3 Validation of the new calibration of the index
In order to validate the new calibration of the index we estimate the metallicity of field RGs for which Anthony-Twarog & Twarog (1994, hereafter ATT94) and ATT98 collected both Ca-uvby photometry and high-resolution spectra. We end up with a sample of 96 RGs. For 28 of them we retrieve from the VO database the and abundances of Fulbright (2000, hereafter FU00), from which a proxy of the -enhancement is estimated either as or as . The metallicity range covered by our MIC relations is dex, but we select stars with dex to account for uncertainties in spectroscopic abundances and in the metallicity scale (Kraft & Ivans 2003). We end up with 85 RGs of which 24 have , abundance measurements.
We plot the difference between photometric and spectroscopic metallicities for the 85 field RGs as a function of their spectroscopic metal abundances in Fig. 3. Photometric abundances are estimated via the (panels a,c) and the relations (b,d). The global metallicity [M/H] is estimated adopting the Salaris et al. (1993) formula and either the (panels a,b) or the measurement (c,d) for the 24 RGs in common with FU00 (red dots), or a constant -enhancement for the remaining stars of =0.4 dex (RGs with -0.8 dex) and =0.15 dex (RGs with -0.8 dex, black). Data plotted in Fig. 3 show that the difference between spectroscopic measurements and photometric estimates is, on average, of the order of 0.1 dex when using the relation ( -0.070.02 dex, ; -0.090.02 dex, ), or the relation ( -0.090.02 dex; -0.110.02 dex). To overcome subtle uncertainties in the estimate of the mean difference we adopt the Biweight algorithm (Fabrizio et al. 2011). The intrinsic dispersion of the different MIC relations is smaller than 0.2 dex and caused either by photometric errors, or by reddening uncertainties, or by spectroscopic errors. The error bars in the bottom panel of Fig. 3 display the mean error for the spectroscopic measurements ( 0.15 dex), estimated as the average of both the internal dispersion about the mean of [Fe/H] measurements, the uncertainty due to the transformations into the standard metallicity scale (see column 8 in Table 2 and column 7 in Table 4 of ATT98), and the internal uncertainties of the and measurements by FU00. The -strong stars (HD 55496, HD 135148, BD-01 2582, BD+04 2466, CD-62 1346, diamonds) do not show, in contrast with the metallicity based on the MIC relations (see CA07), any peculiar discrepancy between photometric and spectroscopic metallicities. On the other hand, star HD 84903 (asterisk), which might be affected by weak chromospheric emission in the core of the line (ATT98), showed a large discrepancy ( -0.4 dex) when using the MIC relations. We now adopt for HD 84903 [Fe/H]= -2.6 dex, estimated accounting non-LTE effects by Thévenin et al. (1999). The difference between photometric and spectroscopic abundances is now inside current uncertainties ( -0.2 dex). The star HD 44007 (cross) was already discussed in ATT98, since the reddening correction is still uncertain. Photometric metallicities for two metal-rich stars (HD 35179, HD 7595) with -0.60 dex, are systematically more metal-poor by 0.5 dex than spectroscopic measurements. Such a discrepancy might be due either to reddening uncertainties, or to the reduced sensitivity of the index in the metal-rich regime.

We were not able to validate current calibrations with the spectroscopic abundances of RGs in Baade’s Window field (Zoccali et al. 2008), since almost all of them are more metal-rich than [Fe/H]= -0.5 dex, therefore outside the metallicity range covered by the new MIC relations.
To further validate current calibrations, we apply the MIC relations to estimate the metallicity distribution of RGs in NGC 6522. The catalog is selected in star position as described in §1, in magnitude ( 18.0 mag), in photometric accuracy ( 0.03 and 0.02 mag), and in surface gravity ( 0.35 mag), ending up with 51 RGs. We downloaded the catalog of proper motions across the Galactic bar by Sumi et al. (2003) from the VO database, for a region of 15′15′ across the cluster center. The match with our catalog gives stars in common. The accuracy of the proper motions is 1 mas/yr, while the accuracy of the positional match is 1″. We further select our sample with and mas/yr, following the classification made by Sumi et al. of RG, red-clump and disc stars (see their Fig. 8). Since the proper motions of field stars partly overlap with those of cluster stars, we cannot exclude contamination in the final sample of 28 candidate cluster RGs.
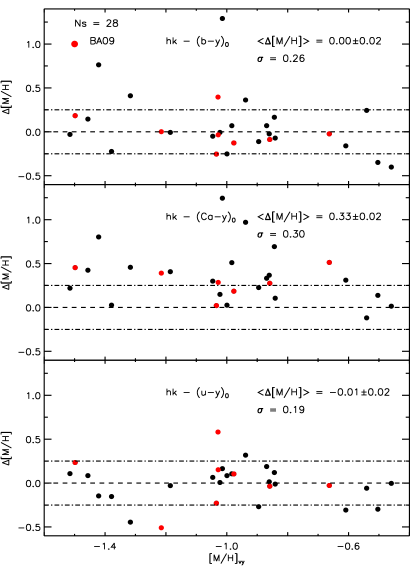
Fig. 4 shows the difference between photometric metallicities of the 28 candidate RGs estimated adopting the MIC relation and the relations based on and the colors plotted versus metallicities estimated with .
By using the eight RGs (red dots) in common with the spectroscopic sample (BA09), we find that the difference (Biweigth mean) between photometric and spectroscopic metallicity222The -element abundance of the spectroscopic RGs is estimated as , while their [Fe/H] is transformed in the Zinn & West (1984) scale using the Carretta & Gratton (1997) relation. is minimal not only for the (, =0.26 dex), but also for the (, =0.38 dex) and the (, =0.49 dex) MIC relation. The difference becomes larger when using the (, =0.45 dex) relation. The difference is marginally larger when using the MIC relations based on the reddening free index. In particular, it is , =0.67 for the and , =0.43 for the relations. The difference between unreddened and reddening free MIC relations is mainly due to the sum in quadrature of the intrinsic photometric error. The evidence that the MIC relations using the -band both in the metallicity index and in the color index show either the largest difference or the largest dispersion suggest that the discrepancy might be intrinsic. Data plotted in Fig. 4 further support this finding. Indeed, metallicity estimates based on the and on the relations agree reasonably well with those based on the relation ( and with = 0.26 and 0.19 dex, respectively.) On the other hand, the metallicity estimates based on the relation are on average 0.3 dex more metal-rich than those based on the relation. The difference might be due to the fact that the relation is more sensitive to the abundance than the other relations. Moreover, Anthony-Twarog, Twarog, & Craig (1995) suggested that the index of RGs in M22 might be affected by a continuous absorption in the wavelength range between and Å (see also Bond & Neff 1969). We plan to provide a more quantitative analysis of this effect in a forthcoming paper. Another possible culprit might be the chromospheric activity, since this phenomenon causes an emission in the core of the line (Smith, Dupree, & Churchill 1992; Dupree et al. 1999; Lee et al. 2009a). Unfortunately, the high-resolution spectra collected by BA09 do not cover the wavelength region of lines.
The photometric metallicity distributions show a well-defined main peak around dex and two shoulders at -1.4 and -0.5 dex. These features agree quite well with the spectroscopic metallicity distribution, which shows two peaks at and dex, with the latter one including 10% of the stars. The difference between the main and the secondary peak might be due to an enhancement either in or in other heavy elements. We cannot reach a firm conclusion concerning the few more metal-poor ( -1.4 dex) outliers, since the standard deviations of the MIC relations range from 0.25 to 0.5 dex. They might be either field bulge stars or objects affected by differential reddening.
Lee et al. (2009a, b) found a double peaked distribution when applying their metallicity relation to stars in NGC 1851. This is a peculiar GGC, with a split along the sub-giant and the RG branches, that might be due to the presence of two stellar populations with different abundance (CA07; Cassisi et al. 2008). The secondary peak in the metallicity distribution includes 18% of the RGs (Lee et al. 2009a), including three -enhanced stars (Yong & Grundahl 2008) and three -strong stars (Hesser et al. 1982) with enhanced abundances of and .
The above results indicate that possible differences in cluster RG colors including the -band should be cautiously treated, since they might be caused either by changes in and/or by other heavy elements or by molecular bands.
We show that the Strömgren index is a good diagnostic to estimate the global metal abundance of field and cluster RGs, and it can be also adopted to detect stars affected by enhancement. Moreover, the index is more sensitive than the index in the metal-poor regime, and is less affected by peculiarities. The current MIC relations have been validated by adopting RGs in NGC 6522 and field RGs with known spectroscopic abundances, and provide metallicities with an accuracy better than 0.2 dex. The application of the new MIC relations appear very promising not only for RGs in halo GGCs, but also to pin point metal-poor stars in the Galactic halo.
References
- Anthony-Twarog et al. (1991) Anthony-Twarog, B. J., Laird, J. B., Payne, D., & Twarog, B. A. 1991, AJ, 101, 1902 (AT91)
- Anthony-Twarog & Twarog (1994) Anthony-Twarog, B. J., & Twarog, B. A. 1994, AJ, 107, 1577 (ATT94)
- Anthony-Twarog, Twarog, & Craig (1995) Anthony-Twarog, B.J., Twarog, B.A., & Craig, J. 1995, PASP, 107, 32
- Anthony-Twarog & Twarog (1998) Anthony-Twarog, B. J., & Twarog, B. A. 1998, AJ, 116, 1922 (ATT98)
- Anthony-Twarog & Twarog (2000) Anthony-Twarog, B. J., & Twarog, B. A. 2000, AJ, 120, 3111
- Baird (1996) Baird, S., 1996, AJ, 112, 5
- Barbuy et al. (1998) Barbuy,B., Bica, E., Ortolani, S. 1998, A&A, 333, 117
- Barbuy et al. (2009) Barbuy,B., et al. 2009, A&A, 507, 405 (BA09)
- Bond & Neff (1969) Bond, H. E., Neff, J. S. 1969, ApJ, 158, 1235
- Buonanno & Iannicola (1989) Buonanno, R., Iannicola, G. 1989, PASP, 101, 294
- Calamida et al. (2007) Calamida, A., et al. 2007, ApJ, 670, 400 (CA07)
- Calamida et al. (2009) Calamida, A., et al. 2009, ApJ, 706, 1277
- Cardelli et al. (1989) Cardelli, J. A., Clayton, G. C., & Mathis, J. S. 1989, ApJ, 345, 245
- Carretta et al. (2009) Carretta, E., Bragaglia, A., Gratton, R., D’Orazi, V., Lucatello, S. 2009, A&A, 508, 695
- Dupree et al. (1999) Dupree, A. K., Whitney, B. A., Pasquini, L. 1999, ApJ, 520, 751
- Carretta & Gratton (1997) Carretta, E., Gratton, R. 1997, A&A, 121, 95
- Cassisi et al. (2008) Cassisi, S., Salaris, M., Pietrinferni, A., Piotto, G., Milone, A. P., Bedin, L. R., Anderson, J. 2008, ApJ, 672, L115
- Castelli & Kurucz (1994) Castelli, F., & Kurucz, R. L. 1994, A&A, 281, 817
- Castelli & Kurucz (2006) Castelli, F., & Kurucz, R. L. 2006, A&A, 454, 333
- Fabrizio et al. (2011) Fabrizio, M., et al. 2011, PASP, 123, 384
- Ferraro et al. (1999) Ferraro, F. R., Messineo, M., Fusi Pecci, F., de Palo, M. A., Straniero, O., Chieffi, A., Limongi, M. 1999, AJ, 118, 1738
- Fulbright (2000) Fulbright, J.P. 2000, AJ, 120, 1841 (FU00)
- Harris (2003) Harris, W.E. 2003, Catalog of Parameters for Milky Way Globular Clusters: The Database Hamilton: McMaster Univ., http://physun.physics.mcmaster.ca/ harris/mwgc.dat
- Hauck & Mermilliod (1998) Hauck, B., & Mermilliod, M. 1998, A&AS, 129, 431
- Hesser et al. (1982) Hesser, J. Bell, R. A., Harris, G. L. H., Cannon, R. D. 1982, AJ, 87, 1470
- Hilker & Richtler (2000) Hilker, M., & Richtler, T. 2000, A&A, 362, 895
- Kraft & Ivans (2003) Kraft, R.P., Ivans, I. I. 2003, PASP, 115, 143
- Lee et al. (2009a) Lee, J.-W., et al. 2009, ApJ, 695, L78
- Lee et al. (2009b) Lee, J.-W., Kang, Y.-W., Lee, J., Lee, Y.-W. 2009, Natur., 462, 480
- Olson (1975) Olson, B.I. 1975, PASP, 87, 349
- Pietrinferni et al. (2006) Pietrinferni, A., Cassisi, S., Salaris, M., Castelli, F. 2006, ApJ, 642, 697 (PI06)
- Rey et al. (2000) Rey, S.-C., Lee, Y.-W., Joo, J.-M., Walker, A., Baird, S. 2000, AJ, 119, 1824
- Salaris et al. (1993) Salaris, M., Chieffi, A., & Straniero, O. 1993, ApJ, 414, 580
- Smith, Dupree, & Churchill (1992) Smith, G.H., Dupree, A. K., & Churchill, C. W. 1992, AJ, 104, 2005
- Stetson (1987) Stetson, P. B. 1987, PASP, 99, 191
- Stetson (1994) Stetson, P. B. 1994, PASP, 106, 250
- Strömgren (1966) Strömgren, B. 1966, Ann.Rev. A&A, 4, 433
- Sumi et al. (2003) Sumi, T., Eyer, L., Wozaniak, P. R. 2003, MNRAS, 340, 1346
- Thévenin et al. (1999) Thevénin, F., Idiart, T. P. 1999, ApJ, 521, 753
- Twarog & Anthony-Twarog (1991) Twarog, B.A., Anthony-Twarog, B.J. 1991, AJ, 101, 237
- Yong & Grundahl (2008) Yong, D., Grundahl, F. 2008, ApJ, 672, L29
- Zoccali et al. (2008) Zoccali, M., et al. 2008, A&A, 486, 177
| Relation | |||||||||||
|---|---|---|---|---|---|---|---|---|---|---|---|
| (1) | (2) | (3) | (4) | (5) | (6) | (7) | (8) | (9) | (10) | (11) | (12) |
| 0.125 | 0.116 | 0.756 | 0.860 | -0.556 | 0.684 | -0.282 | -1.057 | 0.495 | -0.019 | -0.081 | |
| Error | 0.010 | 0.009 | 0.172 | 0.297 | 0.142 | 0.047 | 0.144 | 0.045 | 0.032 | 0.027 | 0.012 |
| -0.009 | 0.096 | 0.615 | -0.072 | -0.107 | 0.735 | 0.040 | -0.299 | 0.041 | 0.047 | -0.133 | |
| Error | 0.010 | 0.007 | 0.056 | 0.091 | 0.026 | 0.056 | 0.021 | 0.014 | 0.004 | 0.013 | 0.015 |
| -0.028 | 0.051 | 0.425 | -0.094 | -0.034 | 0.720 | 0.018 | -0.176 | 0.016 | 0.050 | -0.131 | |
| Error | 0.010 | 0.010 | 0.035 | 0.140 | 0.032 | 0.155 | 0.010 | 0.018 | 0.002 | 0.017 | 0.029 |
| 0.131 | 0.097 | 0.183 | 0.125 | -0.018 | 0.616 | -0.011 | -0.171 | 0.017 | 0.012 | -0.099 | |
| Error | 0.010 | 0.008 | 0.031 | 0.054 | 0.008 | 0.062 | 0.007 | 0.008 | 0.001 | 0.008 | 0.016 |
| 0.162 | 0.105 | 0.657 | 1.030 | -0.375 | 0.547 | -0.493 | -0.864 | 0.433 | 0.011 | -0.070 | |
| Error | 0.010 | 0.009 | 0.181 | 0.191 | 0.152 | 0.039 | 0.133 | 0.035 | 0.029 | 0.027 | 0.011 |
| 0.022 | 0.086 | 0.597 | -0.057 | -0.060 | 0.644 | 0.005 | -0.247 | 0.039 | 0.064 | -0.132 | |
| Error | 0.010 | 0.006 | 0.058 | 0.091 | 0.031 | 0.051 | 0.019 | 0.012 | 0.004 | 0.013 | 0.014 |
| -0.021 | 0.049 | 0.462 | -0.147 | -0.030 | 0.703 | 0.023 | -0.157 | 0.013 | 0.053 | -0.126 | |
| Error | 0.010 | 0.010 | 0.038 | 0.172 | 0.043 | 0.174 | 0.011 | 0.017 | 0.002 | 0.019 | 0.031 |
| 0.127 | 0.083 | 0.206 | 0.090 | -0.009 | 0.580 | -0.013 | -0.149 | 0.015 | 0.025 | -0.106 | |
| Error | 0.010 | 0.008 | 0.029 | 0.056 | 0.009 | 0.059 | 0.005 | 0.007 | 0.001 | 0.009 | 0.017 |