TRIGONOMETRIC PARALLAXES OF MASSIVE STAR-FORMING REGIONS. IX. THE OUTER ARM IN THE FIRST QUADRANT
Abstract
We report a trigonometric parallax measurement with the Very Long Baseline Array for the water maser in the distant high-mass star-forming region G75.30+1.32. This source has a heliocentric distance of kpc, which places it in the Outer arm in the first Galactic quadrant. It lies 200 pc above the Galactic plane and is associated with a substantial H i enhancement at the border of a large molecular cloud. At a Galactocentric radius of 10.7 kpc, G75.30+1.32 is in a region of the Galaxy where the disk is significantly warped toward the North Galactic Pole. While the star-forming region has an instantaneous Galactic orbit that is nearly circular, it displays a significant motion of 18 km s-1 toward the Galactic plane. The present results, when combined with two previous maser studies in the Outer arm, yield a pitch angle of about for a large section of the arm extending from the first quadrant to the third.
1 Introduction
The section of the Galaxy beyond the solar circle in the first quadrant is arguably the most difficult in which to study Galactic structure. Heliocentric distances are large (e.g., Mead & Kutner 1988; Digel et al. 1990), Population i objects scarce, the rotation curve poorly constrained, and the disk warped and flared. Still, two well-defined spiral arms are easily recognized in large-scale 21 cm and CO surveys of the region (e.g., Dame et al. 2001; see also our Figure 4 below). The nearer one, the Perseus arm, straddles the solar circle in the first quadrant, apparently crossing it near a longitude of ; the other is 2–3 kpc farther from the Galactic center and is generally called the Outer arm (although other names such as ”Cygnus-Outer”, ”Norma-Cygnus”, and ”Perseus+I” have been applied; Vallée 2008). We note in passing that an even more distant arm was recently identified in both 21 cm and CO emissions in the first quadrant (Dame & Thaddeus, 2011); at about 15 kpc from the Galactic center this may be the distant end of the Scutum-Centaurus arm.
In general, the Outer arm contains much less molecular gas than arms at smaller Galactic radii (e.g., Perseus). Even so, some star-forming regions are detected in the arm at distances of kpc toward the anticenter direction, and this section of the arm has been located by trigonometric parallaxes (Honma et al., 2007; Hachisuka et al., 2009), through kinematic distance estimates (e.g., Russeil et al. 2007), and via photometric observations of open clusters (e.g., Pandey et al. 2006). An accurate knowledge of the gas distribution and large-scale motions in the outer regions of the Galaxy may provide strong constraints on the rotation curve of the Milky Way. In this respect, trigonometric parallax measurements of high-mass star-forming regions (HMSFRs) yield both an accurate distance to the source (within 10% accuracy) and its full-space proper motion around the Galaxy (within a few km s-1). So far, these observations have provided evidence for a nearly flat rotation curve up to about 13 kpc from the Galactic center in both the third (Honma et al., 2007) and second Galactic quadrants (Hachisuka et al., 2009; Reid et al., 2009b).
In this paper, we further constrain the outer-Galaxy rotation curve and the structure of the Outer arm in the first quadrant using masers associated with the HMSFR G75.30+1.32 (catalog ) (IRAS 201444+3726). The longitude and large negative local standard of rest (LSR) velocity of this region, km s-1, place it within the locus of the Outer arm as traced by the gas. We conducted multi-epoch, astrometric, Very Long Baseline Array (VLBA) observations of its 22 GHz water masers ( Jy; Brand et al. 1994) in order to measure the trigonometric parallax and 3-dimensional velocity vectors of this star-forming region.
2 Observations and Data Analysis
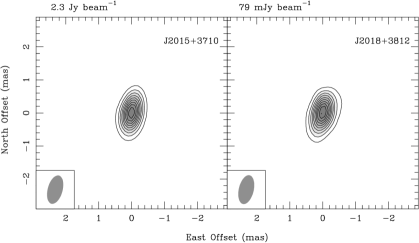
We conducted VLBA111The VLBA is operated by the National Radio Astronomy Observatory (NRAO). The NRAO is a facility of the National Science Foundation operated under cooperative agreement by Associated Universities, Inc. observations to study the H2O maser emission (rest frequency 22.235079 GHz) toward the HMSFR G75.30+1.32 (catalog ). In order to measure the trigonometric (annual) parallax and Galactic proper motion of this source, we used phase-referencing observations by fast switching between the maser target and two extragalactic continuum sources, J2015+3710 and J2018+3812. The former one was found in the VCS2 survey and has an absolute position known to better than mas (Fomalont et al., 2003), whereas the latter belongs to the VERA 22 GHz Fringe Search Survey (Petrov et al. 2007; see Figure 2). Two strong fringe-finders (3C345 and 3C454.3) were observed for bandpass, single-band delay, and instrumental phase-offset calibration. We also employed four blocks of geodetic-like observations, in order to remove total atmospheric delays for each antenna (Reid et al., 2009a). Detailed source information is summarized in Table 1.
At first, we carried out a preparatory survey with the VLA in BnA-configuration under program BM272 on 2007 October 5, in order to determine the maser position with sub-arcsecond accuracy. The VLBA observations were scheduled under program BM272H at four epochs: 2008 November 10, 2009 May 6, 13, and November 13. These dates were optimized to sample the yearly peaks of the right-ascension parallax sinusoid and at the same time remove all correlation among the parallax and proper motion parameters (e.g., Sato et al. 2010). We employed four adjacent intermediate frequency (IF) bands, each 8 MHz wide, in dual circular polarization; each band was correlated to produce 256 spectral channels. The bandwidth was wide enough to detect even weak continuum sources (a few mJy beam-1) and the channel width of 0.42 km s-1 was narrow enough to resolve well the masers line’s spectral components. The third IF band was centered on an LSR velocity (VLSR) of –56.0 km s-1, covering the range of previously detected water maser emission (Brand et al., 1994), whereas the remaining three IFs were spaced by 108 km s-1 each one from the other. The data were processed with the VLBA correlation facility in Socorro (New Mexico) using an averaging time of about 0.9 s, which limited the instantaneous field of view of the interferometer to about (i.e. without significant amplitude losses). Data were reduced with the NRAO Astronomical Image Processing System (AIPS) following the procedure described in Reid et al. (2009a). A total-power spectrum of the 22.2 GHz masers toward G75.30+1.32 is shown in Figure 1.
3 Results
3.1 Maser emission
We mapped a range of LSR velocities within km s-1 about the mean velocity of the emission ( km s-1) and a field of view of about the peak position of the reference feature No. 2 (see Table 2). Since G75.30+1.32 has not been well studied in the past, we imaged a large field-of-view and checked for differences between the total-power spectrum (Figure 1) and the flux density from the detected maser features (Table 2). With the interferometer, we recovered more than of the emission detected with single-dish measurements. In addition to the emission reported in Table 2, we found a strong, maser line at about km s-1 in the spectra of the second and third epochs. This emission came from about northward of the reference feature and probably represents another forming star in the region. However, analysis of this source is beyond the scope of this paper.
We identified 38 distinct water maser features, distributed within an area of about . We use the term feature to refer to multiple “spots” spatially overlapping in contiguous velocity channels and identify features with individual masing cloudlets (e.g., Sanna et al. 2010). We used the AIPS task JMFIT to fit an elliptical Gaussian brightness distribution to the brightness structure of each maser emission center at each epoch. The measured properties of individual features are presented in Table 2. Their intensities range from about 10 to 0.1 Jy beam-1 and span LSR velocities from km s-1 for the most redshifted feature (No. 17) to km s-1 for the most blueshifted one (No. 18). One-third of the maser features persisted over the 1 year time-baseline of our observations. For features lasting at least 6 months, we modeled their relative position shifts with time by a linear fit to get the internal proper motions of the maser distribution. At a distance of 9.25 kpc, the magnitude of the relative motions with respect to feature No. 2 ranges from 4 km s-1 for feature No. 6 to 84 km s-1 for feature No. 34, with an average accuracy of about 2 km s-1.
3.2 Distance and Galactic proper motion
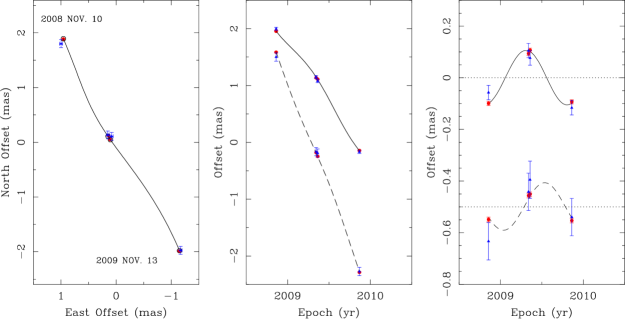
We measured the parallax and proper motion of the masers relative to the two QSOs by differencing their positions over time (see Reid et al. 2009a for a detailed discussion). For the purposes of a maser reference position, we used the spot at km s-1 associated with feature No. 5 (in Table 2, it is reported the peak LSR velocity for each feature). This spot was isolated, nearly point-like, and fairly strong at all epochs (). Table 3 and Figure 3 show the results of the parallax and proper motion fitting for both background sources.
Since systematic errors usually dominate over random noise, we estimated “a posteriori” the quality of the measurements from the fit residuals (see Reid et al. 2009a). While both calibrators had a small angular distance from the maser source (see Table 1), J2018+3812 had a deconvolved size (e.g., at , from the first epoch data) more than two times that of J2015+3710. That affected the parallax signature in the north direction for the fainter calibrator J2018+3812. Thus, to optimally combine the measurements of the two background sources, we determined their relative weights as follow. First, we fitted data for each background source separately to give preliminary estimates of parallax and proper motion. Since we expect no detectable proper motion for the extragalactic sources, we re-fitted the data from the two sources independently, holding the proper motions fixed at the average values from the first fit. This procedure was iterated, adjusting the individual error floors to yield values of chi-squared per degree of freedom near unity. The error-floors determined in this manner were mas in both the E–W and N–S directions for J2015+3710 and mas in the E–W direction and mas in the N–S direction for J2018+3812. These individual error floors were used in a final “combined” parallax reported in Table 3. Note that, since the targets of these observations were high-declination sources, we avoided low-elevation data. That explains the accurate N–S offset measurements for the point-like calibrator J2015+3710, compared to low-declination sources (e.g., Reid et al. 2009a). The parallax of G75.30+1.32 from the combined fit is mas, corresponding to a distance of kpc from the Sun. For the IAU value of the distance to the Galactic center, R kpc, our measured distance translates to a Galactocentric radius of 10.8 kpc.
To determine a secular proper motion for the HMSFR (as opposed to a single maser spot), we need to correct the combined fit values in Table 3 for the proper motion of the reference spot with respect to the forming star. We estimated this contribution from the average proper motion of all the maser features with respect to the reference spot of the parallax. The average internal velocity components are mas yr-1 toward the east and mas yr-1 toward the north, where we report the standard error of the mean. Thus, the total motion of the whole source is estimated to be mas yr-1 and mas yr-1 in the east and north directions, respectively. At our measured distance these values correspond to km s-1 and km s-1 eastward and northward, respectively. Completing the kinematic information, we have assumed an LSR velocity of km s-1 for the HMSFR G75.30+1.32, obtained from the CS(21) line survey by Bronfman et al. (1996), in agreement with the median velocity of the maser features ( km s-1).
We can transform the 3-dimensional velocity from the equatorial heliocentric reference frame, in which they were measured, to a reference frame rotating with the Galaxy, to estimate the peculiar motion of the HMSFR (i.e. the deviation from a circular rotation). Adopting a flat rotation curve for the Milky Way with km s-1 (Brunthaler et al., 2011), a current “best-estimate” for the distance to the Galactic center of R kpc (Reid et al., 2009b; Brunthaler et al., 2011), and the revised Hipparcos measurements of the solar motion (Schönrich et al., 2010), we find peculiar velocity components for G75.30+1.32 of km s-1, where Us, Vs and Ws are directed toward the Galactic center, in the direction of Galactic rotation and toward the North Galactic Pole, respectively. In Table 4, we summarize these results together with the peculiar proper motions of sources previously measured along the Outer arm.
4 Discussion
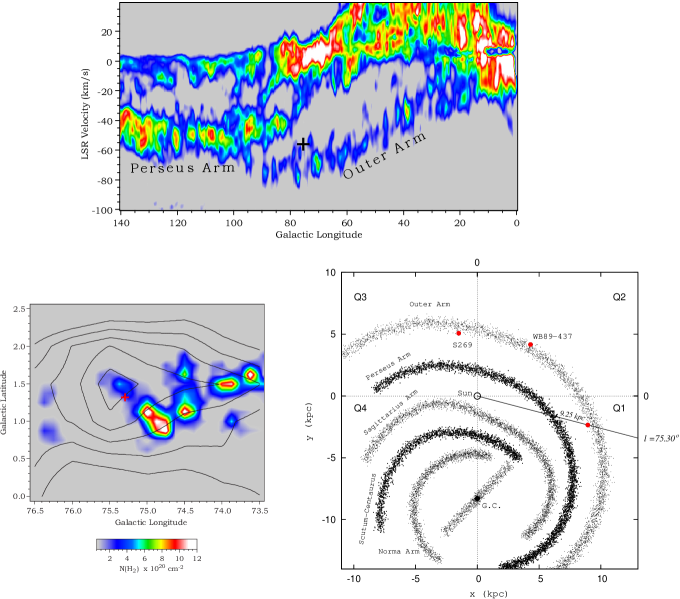
The source G75.30+1.32 is located in the first Galactic quadrant at a Galactocentric radius of about 11 kpc, far beyond the Galactocentric radius of the Perseus arm in this direction ( kpc; lower right panel in Figure 4). The Outer arm between Galactic longitudes of at zero latitude can be clearly traced in 21 cm H i emission with km s-1 (upper panel of Figure 4). The longitude-velocity diagram in Figure 4 shows that G75.30+1.32 (marked by a cross) is definitely within the locus of the Outer Arm, although it lies about 10 km s-1 higher in velocity than the central velocity of the arm at that longitude ( km s-1). We note that, with a Galactic latitude of and a distance of 9.25 kpc, G75.30+1.32 is located pc above the Galactic plane. An analysis of both the CO survey from Dame et al. (2001) and the H i survey from Kalberla et al. (2005) toward the Galactic latitude of G75.30+1.32 shows that the star-forming region sits on the side of a fairly bright CO cloud and lies close to a substantial H i enhancement (lower left panel in Figure 4). A further comparison of the Galactic coordinates and distance of G75.30+1.32 with a vertical cross-section of the Galactic plane points out the coincidence with a prominent warp of the Milky Way, particularly pronounced in the neutral hydrogen gas (e.g., Nakanishi & Sofue 2003).
The Galactic warp is a displacement of the outer disk from the midplane, generally upward (toward the North Galactic Pole) between the first and second quadrants and downward at diametrically opposite directions in the third and fourth. This midplane displacement can be also detected in faint CO line emission and peaks close to the Galactic location of G75.30+1.32, at a Galactocentric azimuth , toward the North Galactic pole (e.g., Nakanishi & Sofue 2006, their Figure 8). The Galactocentric azimuth is defined as the azimuth angle around the rotation axis of the Galaxy, taken so that points to the Sun and is parallel to . The difference of at and may be related to the dynamics of the warp together with the peculiar motion of G75.30+1.32 perpendicular to the plane ( km s-1) and directed toward the Galactic plane. We note that this last value differs by about six times the mean value for HMSFRs located within the Perseus arm ( km s-1; Reid et al. 2009b).
Two ideas have been forwarded to explain the Galactic warp (see Sellwood 2010 and reference therein): 1) as a consequence of the ongoing accretion of matter by the Galactic halo at much larger radii than the edge of the disk and 2) as a result of tidal interactions due to the proximity of the Magellanic Clouds () and the Sagittarius dwarf galaxy (e.g., Figure 1 in Bailin 2003). In the accretion scenario, gravitational torques between the inner halo and the outer disk produce a misalignment of the outer parts of the Galaxy with respect to the plane of the inner disk. This happens because of a redistribution of angular momentum through the system as long as freshly accreted matter streams from the outer to the inner parts of the Galaxy (e.g., Binney 1992; Jiang & Binney 1999). In this framework, the present result () may be interpreted as an inward motion through the Galactic warp toward the inner Galactic disk.
Using R kpc, km s-1, and a flat rotation curve beyond the solar circle, the revised kinematic distance (Reid et al., 2009b) at the Galactic coordinates of the source with an km s-1 is 9.9 kpc, with no kinematic distance ambiguity as the source is in the outer Galaxy. The small discrepancy () between the kinematic distance of G75.30+1.32 and its trigonometric distance of 9.25 kpc can be accounted for by the small peculiar motion of G75.30+1.32 ( km s-1) toward to the Sun direction (Table 4). On the one hand, this small difference hints at the validity of a nearly flat rotation curve up to the outer regions of the first Galactic quadrant (; e.g., Brand & Blitz 1993; Reid et al. 2009b). On the other hand, the small values of the peculiar motion of G75.30+1.32 along the Galactic plane (Table 4) may be interpreted in the framework of a density-wave-induced spiral perturbation of the gravitational potential in a rotating galaxy (Lin et al., 1969). These perturbations give rise to systematic, residual velocities within the spiral arms of the order of 10 km s-1 (Lin et al., 1969): inside the corotation radius, at the inner edge of an arm these streaming motions are directed toward the galactic center and counter to galactic rotation; at the outer edge, residual velocities toward the galactic center decrease to zero and point in the direction of the galactic rotation. Outside the corotation radius residual velocities should be reversed (e.g., Figure 2 in Mel’Nik et al. 1999; Mel’Nik et al. 2001). By assuming a spiral pattern speed of (e.g., Bissantz et al. 2003) and a Galactic rotation of about 240 km s-1, the corotation radius would be located at about 12 kpc. G75.30+1.32 shows a residual velocity toward the Galactic center consistent with the star-forming region inside the corotation radius (Table 4). Furthermore, the streaming motions of star-forming regions measured so far along the Outer arm (Table 4) show positive values toward the Galactic center and suggest a corotation radius above a Galactocentric distance of 13 kpc. On the contrary, Russeil et al. (2007) located the corotation radius between the Perseus arm and the Outer arm in order to explain the opposite sign of residual velocities of their H ii regions. Note that, this estimate accounted only for residual radial velocities (). As soon as the BeSSeL survey222see the web page at the following URL, http://www.mpifr-bonn.mpg.de/staff/abrunthaler/BeSSeL/index.shtml and the VERA project333see the web page at the following URL, http://veraserver.mtk.nao.ac.jp/index.html increase the sample of 3-dimensional velocity measurements along the Outer arm, we should be able to assess these issues with stronger statistical support.
Finally, we can estimate the pitch angle of the Outer arm between Galactic longitudes from to . We mention as a caveat that spiral arms in other galaxies can have “kinks” and variations of pitch angle over large portions of an arm (e.g., Seigar & James 1998). For the simplest case of a logarithmic spiral arm (e.g., Reid et al. 2009b), we fitted the parallax data of G75.30+1.32 (first quadrant) together with the two previous (trigonometric) measurements of star-forming regions along the Outer arm (Table 4). This approach formally yields a pitch angle of which covers about of longitude between the first and third Galactic quadrants. In Figure 5, we display this result with the logarithm of the Galactocentric radius as a function of the Galactocentric longitude (, defined as 0 toward the Sun). While perfect-logarithmic, spiral arm sections should appear as straight lines in such a plot, the measurement for the star-forming region WB 89–437 deviates from the fit by about three times the parallax uncertainty ( pc). This behavior may be explained when considering the spread of star-forming regions within an arm with a width of several hundreds of pc. The mean value derived here is in good agreement with a weighted average of published data for Galactic spiral arms, which gives a mean pitch angle of (Vallée, 2008), and agrees also with a more recent estimate of for the Outer arm based on modeling of FIR cooling lines from the Galactic interstellar medium (Steiman-Cameron et al., 2010). Furthermore, it is consistent with the first direct estimate of the Perseus arm pitch angle () made with the trigonometric distances of its HMSFRs (Reid et al., 2009b).
References
- Bailin (2003) Bailin, J. 2003, ApJ, 583, L79
- Benjamin et al. (2005) Benjamin, R. A., et al. 2005, ApJ, 630, L149
- Binney (1992) Binney, J. 1992, ARA&A, 30, 51
- Bissantz et al. (2003) Bissantz, N., Englmaier, P., & Gerhard, O. 2003, MNRAS, 340, 949
- Brand & Blitz (1993) Brand, J., & Blitz, L. 1993, A&A, 275, 67
- Brand et al. (1994) Brand, J., et al. 1994, A&AS, 103, 541
- Bronfman et al. (1996) Bronfman, L., Nyman, L.-A., & May, J. 1996, A&AS, 115, 81
- Brunthaler et al. (2011) Brunthaler, A., et al. 2011, arXiv:1102.5350
- Dame et al. (2001) Dame, T. M., Hartmann, D., & Thaddeus, P. 2001, ApJ, 547, 792
- Dame & Thaddeus (2011) Dame, T. M., & Thaddeus, P. 2011, ApJ, 734, L24
- Dehnen & Binney (1998) Dehnen, W., & Binney, J. J. 1998, MNRAS, 298, 387
- Digel et al. (1990) Digel, S., Thaddeus, P., & Bally, J. 1990, ApJ, 357, L29
- Fomalont et al. (2003) Fomalont, E. B., Petrov, L., MacMillan, D. S., Gordon, D., & Ma, C. 2003, AJ, 126, 2562
- Hachisuka et al. (2009) Hachisuka, K., Brunthaler, A., Menten, K. M., Reid, M. J., Hagiwara, Y., & Mochizuki, N. 2009, ApJ, 696, 1981
- Honma et al. (2007) Honma, M., et al. 2007, PASJ, 59, 889
- Hou et al. (2009) Hou, L. G., Han, J. L., & Shi, W. B. 2009, A&A, 499, 473
- Kalberla et al. (2005) Kalberla, P. M. W., Burton, W. B., Hartmann, D., Arnal, E. M., Bajaja, E., Morras, R., Pppel, W. G. L. 2005, A&A, 440, 775
- Jiang & Binney (1999) Jiang, I.-G., & Binney, J. 1999, MNRAS, 303, L7
- Leung & Thaddeus (1992) Leung, H. O., & Thaddeus, P. 1992, ApJS, 81, 267
- Levine et al. (2006) Levine, E. S., Blitz, L., & Heiles, C. 2006, Science, 312, 1773
- Lin et al. (1969) Lin, C. C., Yuan, C., & Shu, F. H. 1969, ApJ, 155, 721
- Mead & Kutner (1988) Mead, K. N., & Kutner, M. L. 1988, ApJ, 330, 399
- Mel’Nik et al. (1999) Mel’Nik, A. M., Dambis, A. K., & Rastorguev, A. S. 1999, Astronomy Letters, 25, 518
- Mel’Nik et al. (2001) Mel’Nik, A. M., Dambis, A. K., & Rastorguev, A. S. 2001, Astronomy Letters, 27, 521
- Nakanishi & Sofue (2003) Nakanishi, H., & Sofue, Y. 2003, PASJ, 55, 191
- Nakanishi & Sofue (2006) Nakanishi, H., & Sofue, Y. 2006, PASJ, 58, 847
- Pandey et al. (2006) Pandey, A. K., Sharma, S., & Ogura, K. 2006, MNRAS, 373, 255
- Petrov et al. (2007) Petrov, L., Hirota, T., Honma, M., Shibata, K. M., Jike, T., & Kobayashi, H. 2007, AJ, 133, 2487
- Reid et al. (2009a) Reid, M. J., Menten, K. M., Brunthaler, A., Zheng, X. W., Moscadelli, L., & Xu, Y. 2009a, ApJ, 693, 397
- Reid et al. (2009b) Reid, M. J., et al. 2009, ApJ, 700, 137
- Russeil et al. (2007) Russeil, D., Adami, C., & Georgelin, Y. M. 2007, A&A, 470, 161
- Sanna et al. (2010) Sanna, A., Moscadelli, L., Cesaroni, R., Tarchi, A., Furuya, R. S., & Goddi, C. 2010, A&A, 517, A71
- Sato et al. (2010) Sato, M., Reid, M. J., Brunthaler, A., & Menten, K. M. 2010, ApJ, 720, 1055
- Schönrich et al. (2010) Schönrich, R., Binney, J., & Dehnen, W. 2010, MNRAS, 403, 1829
- Sellwood (2010) Sellwood, J. A. 2010, arXiv:1006.4855
- Seigar & James (1998) Seigar, M. S., & James, P. A. 1998, MNRAS, 299, 685
- Steiman-Cameron et al. (2010) Steiman-Cameron, T. Y., Wolfire, M., & Hollenbach, D. 2010, ApJ, 722, 1460
- Taylor & Cordes (1993) Taylor, J. H., & Cordes, J. M. 1993, ApJ, 411, 674
- Vallée (2008) Vallée, J. P. 2008, AJ, 135, 1301


| Source | R.A. (J2000) | Decl. (J2000) | P.A. | HPBW | Fpeak | Image rms | VLSR | |
|---|---|---|---|---|---|---|---|---|
| (h m s) | ( ’ ”) | () | () | (Jy beam-1) | (Jy beam-1) | (km s-1) | ||
| G75.30+1.32 | 20 16 16.0117 | 37 35 45.807 | 4.499 | 0.007 | ||||
| J2015+3710 | 20 15 28.7297 | 37 10 59.514 | 0.4 | 2.301 | 0.010 | |||
| J2018+3812 | 20 18 42.8500 | 38 12 41.700 | 0.8 | +58 | 0.079 | 0.002 |
Note. — Positions and source properties for the target maser and the QSO calibrators. The absolute position of the peak of the phase-reference maser channel No. 131 (belonging to feature No. 2 in Table 2) refers to the second (middle) epoch and is accurate to within mas. We report the positions of the calibrators used in the VLBA correlator. Angular offsets () and position angles (P.A.) east of north relative to the maser source are indicated in columns 4 and 5. Columns 6, 7, and 8 give the natural restoring beam sizes (HPBW), the peak intensities (Fpeak), and image rms noise of the phase-reference maser channel (at VLSR) and K-band background sources from the second epoch.
| Feature | Detection | VLSR | Fpeak | Vx | Vy | ||
|---|---|---|---|---|---|---|---|
| No. | (epochs) | (km s-1) | (Jy beam-1) | (mas) | (mas) | (mas yr-1) | (mas yr-1) |
| 1 | 2,3,4 | –53.89 | 9.84 | ||||
| 2 | 1,2,3,4 | –56.84 | 8.89 | ||||
| 3 | 1,2,3,4 | –56.42 | 7.87 | ||||
| 4 | 2,3,4 | –56.00 | 6.66 | ||||
| 5 | 1,2,3,4 | –54.73 | 4.92 | ||||
| 6 | 1,2,3,4 | –55.57 | 4.80 | ||||
| 7 | 2,3,4 | –63.58 | 3.08 | ||||
| 8 | 2,3,4 | –58.52 | 2.54 | ||||
| 9 | 2,3,4 | –61.05 | 2.09 | ||||
| 10 | 1,2,3,4 | –55.57 | 1.50 | ||||
| 11 | 2,3,4 | –57.26 | 1.16 | ||||
| 12 | 2,3 | –55.15 | 1.02 | ||||
| 13 | 1,2,3,4 | –55.57 | 0.82 | ||||
| 14 | 1,2,3,4 | –56.00 | 0.70 | ||||
| 15 | 1,2,3,4 | –59.79 | 0.66 | ||||
| 16 | 2,3,4 | –56.00 | 0.58 | ||||
| 17 | 1 | –48.41 | 0.55 | ||||
| 18 | 1,2,3,4 | –66.11 | 0.54 | ||||
| 19 | 4 | –55.15 | 0.50 | ||||
| 20 | 1,2,3,4 | –59.79 | 0.48 | ||||
| 21 | 4 | –58.52 | 0.37 | ||||
| 22 | 2,3,4 | –52.63 | 0.32 | ||||
| 23 | 1 | –54.73 | 0.32 | ||||
| 24 | 2,3,4 | –57.68 | 0.28 | ||||
| 25 | 1,2,3,4 | –63.58 | 0.24 | ||||
| 26 | 4 | –55.57 | 0.22 | ||||
| 27 | 4 | –62.32 | 0.22 | ||||
| 28 | 2,3 | –54.31 | 0.20 | ||||
| 29 | 2,3,4 | –58.10 | 0.18 | ||||
| 30 | 1 | –50.52 | 0.16 | ||||
| 31 | 1 | –54.73 | 0.16 | ||||
| 32 | 1,2,3 | –56.84 | 0.13 | ||||
| 33 | 3 | –53.89 | 0.12 | ||||
| 34 | 1,2,3,4 | –59.79 | 0.11 | ||||
| 35 | 1 | –58.94 | 0.10 | ||||
| 36 | 2,3 | –58.94 | 0.09 | ||||
| 37 | 2,3 | –61.47 | 0.07 | ||||
| 38 | 4 | –50.52 | 0.07 |
Note. — For each identified feature, the label (given in Column 1) increases with decreasing brightness and the different epochs of detection are reported in Column 2. Columns 3 and 4 report the LSR velocity and brightness of the brightest spot, observed at the epoch underlined in Column 2. Columns 5 and 6 give the position offset relative to the feature No. 2 (centered on the phase-reference maser channel No. 131, see Table 1) in the east and north directions, respectively, at the first epoch of detection. The uncertainties give the intensity-weighted standard deviation of the spots distribution within a feature. Columns 7 and 8 report the projected components of the feature proper motion relative to the feature No. 2, along the east and north directions, respectively. A proper motion of 1 mas yr-1 corresponds to 44 km s-1 at a distance of 9.3 kpc.
| Maser VLSR | Background | Parallax | ||
|---|---|---|---|---|
| (km s-1) | Source | (mas) | (mas yr-1) | (mas yr-1) |
| J2015+3710 | ||||
| J2018+3812 | ||||
| Combined | ||||
| Best-value for the Secular proper motion of G75.30+1.32 | ||||
Note. — Column 1 reports the LSR velocity of the reference maser spot (belonging to feature No. 5 in Table 2); column 2 indicates the background sources whose data were used to model the relative proper motion of the maser for the parallax fit; column 3 reports the fitted parallax; columns 4 and 5 give the fitted proper motions along the east and north directions, respectively. Combined fit used a single parallax parameter for the maser source position w.r.t. the two QSOs, after fixing the best overall proper motion in each coordinate (see Section 3.2). The uncertainty for each parallax fit was obtained from the formal fitting uncertainty. The Secular proper motion of G75.30+1.32 was obtained by the combined fit value corrected for the internal proper motion of the reference spot.
| Source | b | Rp | Us | Vs | Ws | Ref. | |
|---|---|---|---|---|---|---|---|
| (deg) | (deg) | (kpc) | (km s-1) | (km s-1) | (km s-1) | ||
| G75.30+1.32 | 75.30 | +1.32 | 10.7 | ||||
| WB 89–437 | 135.28 | +2.80 | 13.2 | 1 | |||
| S 269 | 196.45 | 13.4 | 2 |
Note. — Residual motion of sources that belong to the Outer arm with respect to a reference frame rotating with the Galaxy and assuming a flat rotation curve. These fits consider the best estimates of R kpc and km s-1 given in Brunthaler et al. (2011) and the updated values of the solar motion in Schönrich et al. (2010). Column 4 reports the projected Galactocentric distance of each source; column 5, 6, and 7 give the residual velocity components toward the Galactic center, in the direction of Galactic rotation and toward the North Galactic Pole, respectively. Ref.: (1) Hachisuka et al. (2009); (2) Honma et al. (2007).