Rest-frame UV–Optically Selected Galaxies at : Searching for Dusty Star-forming and Passively Evolving Galaxies
Abstract
A new set of color selection criteria (VJL) analogous with the BzK method is designed to select both star-forming galaxies (SFGs) and passively evolving galaxies (PEGs) at by using rest-frame UV–optical (V-J vs. J-L) colors. The criteria are thoroughly tested with theoretical stellar population synthesis models and real galaxies with spectroscopic redshifts to evaluate their efficiency and contamination. We apply the well-tested VJL criteria to the HST/WFC3 Early Release Science field and study the physical properties of selected galaxies. The redshift distribution of selected SFGs peaks at z2.7, slightly lower than that of Lyman break galaxies at z3. Comparing the observed mid-infrared fluxes of selected galaxies with the prediction of pure stellar emission, we find that our VJL method is effective at selecting massive dusty SFGs that are missed by the Lyman break technique. About half of the star formation in massive () galaxies at is contributed by dusty (extinction E(B-V)0.4) SFGs, which however, only account for 20% of the number density of massive SFGs. We also use the mid-infrared fluxes to clean our PEG sample, and find that galaxy size can be used as a secondary criterion to effectively eliminate the contamination of dusty SFGs. The redshift distribution of the cleaned PEG sample peaks at z2.5. We find six PEG candidates at z3 and discuss possible methods to distinguish them from dusty contamination. We conclude that at least part of our candidates are real PEGs at z3, implying that this type of galaxies began to form their stars at z5. We measure the integrated stellar mass density (ISMD) of PEGs at z2.5 and set constraints on it at z3. We find that the ISMD grows by at least about factor of 10 in 1 Gyr at 3z5 and by another factor of 10 in next 3.5 Gyr (1z).
1 Introduction
Understanding galaxy formation and evolution remains one of the most outstanding questions in astronomy. According to the standard paradigm, galaxies are initially formed in the center of small cold dark matter halos, gradually assembled with time through hierarchical processes, and eventually evolved into populations with various color, size, morphology, etc., as observed in our local universe (White & Rees, 1978). However, the physics behind this scenario is still poorly understood. Theoretical models (e.g., Benson et al., 2003; Bower et al., 2006; Croton et al., 2006; De Lucia et al., 2006) require complex ingredients (e.g., using feedback to quench star formation in galaxies) in addition to simple gas falling and cooling to reproduce even basic observations of nearby galaxies, such as luminosity function (e.g., Blanton et al., 2001; Norberg et al., 2002; Blanton et al., 2003) and color bimodality (e.g., Kauffmann et al., 2003; Bell et al., 2004; Blanton et al., 2005). Since these ingredients are predicted (or designed) to begin to work since the universe is young, it is essential to test them through observational studies on the physical properties of high-redshift galaxies.
During the 13.7 billion years of cosmic time, the era of is of particular interest, in terms of star formation, stellar mass content, and galaxy morphology. First, although the increase of cosmic star formation rate density (SFRD) with redshift is well studied out to (e.g., Hopkins, 2004; Hopkins & Beacom, 2006), the question of whether the SFRD has a broad peak during is still far from being finally solved (e.g., Hopkins, 2004; Hopkins & Beacom, 2006; Pérez-González et al., 2008; Chary & Pope, 2010). Furthermore, if such a peak exists, what is the mechanism that turns off the bulk of star formation in the universe? Second, being related to the evolution of the SFRD, the assembly history of massive () galaxies is still in question. A large number of massive galaxies is found at z2 (e.g., Daddi et al., 2004b; Fontana et al., 2004; Glazebrook et al., 2004; Saracco et al., 2005), but only a few of them are found at z3.5 (Mobasher et al., 2005; Dunlop et al., 2007; Rodighiero et al., 2007; Wiklind et al., 2008; Mancini et al., 2009). This dearth of massive galaxies at high redshift raises the question of when and how these giants were largely assembled in the universe. Last but not the least, the morphology of galaxies also undergoes a transition at z3. Although being studied in detail in the local universe and even traced back to z1.5 (van den Bergh et al., 2000), the Hubble sequence of galaxy morphology is not believed to be in place at z3 (Giavalisco et al., 1996; Conselice et al., 2004; Ravindranath et al., 2006) because a large fraction of galaxies in that epoch has irregular shapes (chain-like, clumpy, multiple cores, etc.). Therefore, the origin and emergence of the Hubble sequence remains an open question. To answer all the above questions requires observational studies on the physical properties (e.g., star formation rate [SFR], stellar mass, and morphology) of galaxies at z3.
High-redshift galaxies can be effectively selected from deep sky surveys through their broad-band colors. Star-forming galaxies (SFGs) at z3 and above are prevalently selected with the dropout method by locating the position of the Lyman break from their rest-frame UV colors (e.g., Giavalisco, 2002; Steidel et al., 2003; Giavalisco et al., 2004). This technique has been proved to be very successful because galaxies selected in this way, namely, Lyman break galaxies (LBGs, see Giavalisco, 2002, for a review), are spectroscopically confirmed as SFGs at high redshift (Steidel et al., 1996a, b, 1999, 2003) with little contamination. Recently, this technique has been extended to select galaxies at 1.4z2.5 (BX/BM galaxies, Adelberger et al., 2004; Steidel et al., 2004). However, the Lyman break technique misses one interesting galaxy population, namely dusty SFGs. How much this population contributes to the cosmic SFRD and number density of galaxies at z3 is still controversial. Studies using far-IR or sub-millimeter (sub-mm) emission from cold dust show that some dusty galaxies, for example sub-mm galaxies (e.g., Blain et al., 2002; Chapman et al., 2003, 2005; Swinbank et al., 2006), have SFRs up to . The high SFRs of dusty galaxies imply that the contribution of this population to the cosmic SFRD at z3 may not be ignored. To avoid underestimating the SFRD due to the exclusion of this population, a new color selection method is required to select SFGs independent of dust reddening.
Besides dusty SFGs, passively evolving galaxies (PEGs) at high redshift are also missed by the Lyman break technique. Although PEGs contribute little to the SFRD, they are directly related to the ceasing of star formation in galaxies and to the history of stellar mass assembly in the universe. To search for this population, several color selection criteria have been proposed. Among them, the most commonly used two are the Extremely Red Objects (EROs; Thompson et al., 1999; Daddi et al., 2000; Roche et al., 2002, 2003; McCarthy, 2004) and Distant Red Galaxies (DRGs; Franx et al., 2003; van Dokkum et al., 2003, 2004, 2006; Papovich et al., 2006). EROs are selected with very red optical to near-IR color, typically , while DRGs have a red near-IR color with . Both methods use the red color as an indicator of the large amount of old stars in galaxies. However, due to the strong degeneracy between age and dust reddening, the red color of a galaxy could be caused by either old stars or high dust extinctions. As a result, samples selected by both methods contain both massive PEGs and dusty SFGs with similar fractions, as showed by spectroscopic observations (Cimatti et al., 2002, 2003; Förster Schreiber et al., 2004; Yan et al., 2004). To exclude the contamination of SFGs, a more efficient way of selecting PEGs at z3 is needed.
A selection method that satisfies the above requirements already exists for galaxies at z2, as proposed by Daddi et al. (2004a). This method uses the B-, z-, and K-band photometry to select both SFGs and PEGs at z2. Samples selected through the BzK method are now widely used to investigate several aspects of galaxies at z2, from physical properties (e.g., Daddi et al., 2004a, 2005; Reddy et al., 2005; Daddi et al., 2007b, a; Blanc et al., 2008), abundance (Kong et al., 2006; Lane et al., 2007; Blanc et al., 2008), stellar mass function (Grazian et al., 2007), to clustering (Kong et al., 2006; Blanc et al., 2008).
In this work, we try to design an analogous method that selects and classifies simultaneously both SFGs (with different dust extinctions) and PEGs at 2.3z3.5. For this purpose, we extend the successful BzK method from z2 to z3 by replacing the selection bands with the V-, J-, and IRAC 3.6m band (hereafter L-band), according to the relative shift of galaxy spectra between the two redshifts. Our selection method (hereafter VJL) uses the same rest-frame colors as the BzK method so that galaxies selected by both methods have same spectral types. However, due to the different depth and sensitivities of the bands used in each method, the VJL selected sample may have different incompleteness and contamination from the BzK selected sample.
Nowadays, photometric redshift (photo-z) can be fairly accurately measured with relative error of only a few percent (e.g., Ilbert et al., 2009; Dahlen et al., 2010) and is hence widely used to select galaxies within a certain redshift range. However, the bias of photo-z selection is not explicit. It is common to characterize photo-z errors with a redshift probability distribution function (PDF). The accuracy of the distribution function strongly depends on the assumed mix of galaxy templates in the spectral energy distribution (SED) library. Unfortunately, our knowledge on the true SED types is limited and the commonly used SED libraries are often not good representatives of real galaxies. Let alone the mystery of dust extinction curve, initial mass function (IMF), metallicity of high-z galaxies, one major uncertainty of fitting high-z galaxies is the unknown star formation history (SFH). The commonly used exponentially declined SFH (-model) may be a suitable approximation for low-z galaxies, but is not a realistic model for high-z galaxies. Recently postulated hypotheses on SFH of high-z galaxies include exponentially increasing (Maraston et al., 2010) or roughly linearly increasing (Lee et al., 2010) SFH. Using an unrealistic SFH would eventually result in a mis-interpretation of the bias of photo-z selection.
On the other side, the bias of color selection can be fairly explicitly determined. One easy way to do so is applying the color criterion to simulated galaxies that have a certain range of redshift, SFHs and extinctions and calculating the success and failure rate of the selection. Thus, one can robustly measure the expected redshift distribution as well as the incompleteness of the selection as a function of several variables, such as magnitude, size, and color of galaxies. Moreover, color selection is easier to reproduce. Unlike photo-z selections, results of which may vary from people to people, depending on the used SED-fitting codes or SED libraries, color selection results are robust and make the comparison of different works easy for the whole community. The success of color selection method has been proved by the prevalence of Lyman break technique (see the review of Giavalisco, 2002).
In this paper, we apply our VJL selection method to the HST/WFC3 Early Release Science (ERS, Windhorst et al., 2011) observations in the south field of the Great Observatories Origins Deep Survey (GOODS, Giavalisco et al., 2004) South field (GOODS-S). Serving as an ideal test field of our selection method, ERS brings three advantages for us to calibrate and optimize our method. First, its deep (27 AB mag) J-band allows us to select galaxies that are faint in their rest-frame optical bands. These galaxies could be dusty SFGs and the ability to detect and correctly classify them is a key of our method. Second, embedded within GOODS South field, ERS is augmented by several existing data sets, from X-ray, optical, to mid-infrared band and sub-mm band. The multi-wavelength data enable us to accurately understand the nature of our selected galaxies. Third, ERS has similar depth on J- and H-bands as the upcoming CANDELS observation (Grogin et al., 2011; Koekemoer et al., 2011) so that our method calibrated in ERS can be easily adapted to apply to CANDELS data.
Throughout the paper, we adopt a flat cosmology with , and use the Hubble constant in terms of . All magnitudes in the paper are in AB scale (Oke, 1974) unless otherwise noted.
2 The Data
2.1 Images
The ERS observation (Windhorst et al., 2011) covers 40–50 of the GOODS South field in 10 bands. The data used in this work are its near-IR observations, i.e., F098M (Ys), F125W (J), and F160W (H) images. The 50% completeness limit for 5- detections for typical compact objects (circular aperture with radius of 0.4′′ ) is 27.2, 27.55, and 27.25 for Ys, J, and H. We re-processed the images and drizzled them to a 0.06′′ per pixel scale and registered to the GOODS WCS.
The GOODS south field has been observed with various telescopes and instrument combinations, from X-ray to sub-mm and radio. Relevant to our analysis here are imagings of Very Large Telescope (VLT)/VIMOS ultra-deep U-band (Nonino et al., 2009), HST/ACS BViz (Giavalisco et al., 2004), VLT/ISAAC JHKs (Retzlaff et al., 2010), Spitzer/IRAC 3.6, 4.5, 5.7, 8.0 m (M. Dickinson et al. in preparation), and Spitzer/MIPS 24 m. Table 1 summarizes the sensitivity (limiting magnitude of S/N=5 for a point source) and resolution, namely, the full width at half-maximum (FWHM) of point-spread function (PSF), of each band used in this study.
In our work, we also try to select an LBG sample at z3 through the U-band dropout technique as a reference sample to compare to our VJL sample. The VLT/VIMOS U-band used in GOODS-S is blueward to the traditional U-band and would bias selected galaxies toward higher redshift. The other U-band in GOODS-S, namely the CTIO U-band, is a traditional U-band, but the depth of its imaging is about 1.5 mag shallower than that of VIMOS U-band. In order to select a relatively complete U-band dropout sample at z3, we turn to use the multi-wavelength catalog of the GOODS North field (GOODS-N), where the KPNO U-band imaging satisfies the requirements of being both traditional U-band and deep to valid our z3 LBG selection. Besides having the KPNO U-band and HST/ACS and Spitzer IRAC observations, GOODS-N also has the ground-based NIR images observed through CFHT WIRCAM J- and K-band (Lin et al., 2011; Wang et al., 2010). We list their sensitivity and resolution, together with those of KPNO U-band, in Table 1.
| Filter | Sensitivity | Resolution |
|---|---|---|
| (Limiting Magnitude of | (FWHM of | |
| S/N=5 for Point Source) | PSF) | |
| VIMOS U | 28.00 | 0.8′′ |
| CTIO U | 25.8 | 1.5′′ |
| KPNO U | 27.1 | 1.15′′ |
| ACS F435W (B) | 28.7 | 0.08′′ |
| ACS F606W (V) | 28.8 | 0.08′′ |
| ACS F775W (i) | 28.3 | 0.08′′ |
| ACS F850LP (z) | 28.1 | 0.09′′ |
| WFC3/IR F098M (Ys) | 27.2 | 0.12′′ |
| WFC3/IR F125W (J) | 27.55 | 0.13′′ |
| WFC3/IR F160W (H) | 27.25 | 0.15′′ |
| ISAAC J | 25.0 | 0.5′′ |
| ISAAC H | 24.5 | 0.5′′ |
| ISAAC Ks | 24.4 | 0.5′′ |
| CFHT/WIRCAM J | 24.6 | 0.8′′ |
| CFHT/WIRCAM K | 24.2 | 0.8′′ |
| IRAC 3.6 m (ch1 or L) | 26.1 | 1.7′′ |
| IRAC 4.5 m (ch2) | 25.5 | 1.7′′ |
| IRAC 5.8 m (ch3) | 23.5 | 1.7′′ |
| IRAC 8.0 m (ch4) | 23.4 | 1.9′′ |
| MIPS 24 m | 20.4 | 6′′ |
2.2 Catalogs
To robustly measure the photometry of objects in all above bands with mixed resolutions, we use a software package with object template-fitting method (TFIT; Laidler et al., 2007). For each object, TFIT uses the spatial position and morphology of the object in a high-resolution image to construct a template. This template is then fit to the images of the object in all other low-resolution bands. During the fitting, the fluxes of the object in low-resolution bands are left as free parameters. The best-fit fluxes are considered as the fluxes of the object in low-resolution bands. These procedures can be simultaneously done for several objects which are close enough to each other in the sky so that the deblending effect of these objects on the flux measurement would be minimized. Experiments on both simulated and real images show that TFIT is able to measure accurate isophotal photometry of objects to the limiting sensitivity of the image (Laidler et al., 2007).
Catalogs of different fields (ERS, GOODS-S and GOODS-N) are generated based on different detection bands. In the ERS catalog, we use WFC3/IR H-band as the detection band as well as TFIT high-resolution template. ACS BViz and WFC3 YJH isophotal photometry is measured in dual-image mode by SExtractor based on H-band detection. U-band, ISAAC Ks-band, and IRAC 4 channels’ photometry is measured through TFIT. For both GOODS fields, the ACS z-band is chosen as the detection band. ACS isophotal photometry is measured in dual-mode by SExtractor, while other bands’ photometry is measured by TFIT with z-band template (N. A. Grogin et al. in preparation). All SExtractor isophotal and ground-based TFIT (isophotal) fluxes are converted to total fluxes by multiplying an aperture correction factor, which is the ratio of SExtractor FLUX_AUTO and FLUX_ISO of the detection band of each filed (H-band for ERS and z-band for both GOODS fields).
In addition to the above bands, the GOODS fields are also observed by the Spitzer MIPS 24m channel. Fluxes of sources in MIPS images are measured by fitting PSF to prior positions of objects detected in the Spitzer IRAC 3.6m image. During the fitting, the positions of MIPS sources are allowed to wander by less than 0.6′′ from the IRAC prior position. After the first pass of fitting and subtraction of fitted MIPS sources, a second pass of fitting is run for MIPS sources that do not have IRAC counterparts. Sources detected and fit in both passes are combined together into the final MIPS catalogs. Details about the catalog of 24m photometry can be referred from Magnelli et al. (2011). To combine the TFIT and MIPS catalogs, we match sources in the two catalogs with positions, allowing a maximum matching distance of 1.0′′ .
3 Color Selection Criteria
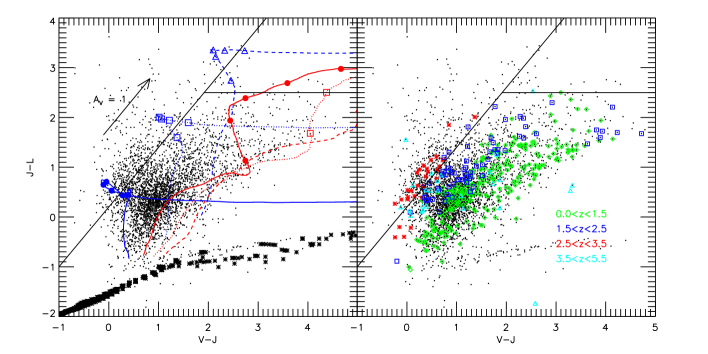
In order to simultaneously select both SFGs and PEGs at z3, we extend the BzK method at z2 (Daddi et al., 2004a) to z3 by replacing the B-z and z-K colors in the BzK criteria with the V-J and J-L color, as the rest-frame wavelengths observed by the BzK bands for a galaxy at z2 are redshifted to the observation windows of the VJL bands at z3. Because ratios of central wavelengths of the VJL bands to the BzK bands are not a constant, we also adjust the coefficient in the original BzK criteria so that the dust reddening vector is parallel to our selection window, which would ideally make our selection criteria independent of dust reddening. We determine the intersection terms of each selection equation through the distributions of galaxies with different redshifts in the J-L versus V-J color diagram (the right panel of Fig. 1). Since the slope of the star-forming VJL criterion (Eq. 1) is fixed based on the dust reddening vector, we shift the criterion line (the diagonal line in Fig. 1) to get the term (+0.2) in Eq. 1 that optimally separates galaxies at 1.5z2.5 (blue squares in the right panel of Fig. 1) from those at 2.5z3.5 (red stars in the same panel). For the intersection term (2.5) in Eq. 2, since we do not have passive galaxies at 2.5z3.5 that have been spectroscopically observed in our sample to help calibrate the selection window, we choose to use this term to exclude low-redshift interlopes as much as possible and meanwhile to keep the single stellar population (SSP) model of galaxies with age of 1 Gyr (the red dotted line with squares in the left panel of Fig. 1 at z=2.5 within the selection window. Thus, our VJL criteria are
| (1) |
for selecting SFGs and
| (2) |
for selecting PEGs, where means the logical and. Our method, similar to the BzK method, uses the strength and slope of the Balmer break, which is between the J- and L-bands for galaxies around z3, to select SFGs and distinguish them from PEGs. For simplicity, in this paper, we call galaxies selected or selection window defined by Equation 1 as sVJLs, while those by Equation 2 as pVJLs.
An extension of the Bzk method to higher redshift has been already proposed by Daddi et al. (2004a), who suggested to use R-, J-, and L-band colors to select galaxies at z2.5. Daddi et al. (2004a) tested the validity of the selection criterion in their K20 sample. They ended up with few detections at z2.5, as the K20 sample does not cover the redshift range z2.5. They also claimed that using GOODS ACS+ISAAC+Spitzer data set would be deep enough in all of the RJL bands to detect galaxies at z2.5. The RJL method is quite similar to out VJL, however, we use all space-based bands in our selection to ensure a deep sensitivity. Another color selection aiming toward selecting galaxies at 1.5z3.5 by using rest-frame UV/optical colors has been proposed by Cameron et al. (2011). They use HST Y-H versus V-z colors to identify and characterize 1.5z3.5 galaxies in the HUDF and ERS field. While their criteria have the advantage of having similar resolutions in all bands that are used for selection, our criteria cover a much longer wavelength baseline. And our reddest band (the L-band), a close proxy of stellar mass in the interested redshift range, enables our selected to be easily compared with a stellar mass selected sample.
We test the validity of our VJL selection criteria in two ways. First, we study the evolutionary track of stellar population synthesis models along redshift in the (J-L) versus (V-J) two-color diagram. Second, we study the distribution of real galaxies from the ERS field with spectroscopic redshift (spec-z) in the two-color diagram.
The left panel of Figure 1 shows tracks of shifting galaxy models along redshift (from z=0 to z=7) in the (J-L) versus (V-J) two-color diagram. Symbols in each track stand for models at (starting from the lowest one) z=2, 2.5, 3, 3.5, and 4. Galaxy models are retrieved from an updated version (CB09) of the stellar population synthesis library of Bruzual & Charlot (2003, ,BC03) with the Salpeter IMF (Salpeter, 1955) and solar metallicity. The Calzetti law (Calzetti et al., 1997, 2000) and the recipe of Madau (1995) are applied to each model to account for the dust reddening and the opacity of intergalactic medium (IGM) in the universe. Our selection windows corresponding to Equation 1 (the upper left region) and 2 (the upper right region) are outlined by black lines.
Blue tracks stand for models with a constant star formation (CSF) rate, age of 0.5 Gyr and various dust reddenings (solid: E(B-V)=0.0; dotted: E(B-V)=0.3; dashed: E(B-V)=0.6). These tracks show two facts: (1) all CSF models enter our sVJL selection window in the redshift range of and (2) the reddening vector (the black arrow in the panel) is almost parallel to our sVJL selection window (the diagonal black line). We also test our criteria with models with older ages (2 Gyr) as well as models with an exponentially declining SFH (-model, where , the characteristic time scale of star formation, is fixed to 1.0 Gyr). Both types of models have similar tracks as that of the CSF model with t=0.5 Gyr. These results demonstrate that our sVJL criterion can select SFGs with various SFH, age, and SFR independent of dust reddening.
However, the CSF model with E(B-V)=0.6 enters our pVJL selection window twice, at and . Models with different SFH but same age and dust reddening also enter the pVJL selection window at similar redshifts. The behavior of these models suggests that our pVJL galaxies may be contaminated by highly obscured SFGs from both lower () and higher () redshift, regardless of their exact SFH.
Red tracks show the evolutionary track of dust-free SSP models with ages of 0.5, 1, and 2 Gyr. All three SSP models enter our pVJL selecting window, but at different redshifts: 3.5, 3.0, and 2.5 for models with age of 0.5 Gyr (blue), 1.0 Gyr (green), and 2.0 Gyr (red). Overall, our pVJL criteria are able to select PEGs around z=2.5 and above.
The right panel of Figure 1 shows our second test, that is the position of galaxies with different spec-zs in the (J-L) versus (V-J) diagram. This test with real galaxies supplements the first one in two ways: (1) it helps in understanding the effect of photometry uncertainty and (2) it shows how our method works for galaxies with unknown and perhaps more complex SFH. Galaxies with spec-z in the ERS are divided into different redshift ranges and shown by colors and labels.
In this panel, the edge of our sVJL selection window effectively separates galaxies at from others, satisfying our expectation. However, several galaxies with lower redshift and a few with higher ones also enter our sVJL window. We suspect that photometry uncertainty is the main reason that scatters them into our sVJL window, although we cannot rule out the effect of a complex SFH. Few galaxies with (J-L) color redder than 2.5 are found in our spec-z sample. The lack of red galaxies is caused by the fact that spectroscopic observations are biased against dusty SFGs and PEGs because of their faint and featureless rest-frame optical spectra. It is also possible that red galaxies are really rare in the high-z universe. We note that a few galaxies from lower redshift () and higher redshift () enter the pVJL selection window. The existence of these types of contamination is consistent with our above analysis with theoretical models (see the left panel). We will discuss how to eliminate contamination in both selection methods later.
Active galactic nucleus (AGN) sources could also contaminate our VJL selected sample. As shown in Civano et al. (2011), about 30% of AGN at z3 show a typical optical spectrum of an SFG, but have X-ray luminosity , a typical value of quasars. In order to evaluate their contamination, we study the redshift tracks of AGN templates of Polletta et al. (2007) in the (J-L) versus (V-J) plot. Templates of type 2 QSO (QSO2), type 1 QSO with the lowest optical–to–IR ratio (BQSO1), and type 1 QSO with the highest optical–to–IR ratio (TQSO1) are all within our sVJL selection window at z=0. However, QSO2 leaves the window quickly before z=0.5, and BQSO1 also leaves the window around z=1. Given the small cosmic volume that our surveys observe at z1, we argue that these two types of AGN would not severely contaminate our sample. The only template that stays in our sVJL selection window up to z3.5 is TQSO1. We also examine the track of AGN + star-burst template of I19254 of Polletta et al. (2007). The template enters our sVJL selection window at z2 and evolves to redder (J-L) direction within the window as redshift increases. It suggests that our red (J-L2.5) dusty SFG sample could be contaminated by Seyfert 2 galaxy. We will discuss the possible contamination in detail later in Sec. 4.4. We also note that no QSO template enters our pVJL selection window, which indicates that our selected PEG sample is in principle immune from AGN contamination.
As a summary, using both theoretical models (CSF, -model, and SSP) and spectroscopically observed galaxies, we show that our sVJL selection window (defined by Equation 1) can select SFGs with various levels of SFR independent of dust reddening at . And our pVJL selection window (defined by Equation 2) can select PEGs around z=2.5 and above, although such a selected sample may be contaminated by dusty SFGs at and . Also, no template at or galaxies with spec-z1.5 enters either of our selection windows, suggesting that our criteria are effective at excluding low-redshift galaxies.
4 Star-forming VJL Galaxies
We apply our sVJL criterion, defined by Eq. 1, to the multi-wavelength catalog of the ERS field, which is based on the WFC3 H-band detection, as discussed in §2.2, to select SFGs at z3. To ensure an accurate measure of galaxy colors, we require all selected galaxies to have S/N10 in J- and L-bands. We also construct a samples with S/N20 in the two bands. Comparison between the two samples would show us how photometric uncertainty affects our selection results. For V-band photometry, if S/N1, we use the 1 photometric uncertainty as the upper limit of flux. The two samples contain 354 and 146 galaxies, respectively.
We note that the BzK color criterion of Daddi et al. (2004a) was constructed to be applied to K-selected samples. Similarly, one would expect the VJL criterion to be applied to L-band limited samples. Without an L-band detection, thus with an upper limit (at best) on the J-L color, no VJL galaxy can be unambiguously selected. Moreover, using L-band also ensures the closest proxy for mass selection of the sample. In this paper, we choose to apply the sigal-to-noise ratio (S/N) cut on both bands instead of on only the L-band so that we could have accurate J-L color. This is not contradictory with selecting an L-band limited sample. Instead, it asks for more strict constraint on the J-L color to exclude interlopes. This is well fitting the purpose of this paper to demonstrate the validity of the selection criterion. We also acknowledge that the use of S/N cut on two bands would bring a more complicated selection effect on the completeness of sample, because now the completeness is not only dependent on the proxy of mass, but also on the color. However, we will argue later (in §4.5 and §5.3) that the induced selection effect would not significantly change the quantitative results of comparing our VJL samples with other samples.
4.1 Deriving Physical Properties of Galaxies

We derive photo-zs and physical properties of selected galaxies by fitting their SEDs to stellar population synthesis models. Models used to measure photo-zs are extracted from the library of PEGASE 2.0 (Fioc & Rocca-Volmerange, 1997). Instead of using the redshift with the least , we integrate the probability distribution function of redshift (zPDF) and derive the likelihood-weighted average redshift. When the zPDF has two or more peaks, we only integrate the main peak that has the largest power. The accuracy of our photo-z measurement is shown in Figure 2, where we compare our photo-zs and spec-zs of galaxies that are spectroscopically observed in the ERS field. The top panel shows a very good agreement between photo-zs and spec-zs. The relative error (defined as ) has an almost zero mean (0.0005) and a very small deviation (0.037 after 3 clipping). And the fraction of outliers, defined as , is about 3.4%. The bottom panel shows the mean and standard deviation (after 3-sigma clipping) of relative errors in each redshift bin with a bin size 0.5. The means of the relative errors have no significant offset from zero at all redshift bins, especially for the range of , which is of the most interest in this study. The high accuracy of our photo-z measurement enables us to statistically study the physical properties of our selected galaxies without spectroscopic redshifts.
The physical properties (stellar mass, specific star formation rate [SSFR], and dust reddening) of galaxies are measured through SED-fitting models retrieved from the library of CB09 with the Salpeter IMF (Salpeter, 1955). The lower and upper cuts on mass in the IMF are and , respectively. The models consist of grid points in a parameter space spanned by redshift, dust extinction E(B-V), SFH (characterized by and age), and metallicity. The available values of each parameter are shown in Table 2. We apply the Calzetti law (Calzetti et al., 1997, 2000) and the recipe of Madau (1995) to the models to account for dust extinction and the opacity of IGM in the universe. For each model, the fluxes in all bands are pre-computed and stored in a grid database. When fitting a galaxy, we scan the database and calculate values for models in all grid points over the whole parameter space. The value is calculated as
| (3) |
where , , and are the observed flux, model flux, and observational uncertainty in the th band. is a normalization factor, which is equal to stellar mass if is normalized to in our pre-computed database. The model with the least is considered the best-fit model and its parameters are used as the measurements of the properties of the galaxy. During the SED-fitting, the redshift of a galaxy is fixed as its photo-z or its spec-z, if the latter is available.
In addition to the SED fitting with bands from U-band all the way to IRAC 8.0 m, we also estimate the E(B-V)s and SFRs of sVJL galaxies by using the slopes and fluxes of their rest-frame UV continuum. Compared with SED-fitting, this method is less model-dependent and requires no prior information on the SFH of galaxies. In this method, we use the Calzetti law (Calzetti et al., 1994, 2000) to convert the rest-frame UV-slope of a galaxy into its dust reddening, and calculate the unobscured SFR from its dust-corrected rest-frame UV continuum by using the formula in Kennicutt (1998). Since the SFHs of high-redshift SFGs are controversial (e.g., Lee et al., 2010; Maraston et al., 2010; Papovich et al., 2011), we prefer to use E(B-V)s and SFRs estimated from UV continuum for SVJLs.
| Parameter | Range | |
|---|---|---|
| Redshift | 0.0 to 7.0 with a bin size of 0.01 | |
| E(B-V)111E(B-V) runs up to 0.3 for models with . | 0.0 to 1.0, | |
| Metallicity | 0.004, 0.02, 0.08 | |
| Age (Gyr) | (1, 2, 3, 5, 8) , up to 13 | |
| (Gyr) | (1, 2, 3, 5, 8) , and |
4.2 Redshift Distribution
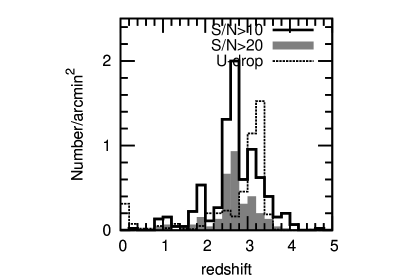
The redshift distributions of our sVJL samples with S/N10 and 20 are shown in Figure 3. Both distributions highly peak around z2.7 and extend to z3.5, demonstrating that, as we expected, our sVJL criterion is effective at selecting galaxies between . The S/N10 sample has a secondary peak around z=1.8, which is implying that the main contamination of our sVJL selection is coming from galaxies at z2. Fortunately, this secondary peak is largely diminished in the S/N20 sample. The number ratio between galaxies at z1.8 and at z2.8 decreases from 0.27 in the S/N10 sample to 0.17 in the S/N20 one. It suggests that the low-z contamination in our sVJL sample is induced by photometric uncertainty rather than the deficit of our method and hence can be removed by increasing the S/N cuts in J- and L-band. In later study, to balance the fraction of contamination and the number of statistics, we use the S/N10 sample as our fiducial sample.
4.3 Comparison with LBGs
Nowadays, high-redshift SFGs are commonly selected through the Lyman break technique. In order to avoid the contamination zone of elliptical galaxies, this technique compromises to only select galaxies with a bright and blue rest-frame UV continuum, namely SFGs with low or no dust extinction. Dusty SFGs, whose rest-frame UV color mimics that of elliptical galaxies, are missed by this technique. Because of this bias, the existence and contribution of dusty SFGs to the cosmic SFRD at z3 has been the topic of considerable debate. To shed a light on the above question, we compare galaxies selected through our sVJL method, which is designed to select both low-dust and dusty SFGs, with LBGs at z3.
The U-band dropout method is used to select LBGs at z3, because the Lyman break of an SFG is redshifted to between the U-band and the B-band. A sample of 1161 U-band dropouts is selected from GOODS North (878) and South (283) fields with the following criteria:
| (4) | |||||
We note that the number of U-band dropouts in GOODS-S is significantly less than that in GOODS-N, because the CTIO U-band image in GOODS-S is 1.5 mag shallower than the KPNO U-band image in GOODS-N. The physical properties of the U-band dropouts are measured in the same way used for the sVJL galaxies.
In Figure 3, we overplot the redshift distribution of the U-band dropout sample (dotted line) selected from GOODS-N. The distribution peaks around z3, being consistent with the expectation of LBGs, but significantly deviates from the peak of our sVJL sample. Since the offset between the peaks of the two samples is larger than 2 deviation of our photo-z measurement (), it is an intrinsic difference between the two methods rather than due to photo-z uncertainty. However, since the cosmic time interval between the two redshift peaks (250 Myr) is about 10 times less than the age of the universe at z3 (2.2 Gyr), we assume that the evolution of galaxies between the two redshifts is negligible. Under this assumption, any difference between the two samples is considered due to the fact that the two methods select galaxies with different physical properties rather than select galaxies with different redshifts. Also, in order to eliminate the effect of possible contamination, we only compare galaxies within the range of in the two methods.

A direct and illustrative way to compare both methods is to study the location of the U-band dropouts in the (J-L) versus (V-J) plot. We match the U-band dropouts that are selected from GOODS-S TFIT catalog to the ERS TFIT catalog to measure their (J-L) and (V-J) colors. Figure 4 shows the positions of 41 matched U-band dropouts (circles and squares) with S/N10 in J- and L-bands in the (J-L) versus (V-J) diagram, together with sVJLs (points). We note that the U-band dropouts are scattered along the edge of our sVJL selection window. Among 41 U-band dropouts, 16 fall outside our sVJL selection window. Although photometric uncertainty could contribute to the scatter, we suspect that the primary reason is due to the different redshift distribution between sVJLs and U-band dropouts. As shown in Figure 3, the U-band dropouts have systematically higher redshift than sVJLs and is hence easier for them to be scattered out of the selection window. To examine our suspicion, we divide the U-band dropouts sample into two sub-samples: z3.2 (circles) and z3.2 (squares). 10 out of 16 (63%) U-band dropouts outside the sVJL selection window have z3.2, suggesting that redshift is the main reason for these galaxies not being selected by our sVJL method.
The other feature of U-band dropouts is more prominent and physical: no U-band dropout has J-L color redder than 2.0 mag. As shown in the left panel of Figure 1, CSF galaxies with E(B-V)0.3 would have J-L color redder than 2.0 mag. Therefore, (J-L)2.0 mag can be treated as a rough division for weakly and strongly obscured galaxies. The lack of red U-band dropouts confirms conclusions of previous studies that LBGs miss highly obscured galaxies (e.g., Bouwens et al., 2009; Ly et al., 2011; Riguccini et al., 2011). On the other side, our sVJL method selects galaxies up to J-L around 3.0 mag, suggesting its ability to select highly obscured SFGs.
The difference of the E(B-V) distributions of samples selected by the two methods can be clearly seen from Figure 5, where E(B-V) is measured from the slope of rest-frame UV continuum and plotted as a function of stellar mass of galaxies. Both samples have similar E(B-V) distribution in the stellar mass range of . But in the range of , their E(B-V) distributions differ: the distribution of U-band dropouts ends around E(B-V)=0.4, while that of sVJLs in the S/N10 sample extends beyond E(B-V)=0.6.
The two upper panels of Figure 6 show the cumulative fraction of number of galaxies as a function of E(B-V) in both stellar mass ranges for sVJLs and U-band dropouts. In the range of , both sVJL and U-band dropout samples have similar cumulative fraction curve and only contain galaxies with E(B-V)0.4. In the range of , the U-band dropout sample still only contains E(B-V)0.4 galaxies, while about 20% of sVJLs (in the S/N10 sample) have E(B-V)0.4. The E(B-V) distribution of massive () sVJLs drops quickly beyond E(B-V)=0.6 in the S/N10 sample (only 5% have E(B-V)0.6). This could be attributed to two factors: (1) the real lack of very dusty SFGs at z3 or (2) the sensitivity of the catalog detection band image of ERS (H-band) is not deep enough to detect these galaxies. Either way, we can still conclude that, compared to U-band dropout method, our sVJL selection method can select moderate dusty (E(B-V)0.6) SFGs at .
We also note that the distribution of sVJLs in the S/N20 sample is similar to that of U-band dropouts, even in the range of . This reflects that an overcut on the J-band S/N would reduce our ability to detect dusty SFGs at z2.8. The S/N20 sVJL sample also contains fewer low-mass (around ) galaxies than the S/N10 sVJL sample. This can also be attributed to the overcut on the L-band S/N in the latter.


4.4 Dusty Star-forming Galaxies
Although red (J-L2.0) sVJLs are likely to be dusty SFGs at z2.7, a more careful census is needed to distinguish them from possible contamination. Specifically, PEGs at similar redshift have similar red rest-frame UV colors and hence can easily enter our sVJL sample due to photometric uncertainty. In order to clean our dusty sVJL sample, we have to break the age–dust degeneracy, which, however, cannot be broken by simply using rest-frame UV and optical data. Fortunately, at z2.7, the rest-frame 6 m emission from polycyclic aromatic hydrocarbons (PAHs), a feature of dusty SFGs, falls into the MIPS 24 m bandpass, and can help to separate dusty SFGs from PEGs. Any 24 m fluxes that are significantly brighter than the prediction of pure stellar emission should be dominantly contributed by dust emission and hence indicate a high amount of dust in the galaxies.
We match our sVJLs to GOODS-S MIPS 24 m catalog (see the description in Sec. 2.2), with a matching radius of 1.0′′ . Galaxies without MIPS 24 m counterparts are assigned a flux upper limit of 3 Jy, which is the upper envelope of the S/N–flux relation at S/N=1 in our MIPS 24 m catalog. (However, we note that we do not use 24m sources with flux level of 3 Jy for any scientific purpose. Sources with detection lower than 3 should be treated with caution.) A potential issue of measuring MIPS 24 m flux of galaxies is the uncertainty raised by confusion and crowding. Our 24 m catalog over the GOODS-S field contains about 22,000 sources, deducing an average number density of 1.2 (4.8) sources in each circle with radius of 3′′ (6′′ ), which is 0.5 (1.0) times the FWHM of MIPS 24 m PSF. This implies that 60% of light of a source is overlapping with the light of other sources. The PSF-fitting technique that we use to construct the catalog ideally reduces the influence to the lowest level by fitting nearby sources simultaneously. In this method, however, a slight oversubtraction (undersubtraction) of a bright source would result in a significant underestimation (overestimation) of fluxes of nearby sources.

In order to evaluate whether MIPS 24 m fluxes are correctly measured, we compare our PSF-fitting fluxes to fluxes that are derived through aperture correction. In a crowding environment, aperture correction on the flux measured through the central region (e.g., within an aperture with size of 1 FWHM of PSF) of a faint object tends to overestimate its flux, since the central region of the object could be polluted by the light of its nearby sources. In this case, the aperture corrected flux can be used as an upper limit. To obtain a conservative estimation of the contribution of dusty SFGs to the cosmic SFRD, we care more about sources whose fluxes are overestimated by PSF-fitting than those whose fluxes are underestimated, as the former could be PEGs but misclassified as dusty SFGs. Such misclassification would result in a severe overestimation of their SFR and hence their contribution to the SFRD. For this purpose, any sources whose PSF-fitting fluxes are significantly larger than their aperture corrected fluxes are thought to have incorrect PSF-fitting fluxes, and aperture corrected fluxes will be used for them.
Figure 7 shows the comparison between aperture corrected fluxes and PSF-fitting fluxes for sVJLs with E(B-V)0.4. For sources with PSF-fitting fluxes larger than 40 Jy, fluxes derived by both methods are in good agreement. This is not surprising though, as both methods are robust for bright sources. For source with PSF-fitting fluxes less than 10 Jy, aperture correction overestimates their fluxes due to the issue of confusion and crowding, as these sources are faint sources around bright sources. We use the PSF-fitting fluxes for these sources, as they are the best solution we can have for them. For sources with PSF-fitting fluxes between 10 Jy and 40 Jy, particularly of our attention is one source whose aperture correction flux is less than zero but whose PSF-fitting flux is larger than 10 Jy. As we discuss above, the incorrectly high PSF-fitting flux of this source is due to the under-subtraction of its nearby bright sources. We will mark this problematic source in later analysis.

Figure 8 shows the 24 m fluxes of our sVJLs as a function of stellar mass. For simplicity, we only plot sVJLs with E(B-V)0.4 and . Over-plotted (black lines) in the figure are the predictions of the 24 m flux–stellar mass relation for dust-free SSP models at z2.7, with age of 0.5, 1.0 and 2.0 Gyr (from top to bottom). Galaxies with 24 m fluxes significantly brighter than the prediction of SSP models are thought to be dusty SFGs, because their 24 m fluxes cannot be explained by pure stellar emission and hence should be contributed by PAH emission. On the other hand, galaxies whose 24 m fluxes are consistent with the predictions of SSP models are thought as contamination. We also mark the galaxy with problematic PSF-fitting flux with squares in the figure. If the problematic galaxy is treated as a PEG, the fraction of contamination is about 18% (2 out of 11). This result is encouraging, as it shows our sVJL method can select dusty SFGs with a low level of contamination.
Another possible source of contamination in our dusty SFGs is from AGN host galaxies. The warm dust around AGN can absorb and reprocess the energetic photons of AGN into IR emission that can be observed in the MIPS 24 m channel. We use the Chandra deep 4Ms X-ray image of CDFS222http://cxc.harvard.edu/cda/Contrib/CDFS.html to study the possible AGN contamination. None of our nine dusty SFGs is individually detected in the 4Ms Chandra catalog of Xue et al. (2011). The stacked hard X-ray image of them also reports a detection comparable to the noise level. However, the stacked soft X-ray image has a detection of 3.5. The soft detection may indicate that our dusty SFG sample is contaminated by AGN host galaxies. However, using the stacked image, we measured a hardness ratio of -1, which is softer than the predicted hardness ratio of even the least absorbed AGN model (column density ) at z3 in Wang et al. (2004). The ultra-soft spectrum of the stacked image implies that our dusty SFG sample is not heavily contaminated by AGN. We also calculate an average luminosity from the stacked soft-band X-ray images, using a mean redshift of 2.7. The mean luminosity is , with the lower and upper limits from the Poisson uncertainty on net counts of and . If we use the SFR–X-ray relation of Ranalli et al. (2003): Lx/SFR , we get an average SFR of about 100 . This value is consistent with the SFR measured through the rest-frame UV continuum of these galaxies. These galaxies are heavily obscured and occupy the high SFR end of the whole star-forming VJL sample. Therefore, we conclude that they are compatible with being star forming.
4.5 Contributions of Dusty Star-forming Galaxies
One of our motivations of selecting dusty SFGs around z3 is to evaluate their contribution to the number density, stellar mass density, and SFRD of SFGs. A precise measurement of the absolute contributions of dusty SFGs relies on the accurate correction of the incompleteness of the sample, which is a function of the redshift, surface brightness, color, and spectral types of galaxies. The best way to measure the incompleteness is simulating the detection ability of galaxies with different physical properties and multi-wavelength photometry. We leave such simulations to a future paper. Instead, in this paper, we try to estimate the relative contributions (compared with those of low-dust galaxies) of dusty SFGs to the above quantities to the first-order accuracy.
In our sVJL method, both low-dust and dusty galaxies are selected with the same color criterion from the same catalog. They are also aiming to the same redshift range. As a result, the two main factors that determine the selection incompleteness, namely, redshift and surface brightness limit of the survey, are roughly same for both low-dust and dusty sub-samples. We can assume that, to the first order, incompleteness is roughly same for both sub-samples. Therefore, the ratio of total numbers, SFRs, and stellar masses of both sub-samples should be immune to the incompleteness and accurate to the first order even no correction on incompleteness is applied. We acknowledge that the redder color and fainter rest-frame UV photometry of dusty galaxies may vary the selection incompleteness. However, both factors tend to increase the incompleteness of dusty SFGs so that our derived ratio is a conservative estimation of the contributions of dusty SFGs.
Based on above discussion, a simple way to measure the relative contributions of low-dust and dusty sub-samples is to study the cumulative number, SFR and stellar mass as functions of dust extinction E(B-V). Since E(B-V) has a loose relation with stellar mass (see Figure 5), we study sVJLs in two stellar mass ranges separately: and . We plot the cumulative curves of number (top panel), SFR (middle), and stellar mass (bottom) of our S/N10 and S/N20 sVJL samples in Figure 6, together with the curves of the U-band dropout sample as a reference. For galaxies with (left column), sVJLs (in both S/N10 and S/N20 samples) have similar cumulative curves with U-band dropouts, simply because there are almost no dusty (E(B-V)0.4) galaxies detected in this mass range, as shown by the left panel of Figure 5. The situation is same for S/N20 sVJLs in the range (right column), as the overcut on the J-band S/N reduces our ability to detect dusty galaxies. The significant difference comes from the S/N10 sVJLs, whose cumulative SFR curve obviously deviates from that of other samples in the range. About 50% of SFR is contributed by galaxies with E(B-V)0.4, although these dusty galaxies only contribute about 20% to number and 20% to stellar mass of galaxies in the mass range, as shown by the top right and bottom right panel of this figure.

An alternative way to evaluate the importance of dusty SFGs that are selected by our sVJL method is to compare their contributions (on number, SFR, and stellar mass densities) to those of U-band dropouts. The comparison again relies on the accurate measurements of the incompleteness of the two selection methods, but can be compromised through the following way. We choose a certain population of galaxies that is highly completely selected by both methods so that its three densities measured with both samples should be same even when no correction on incompleteness is applied to this population. We then normalized the densities of other populations in both samples to those of this population. The normalized density distributions hence show the relative contributions of each different populations in the two samples. We choose galaxies whose E(B-V)s are within of the median E(B-V) of each sample as the ”complete” sub-sample. In the stellar mass bin of , this sub-sample consists of galaxies with for both U-band dropouts and sVJLs, while in the bin, galaxies with .
The comparisons of normalized number density (top), SFRD (middle), and stellar mass density (bottom) of U-band dropouts (thin lines) and S/N10 sVJLs (thick lines) as a function of E(B-V) are shown in Figure 9. The same information of Figure 6, that about 20% to 30% of number density and about 50% of stellar mass and SFR densities in sVJLs at high mass end () are contributed by galaxies with E(B-V)0.3, can be inferred from this figure. However, an important point of Figure 9 is that the densities of low-dust (E(B-V)0.3) galaxies in the two samples are quite similar in both stellar mass bins, with an only % excess from the sVJL sample, which demonstrates that although the cumulative distributions are different in the high-mass end of the two samples, our sVJL method has the same ability to select low-dust galaxies as the U-band dropout method, in terms of the three densities. The 50% of contributions to stellar mass and SFR densities of dusty SFGs in our sVJL sample are ”net” contributions, instead of due to the possibility that low-dust galaxies are largely missed in our sVJL sample.
Our results, along with some recent studies, highlight the importance of counting SFR from dusty galaxies, which occupy the high SFR (and massive) end in the SFR–stellar mass plane, when calculating the cosmic SFRD. These galaxies are usually faint or even undetected in observed UV band at z3 and could be missed by UV only selection (e.g., Lyman break technique). Ly et al. (2011) carried out a census of SFGs at z = 1–3 in the Subaru Deep Field, where good statistics and accurate measurements of photo-z and physical properties are enabled by a large sample (53000 galaxies) and 20 band (1500 - 2.2m) photometry. They compared the selection results of BzK, LBG, and BX/BM, and found that among z=1-2.5 galaxies in their census, 81%–90% of them can be selected by combining the BzK selection with one of the UV techniques (z2 LBG or BX and BM). What is more important, they found that for galaxies brighter than K24 AB (roughly corresponding to for SFGs at z2), 65% of the star formation in them are contributed by galaxies with E(B-V)0.25, even though they are only one-fourth of the census by number. Their results are in very good agreement with ours, although aiming to lower redshift. Yun et al. (2012) studied the rest-frame UV and optical properties of sources detected by the deep 1.1 mm wavelength imaging of the GOODS-S by AzTEC/ASTE (Scott et al., 2010). They claimed that although not all sub-mm galaxies are faint and red in their rest-frame UV and optical bands, the majority of the AzTEC GOODS sources, which have a median redshift of 2.6% and 80% of which are at z2.6, are too faint and red to have been identified in previous surveys of SFGs and are likely be entirely missed in the current measurements of the cosmic SFRD.
5 Passively Evolving VJL Galaxies
In this section, we apply Eq. 2 to the ERS field to select PEGs at z3. With a concern that a high S/N threshold in rest-frame optical band would exclude real PEGs from our sample, we tune down the threshold to S/N5 in both J- and L-bands. However, we still construct samples with S/N10 and 20 to provide a reference on how photometric uncertainty affects our selection results. We find 32, 27, and 13 galaxies falling into our pVJL selection window for S/N5, 10, and 20. However, as shown in Figure 1, both low-z and high-z dusty SFGs also enter our pVJL selection window so that a fraction of our pVJL selected galaxies may not be real passive and old galaxies, but rather dusty SFGs. We will estimate the fraction of contamination in our pVJL sample and discuss how to clean the sample.
5.1 Clean Sample
As similar as in §4.4, we use MIPS 24 m flux to help identify contamination in our pVJL sample. Galaxies whose observed 24 m fluxes are 3 higher than the prediction of a dust-free passively evolving model (SSP with age of 2 Gyr) with the same redshift and stellar mass are considered as contaminating dusty galaxies, because their 24 m fluxes cannot be explained by pure stellar emission and hence are dominated by dust emission. The same issue we face here is again the confusion and crowding of MIPS 24 m image. We repeat the same test in Sec. 4.4 to compare PSF-fitting and aperture corrected fluxes. We use the aperture corrected fluxes for sources whose PSF-fitting fluxes are larger than the 1 confidence level of their aperture corrected fluxes, and use the PSF-fitting fluxes for other sources.
Comparing the observed 24 m fluxes of our pVJLs with stellar models, we find the contamination fraction of 59%, 59%, and 77% for samples with S/N cuts of 5, 10 and 20. The fraction does not decrease with the increase of S/N thresholds, suggesting that simply increasing the S/N cuts cannot help clean our pVJL sample. This is because such contamination is due to the intrinsic deficit of our selection method (as shown by the left panel of Figure 1, where a few tracks of dusty SFGs also enter our pVJL selection window) rather than due to photometric uncertainty. Moreover, the fraction of contamination is very high in all samples. This is not surprising though, because the number density of PEGs is expected to be low at such high redshift so that a small absolute number of contamination can occupy a relatively large fraction of the sample.
An additional condition must be applied to remove contamination from our pVJL sample. Although observations at longer wavelength, such as MIPS and Herschel data, can readily help identify the contamination of dusty galaxies, we attempt to restrict our selection criterion to using only V-, J- and L-band information so that the method can be easily applied to large surveys where deep observations at longer wavelengths may not be available. What is more important is that using only the three-band information enables a relatively easy multi-wavelength Monte Carlo simulation, which is essential to understand the systematics and bias of our selections. In this study, longer wavelength observations are only used to help calibrate and optimize our selection method.
A possible way to clean the sample is to examine the rest-frame optical size of galaxies. Cassata et al. (2011) show that the fraction of compact galaxies in PEG samples increases with redshift. At z2, about 70% of PEGs are compact. Extrapolating their relation to z3, we expect more than 90% of PEGs to have small size. If this expectation is true, galaxies with no 24 m detection is low should tend to have small radius and vice verse.
Figure 10 confirms our speculation by showing the relation between the significance of 24 m flux and J-band Kron radius. In the S/N5 sample, 85% of galaxies whose MIPS 24 m fluxes are within 3 deviation of a pure passive stellar emission have J-band Kron radius less than 1′′. On the other side, 84% of galaxies with significant 24 m fluxes, an indicator of dust emission, are larger than 1′′ in terms of Kron radius. This interesting finding of the relation between MIPS 24 m fluxes and galaxy sizes is a reflection of the size–star formation relation of massive galaxies at (e.g., Zirm et al., 2007; Toft et al., 2009) and suggests that using size can effectively distinguish real PEGs from dusty SFGs. Moreover, in the small size (′′ ) sample with S/N5, only 2 out of 14 galaxies have significant 24 m fluxes. Therefore, based on the high efficiency and low contamination of using small size to select PEGs, we add the condition 1′′ to our pVJL criterion (Eq. 2). After this extra condition being applied, our samples now contain 14, 10, and 2 galaxies with S/N cuts of 5, 10, and 20. And the contamination level is reduced to 14%, 10%, and 0% in the three samples.

| ID | R.A. | Decl. | Photo-z | E(B-V) | Z | Age | SFR | ||
|---|---|---|---|---|---|---|---|---|---|
| J2000 | J2000 | Gyr | Gyr | Log(M*/M⊙) | M⊙/yr | ||||
| 2318 | 53.07387680 | -27.72217050 | 3.43 | 0.00 | 0.004 | 1.00 | 0.1 | 10.54 | 0.04 |
| 2414 | 52.99881320 | -27.72097790 | 3.08 | 0.00 | 0.020 | 0.80 | 0.1 | 10.56 | 0.27 |
| 2454 | 53.06628720 | -27.72043590 | 3.35 | 0.00 | 0.020 | 0.80 | 0.1 | 10.28 | 0.14 |
| 3222 | 53.10302370 | -27.71234920 | 4.52 | 0.65 | 0.004 | 0.02 | 99.99 | 10.55 | 1.87E+03 |
| 5218 | 53.17444360 | -27.69261340 | 4.56 | 0.05 | 0.050 | 0.50 | 0.1 | 10.46 | 4.33 |
| 8124333The K-band image of this source is very faint so that TFIT likely has difficulty to measure reliable photometry for it. TFIT measures a negative flux with a large error bar. We carried out an aperture photometry with the aperture size of 1.0′′ and got a flux of 0.230.11 Jy. This is broadly consistent with the prediction of the best-fit SED (solid line in Fig. 12). We note that we did not include the K-band in the SED-fitting because of the negative TFIT flux. We also note that the marginal (1.3) detection of the source in K-band is somehow due to the lower sensitivity of the K-band image in this tile. The 5 limiting magnitude of this tile is 24.28 AB, while its 1 limiting magnitude is 26.03 AB. Our aperture photometry (0.23 Jy, namely 25.50 AB) is broadly consistent with an about 2 detection. | 53.14818030 | -27.71810980 | 4.81 | 0.00 | 0.050 | 0.50 | 0.1 | 10.21 | 2.44 |

The redshift distributions of galaxies in our final pVJL samples (solid lines) are shown in Figure 11. Comparison between samples with (solid lines) or without (dotted lines) the size criterion shows the efficiency of the additional size criterion on removing contamination from low redshift (z2.0). The redshift distribution of our final sample peaks around z2.5 regardless the applied S/N cut. This distribution is a little lower than our expectation (z3.0) but consistent with our previous analysis based on the color of stellar population synthetic models. As shown by the dotted line with squares in the left panel of Figure 1, the track of SSP galaxy with t=1.0 Gyr begins to enter our pVJL selection window at z2. Although the track stays in our pVJL selection window at higher redshift, the number density of PEGs is expected to decline with redshift. As a result, it is not surprising that the redshift distribution peaks at a point where the number density of galaxies is still high and the photometric uncertainty cannot easily scatter galaxies out of the selection window.
5.2 Passively Evolving Galaxies at z3?
Recently, PEGs are occasionally found at z3 (e.g., Mancini et al., 2009; Marchesini et al., 2010). These galaxies contain important information of when and how galaxies stopped their star formation activity. Their number density, or even their existence itself, can set strong constraints on current theories of galaxy formation and evolution. Six galaxies in our S/N5 sample are at z3. Although they do not enter our S/N20 sample because of the low S/N of their rest-frame optical photometry, it is still intriguing to study their physical properties and examine if they are real PEGs at z3.
Table 3 summarizes the best-fit parameters of the six high-z PEG candidates. The ages of five galaxies are significantly (at least five times) older than their characteristic star-formation time-scale (), suggesting that they have already passed their star-formation peaks and become quiescent. Only one galaxy (ID 3222) is fitted as a dusty star-burst galaxy with SFR 1000 M⊙/yr. Although the best-fit parameters support the passive natures of the majority of our candidates, the SED-fitting procedure, which only uses the rest-frame UV to NIR data, suffers from the age–dust degeneracy and is hence not capable of perfectly distinguishing dusty star-forming and old populations. If we assume that these galaxies are forming stars and that their red rest-frame UV colors are caused by dust obscuration rather than old stellar populations, their E(B-V)s and obscuration corrected SFRs measured from their rest-frame UV continuum slopes would be much higher than the SED-fitting derived values, with all E(B-V)s0.3 and SFR on average a few hundred times higher than the best SED-fitting values. Such high E(B-V)s and SFRs together suggest that these galaxies should have significant dust emission exists in longer wavelength (e.g., rest-frame IR and sub-mm), where dust emission dominates the radiative spectrum, if their dusty star-forming nature is true.
Figure 12 shows the best-fit stellar population SEDs (solid line) of the six galaxies. For comparison, we also plot templates of the SFGs (dotted line) retrieved from the templates of Chary & Elbaz (2001). The star-forming templates are not chosen by fitting to rest-frame UV and optical data to models. Instead, we calculate the obscured SFR (total SFR minus unobscured SFR) of these galaxies from their rest-frame UV continuum, assuming they are dusty SFGs. Then, for each galaxy, we convert the obscured SFR to the bolometric IR luminosity and choose the template whose bolometric IR luminosity best matches the luminosity of the galaxy. It is interesting to find from the plot that although we do not fit the templates to the rest-frame UV and optical data, the templates match the data fairly well (except Galaxy 3222). The best chosen template gives us an estimate of the fluxes from dust emission, which, if existing, can be observed by our current MIPS 24 m, GOODS-Herschel (PI Elbaz) 100 and 160 m, and AzTEC 1.1 mm observations (Scott et al., 2010).

At such high redshift, dust emission within the MIPS 24 m bandpass is still comparable to the stellar emission, as the stellar emission peak is just a little blueward of the MIPS bandpass. As seen from the plot, in four out of six galaxies, the MIPS 24 m fluxes cannot help distinguish old and dusty populations at all. In two galaxies (2414 and 2454), the observed 24 m fluxes lean toward the prediction of dust emission, however, the prediction of pure stellar emission is still within the 3 level of the observation and cannot be fully ruled out.
In principle, GOODS-Herschel and AzTEC data can be effective at distinguishing PEGs from dusty SFGs by sampling the blackbody radiation of cold dust. Unfortunately, the detection thresholds of these surveys are so high that the fluxes of dusty templates in Figure 12 are almost all under their 1 detection limits. Indeed, flux measurements of individual galaxies in the AzTEC image suffer from a very low S/N, , being comparable to the noise level. Due to the high detection thresholds, we cannot conclude that if the non-detections in the AzTEC image provide a tight constraint on the nature of our candidates. However, as shown in the figure, the predicted dust emission from three or four dusty star-forming templates is touching the 1 detection limit of these long-wavelength bands. We expect an at least a 2 detection in the stacked images if all our galaxies are dusty SFGs. In the stacked AzTEC image, we detect a signal with S/N=1.1 in the central pixels (with size of 3′′), still comparable to noise. Such low S/N in the stacked AzTEC image suggests that at least some of our candidates are not dusty SFGs but real PEGs at z3. It also rule out our suspicion that Galaxy 3233 has SFR over 1000 M⊙/yr, as its best SED-fitting shows in Table 3. Such huge SFR should have been easily detected in the AzTEC image.
We also use the Chandra deep 4Ms X-ray image of CDFS to examine if AGN host galaxies contaminate our PEG candidates at z3. None of our candidates is individually detected in the 4Ms Chandra catalog of Xue et al. (2011). The stacked images in both soft and hard bands show signals comparable to noises, with an S/N of 1.75 and 1.17, respectively. We conclude that our PEG candidates at z3 are not contaminated by AGN host galaxies.
We note that the two galaxies with the highest redshifts (5218 and 8124) have the largest SFRs. Their best-fit SFRs are comparable to that of our Milky Way, while their stellar masses are lower than that of Milky Way. The SSFR of these galaxies are higher than , the usual value used to distinguish SFGs and PEGs. We suspect that it is possible that although these galaxies have passed their peaks of star formation, their star formation activity has not yet been fully ceased. They could be in a transition stage from star forming to fully quiescent, since their rest-frame UV and optical light is already dominated by old stellar populations. At lower redshift (z3.5), galaxies all have SSFR less than , very well fit to the usual criterion of PEGs. We speculate that galaxies in the universe begin to transit from star forming to quiescent stages at z4.5 and become fully ceased PEGs at z3.5. However, the fact of increasing SFR with redshift could also be due to a selection effect of a flux-limited sample, because SFR increases with luminosity so that galaxies with higher SFRs can be observed out to higher redshift. Deep and large NIR band survey, such as CANDELS, is required to observe galaxies down to a fainter luminosity (hence lower SFR) level to provide a more accurate SED-fitting results to reveal the secret of when galaxies began to cease their star formation.
5.3 The Evolution of Integrated Stellar Mass Density of Passively Evolving Galaxies
The integrated stellar mass density (ISMD) of PEGs is a key parameter for understanding the formation and evolution of the galaxies. It quantifies how many stars have been locked in passive systems at a given cosmic epoch. Currently, most studies on the evolution of stellar mass function and stellar mass density focus on all (both star-forming and passively evolving) massive galaxies at z2 (e.g., Fontana et al., 2006; Marchesini et al., 2009, 2010). Only few works (Mancini et al., 2009; Ilbert et al., 2010; Brammer et al., 2011; Cassata et al., 2011) have been devoted to the study of the evolution of PEGs (or quiescent galaxies) only, partly due to the difficulty of identifying these galaxies at high redshift. However, the evolution of the passive population only is as important as that of all populations together, because it records when and how stars migrate from the star-forming population to passive population, which are critical for us to understand the physics that governs the ongoing and ceasing of star formation activity in the universe.
In this section, we estimate the ISMD at 2z3 using our clean pVJL samples. The precise measurement of the function should be obtained by integrating the stellar mass function, either the analytic Schechter form or the stepwise one. However, our small number samples (only 14 pVJLs even in the S/N5 sample) limit our ability to obtain an accurate measurement of the stellar mass function at 2z3. We leave such an accurate measurement to a forthcoming paper (Y. Guo et al. in prep.) that employs the advantage of the large survey area of the upcoming CANDELS. In this paper, instead, we simply carry out a shortcut measurement of the ISMD to its first-order accuracy.
We calculate the ISMD as follow:
| (5) |
where is the stellar mass, is the observed number of galaxies with stellar mass and redshift , and is the differential cosmic volume at . The lower and upper limits of the integral over are 2 and 3, while the lower limit of the integral over is . is a factor to correct the incompleteness caused by observation and selection for galaxies with and . As referred from Figure 11, the redshift distributions of our pVJL samples are very well peaked around z2.5 and have a narrow scatter. Therefore, it is safe to assume that is primarily dominated by and only has a weak relation on in our sample. We choose z=2.5 for calculation for all pVJLs. The uncertainty induced by such an assumption is less than that induced by the measurement of stellar mass of galaxies. Under this assumption, we place an SSP model with age of 1 Gyr and stellar mass at z=2.5 and perturb its V-, J- and L-band photometry using Gaussian random deviation with the variance set equal to a photometric error that is randomly drawn from the distribution of observed photometric uncertainties for a given magnitude of a given band in our multi-wavelength catalog. The perturbation is repeated 1000 times and for each time we justify whether the perturbed galaxy can be selected as a pVJL according to our criterion, Equation 2, and different S/N cuts. The factor is defined the reciprocal of the rate of successful selections.
The ISMD of our pVJLs at 2z3 is shown in Figure 13, together with measurements for lower redshift from other studies (Bell et al., 2003; Borch et al., 2006). We measure the ISMD for each of our three samples with different S/N cut and plot the mean and standard deviation of the three samples. As shown by the filled point with error bars at z2.5, the 1 deviation of the three samples is about 0.2 dex, comparable to the typical stellar mass uncertainty obtained through SED-fitting at such redshift. The small deviation also demonstrates that the incompleteness is fairly accurately estimated for our samples so that the ISMDs of samples with different mass limits that are induced by different S/N cuts are in very good agreement.

To further test the reliability of our measurement of the ISMD, we apply our method to galaxies that are selected from GOODS-S using the passively evolving criterion of the BzK method (pBzK; Daddi et al., 2004a). The redshift distribution of pBzKs peaks at z1.5, where a number of measurements of the ISMD (Ilbert et al., 2010; Saracco et al., 2010; Brammer et al., 2011; Cassata et al., 2011) can be used as references to test the accuracy of our measurement. For pBzKs, we choose an SSP model with age of 2 Gyr at z=1.5, perturb its B-, z- and K-band photometry according to photometric uncertainties, and calculate the ISMD with the same formula as we use for pVJLs. We also calculate the ISMD using three pBzK samples with different S/N thresholds at z- and K-bands (S/N5, 10, and 20). Thanks to the relatively large number of galaxies in each sample, the ISMD of different pBzK samples agree with each other better than that of different pVJL samples, with the standard deviation less than 0.1 dex.
Figure 13 illustrates the evolution of the ISMD of PEGs from
z3 to z=0. We compile measurements of several previous studies and compare
them with our results. In particular, we take the best-fit Schechter
parameters by Bell et al. (2003); Borch et al. (2006); Ilbert et al. (2010) and integrate their Schechter
functions down to mass limit . We also take the
ISMD listed in the tables of Saracco et al. (2010) and Brammer et al. (2011). The ISMD
of PEGs at 1.3z2.0 in HUDF measured by Daddi et al. (2005) and the
measurement from one of our companion paper (Cassata et al., 2011)
are also plotted. All adopted measurements are scaled to match our
Salpeter IMF with the following relations: (Salimbeni et al., 2009b) and (Marchesini et al., 2009). Salimbeni et al. (2009b) also
compared stellar masses measured with different stellar synthesis libraries,
i.e., BC03, CB09, and Maraston (2005, hereafter M05) and found the following
relations: at all redshift; at z1.5; and
at 1.5z4. We use these relations to scale stellar
masses in other works to CB09.
Our ISMD at z1.5 (pBzK) agrees well with that of quiescent galaxies of Ilbert et al. (2010), with difference less than 0.1 dex. However, our ISMD deviates from other studies at z1.5 by a few tenth dex. Cassata et al. (2011) constructed a fairly complete and clean sample by using not only SSFR but also morphology and MIPS 24 m flux. Their ISMD should suffer the least from incompleteness and contamination. However, their field, namely the ERS field, is occupied by an over-dense large-scale structure at z1.6 (Salimbeni et al., 2009a), which might boost the ISMD upward. Daddi et al. (2005) used only a small sample (six galaxies) over the 12.2 arcmin2 HUDF area so that their result may suffer from both small number statistics and large cosmic variance. The scheme of separating quiescent and dusty SFGs by two rest-frame colors of Brammer et al. (2011) may induce into their quiescent sample a fraction of dusty contamination, which could partly explain the largest ISMD at z1.5 measured by them. Despite the discrepancy, ISMDs at z1.5 measured by different authors scatter around the best fit of the evolution of ISMD of PEGs at 1z3 (solid line in the plot) within 0.3 dex, which is just slightly larger than the typical uncertainty of deriving stellar mass through SED-fitting at this redshift (0.2 dex). This suggests that the uncertainty of stellar mass is the dominant source of ISMD uncertainty, and that our simplified incompleteness correction is accurate to the first order.
Only our work and Brammer et al. (2011) measure the ISMD of PEGs at z2.5. The ISMD of Brammer et al. (2011) is 0.2 dex lower than that of ours, again within the typical uncertainty of stellar mass. Besides the stellar mass uncertainty, the discrepancy could also be due to the fact that Brammer et al. (2011) only integrate their stellar mass function at z2.0 down to , whereas the stellar mass function of PEGs is dominated by galaxies around , typically (Ilbert et al., 2010; Peng et al., 2010).
We even extend our measurement to z3, where we only have a few PEG candidates though. We measure the ISMD for three candidates at 3z3.5 using an SSP model of 1 Gyr at z=3.3 and the ISMD for the other three candidates at z4 using an SSP model of 0.5 Gyr at z=4.5. Since there might be contamination of dusty SFGs among our candidates (as discussed in §5.2), the ISMDs at z3 can be only treated as an upper limit. The upper limit of ISMD at z3 was also measured by Mancini et al. (2009), who found 21 z3.5 quiescent candidates which are selected at IRAC 4.5 m channel but have no MIPS 24 m detection in GOODS-N. As argued by them as well as indicated by Figure 12, the lack of 24 m emission is a necessary but insufficient condition for determining a galaxy to be quiescent. Our upper limit of ISDM at z3 is about 0.3 dex lower than that of theirs (also shown in Figure 13), but still within the error bars of their upper limit. In this sense, the two measurements are not inconsistent.
5.4 Stellar Mass Locked in Passively Evolving Galaxies

The evolution of ISMD of PEGs can be easily converted into the evolution of fraction of stellar mass in PEGs, if an underlying global stellar mass density (GSMD) is measured for all types of galaxies. We obtain such a measurement by fitting a linear relation to the evolution of GSMD (log(GSMD) versus redshift) of Figure 12 of Marchesini et al. (2009), which compiles measurements of GSMD from several previous studies. We then divide the ISMD of PEGs by the GSMD at a given redshift to obtain the fraction of stellar mass in PEGs.
The evolution of the mass fraction is shown in Figure 14. At z3, the mass fraction of PEGs is less than 5%. This fraction then increases from 5% to about 40% from z=3 to z=1. However, there is large discrepancy among measurements of the fraction at z2, from 5% of our study and Ilbert et al. (2010) to 25% of Brammer et al. (2011). The reason of such large discrepancy, as discussed above in the measurement of ISMD, is complicated, possibly due to sample selection, stellar mass density measurement method, and/or cosmic variance. A more accurate measure is needed in future to constrain this fraction and hence the mechanisms that are responsible for quenching the star formation activity during the peak of the cosmic SFRD. It should also be noted that there is about 0.2 dex deviation for the GSMD at z2 measured by different authors (see Figure 12 of Marchesini et al. (2009)). Therefore the accurate measurement of stellar mass fraction in PEGs requires an improvement on measuring the stellar mass densities of both PEGs and all types of galaxies. Our work does not provide measurement on the mass fraction at z1, but we still plot the measurements of other authors for readers to obtain a sight of the evolution trend in lower redshift.
5.5 Discussion
The evolution of ISMD of PEGs can be schematically divided into three stages, as indicated by the vertical dashed lines in Figure 14. The physical mechanisms that govern the formation and evolution of PEGs in each stage may be different.
The first stage (z3) could be called as the formation (or present) stage. The existence of PEGs in the stage is still controversial (Mancini et al., 2009; Marchesini et al., 2010). In our study, we find six candidates at z3. Individual and stack analysis of the sub-mm AzTEC images show that at least some of them could be really passive. We cannot, however, draw a firm conclusion on which one is real passive. If we treat the ISMD that we measured at z3 as an upper limit, the ISMD grows by a factor of 10, or even larger in 1 Gyr from z4 to z2.5. The existence of PEGs of age of 1 Gyr at z3.5 suggests that these galaxies begin to form their stars at z5 or 6. Due to the small sample and limited information, we cannot discuss the formation mechanism of these galaxies. Future studies in the following two aspects would shed a light on this question: (1) confirming or excluding the passive properties of our candidates by using other facilities and (2) exploiting larger and deeper NIR survey (e.g., CANDELS) to construct a large sample with a good statistics.
The second stage (1z3) is the rapid growth stage, during which the ISMD of PEGs grows by a factor of 10 in 3.5 Gyr. Stars are extensively formed in or migrated into passive systems in this period. This stage is coincident with the broad peak of the cosmic SFRD (e.g., Hopkins, 2004; Hopkins & Beacom, 2006; Pérez-González et al., 2008; Chary & Pope, 2010), suggesting that the formation of stars and the migration of stars from star-forming systems to passive systems are happening simultaneously during this epoch. Cassata et al. (2011) studied the size distribution of PEGs during this stage and found 80% of PEGs at z1.5 are compact. The mechanisms that are responsible for the rapid mass growth of PEGs (e.g., gas-rich major merger, collapse of unstable disks and monolithic collapse) also tend to produce passive remnants that are compact and small with respect to local early-type galaxies.
The third stage (z1) is the slow growth stage, during which the ISMD only increases by a factor of 3 in 7 Gyr. This suggests that the majority of PEGs has already been formed before this stage. This stage happens when the cosmic SFRD begins to rapidly decline from its peak (e.g., Hopkins, 2004; Hopkins & Beacom, 2006; Pérez-González et al., 2008; Chary & Pope, 2010), indicating that newly formed stars may not be enough for explaining the steady growth of the passive systems from z=1 to z=0. It requires stars that already formed in other systems to migrate into the passive systems. A joint analysis of stellar mass density, number density, and size distribution of PEGs in this stage by Cassata et al. (2011) found that the number density increases by a factor of 1.5 from z=1 to z=0.5, while the ISMD keeps almost constant at the same time. And the average size of PEGs increases by a factor of about 2.5 in the same epoch. These findings imply that the mechanisms that increase PEGs’ sizes during this redshift range would not significantly increase their stellar masses, most likely being minor merges and slow accretion (Hopkins et al., 2008; van Dokkum et al., 2010). Also, the newly formed PEGs that increase the number density at this time would have small stellar masses and larger sizes than those formed at z1, indicating a different formation mechanism.
6 Summary and Conclusions
In this paper, we introduce a new method of selecting both SFGs and PEGs at using rest-frame UV-optical (V-J versus J-L) colors. We apply our VJL criteria to select galaxies in the WFC3 ERS field and study the physical properties of the selected galaxies. We also discuss the implications of our selected galaxies on galaxy formation and evolution, especially the contribution of dusty SFGs to the cosmic SFRD at z3 and the evolution of ISMD of PEGs. The paper is summarized below.
Our VJL criteria are thoroughly tested with theoretical stellar population synthesis models and real galaxies with spectroscopic redshifts. The tests show that our criteria for SFGs (Equation 1, sVJL) is able to select galaxies with constant or exponentially declining SFH independently of their dust reddening. Our criteria for PEGs (Equation 2, pVJL) can select galaxies with properties similar to SSP models around z2.5 and above. The tests also show that, however, (1) the main source of contamination in our sVJL sample is the SFGs at z2 and z3.5 and (2) contamination in our pVJL sample is mainly from dusty SFGs at z2.
We apply our sVJL criterion to the WFC3 ERS field to select 354 and 146 galaxies with J- and L-band S/N cuts greater than 10 and 20. The redshift distribution of our sVJL sample peaks at z2.7. However, it also has a secondary peak around z1.8. This secondary peak is induced by the color uncertainty, as the power of the secondary peak decreases with the increase of the S/N threshold.
We compare our sVJLs with Lyman break galaxies at z3 (U-band dropouts), assuming that the slight difference in the peak redshifts ( for sVJLs and for U-band dropouts) would not result in any significant difference of properties of the two samples. In the ERS field, 39% of U-band dropouts are outside our sVJL selection window. Among the outsiders, 63% of them have redshift greater than 3.2, where our sVJL selection ability drops sharply.
Unlike the Lyman break technique, our sVJL method can select galaxies whose (J-L) color redder than 2.0, which implies high dust extinction in these galaxies. The measurement of E(B-V)s from the rest-frame UV continuum shows that U-band dropouts all have E(B-V)0.4, while the distribution of E(B-V)s of sVJLs extended to E(B-V)1.0.
We evaluate the fraction of contamination from old galaxies in our sample of dusty SFGs (E(B-V)0.3) by comparing their observed 24 m fluxes to that predicted by an SSP model. We find that 18% of our galaxies have 24 m fluxes that match the prediction of pure stellar emission. The low fraction of contamination indicates that our sVJL method is effective at selecting dusty galaxies around z3.
The dusty (E(B-V)0.4) galaxies selected by sVJLs reside in the massive end ()of the mass distribution of sVJLs. Although they only counts for 20% of the number density in the mass bin , they contribute about half of the star formation in this mass range. In the low-mass end , sVJLs and LBGs have no obvious difference on their color, E(B-V), and SFR.
We also apply our criteria to the WFC3 ERS field to select PEGs at z3. Through a similar comparison between the observed and predicted MIPS 24 m fluxes, however, we find that our pVJL samples are heavily contaminated by dusty SFGs. An additional condition is needed to clean the samples. Inspired by the fact that the majority of PEGs at z2 is compact, we require galaxies to have a small radius (J-band Kron radius less than 1.0′′) to enter our pVJL sample. This extra criterion is proved to be able to effectively separate passive and dusty galaxies in our samples.
The redshift distribution of our clean pVJL samples peaks at z2.5 and extends to z3, and even to z4 when low S/N cuts are employed. We carry out case studies to examine the physical properties of our PEG candidates at z3. Most of these galaxies have very low SFRs derived through SED-fitting but high SFRs derived from their rest-frame UV continuum. We try to use observations at longer wavelengths (MIPS, Herschel and AzTEC) to break the age–dust degeneracy and understand the nature of these galaxies. Unfortunately, the detection limits of these long-wavelength observations are too high to help achieve a firm conclusion. However, we find no significant detection even in the stacked image of AzTEC, suggesting that some our candidates are real PEGs at z3. We speculate that galaxies with very low SFR, possibly a transition stage from star-forming to passive, begin to exist at z4 and PEGs begin to exist at z3.
We estimate the ISMD of PEGs at z2.5 by using our clean pVJL sample. We evaluate the incompleteness of observation and selection in a simplified way, which is proved to be accurate to the first order by comparing our results with other studies as well as by comparing results of samples with different S/N cuts. We also extend our measurement to z3 and obtain a constraint on the ISMD at z3. Combining this with low-redshift observations from previous studies, we find that the evolution of the ISMD can be divided into three stages: (1) formation stage (z3), when PEGs begin to form and their ISMD grows by at least a factor of 10 in 1 Gyr; (2) rapid growth stage (1z), when the ISMD of PEGs grows by another factor of 10 in 3.5 Gyr; and (3) slow growth stage (z1), when the ISMD of PEGs grows by a factor of 3 in 7 Gyr. We discuss the possible mechanisms that drive the growth in each stage.
We conclude that our new color selection criteria are effective at selecting SFGs independent of dust reddening as well as PEGs at z3. This method is less model-dependent and easier to reproduce than methods based on SED-fitting so that it can be quickly applied to upcoming large optical and NIR surveys, such as CANDELS, where large samples obtained through wide survey areas would set stronger constraints and shed new light on our understanding of galaxy formation and evolution.
We thank Danilo Marchesini for useful discussions. We thank the anonymous referee for constructive comments that improve this article. Y.G., M.G., P.C., C.W., and S.S. acknowledge support from NASA grant HST-GO-12060, from STScI, which is operated by AURA, Inc., under NASA contract NAS5-2655. ET acknowledges support from contract ASI-INAF I/023/05/0 and from PD51 INFN grant. The work presented here is partly based on observations obtained with WIRCam, a joint project of Canada–France–Hawaii Telescope (CFHT), Taiwan, Korea, Canada, France, at the CFHT which is operated by the National Research Council (NRC) of Canada, the Institute National des Sciences de l’Univers of the Centre National de la Recherche Scientifique of France, and the University of Hawaii.
References
- Adelberger et al. (2004) Adelberger, K. L., Steidel, C. C., Shapley, A. E., Hunt, M. P., Erb, D. K., Reddy, N. A., & Pettini, M. 2004, ApJ, 607, 226
- Bell et al. (2003) Bell, E. F., McIntosh, D. H., Katz, N., & Weinberg, M. D. 2003, ApJS, 149, 289
- Bell et al. (2004) Bell, E. F., Wolf, C., Meisenheimer, K., Rix, H.-W., Borch, A., Dye, S., Kleinheinrich, M., Wisotzki, L., & McIntosh, D. H. 2004, ApJ, 608, 752
- Benson et al. (2003) Benson, A. J., Bower, R. G., Frenk, C. S., Lacey, C. G., Baugh, C. M., & Cole, S. 2003, ApJ, 599, 38
- Blain et al. (2002) Blain, A. W., Smail, I., Ivison, R. J., Kneib, J.-P., & Frayer, D. T. 2002, Phys. Rep., 369, 111
- Blanc et al. (2008) Blanc, G. A., Lira, P., Barrientos, L. F., Aguirre, P., Francke, H., Taylor, E. N., Quadri, R., Marchesini, D., Infante, L., Gawiser, E., Hall, P. B., Willis, J. P., Herrera, D., & Maza, J. 2008, ApJ, 681, 1099
- Blanton et al. (2001) Blanton, M. R., Dalcanton, J., Eisenstein, D., Loveday, J., Strauss, M. A., SubbaRao, M., Weinberg, D. H., Anderson, Jr., J. E., Annis, J., Bahcall, N. A., Bernardi, M., Brinkmann, J., Brunner, R. J., Burles, S., Carey, L., Castander, F. J., Connolly, A. J., Csabai, I., Doi, M., Finkbeiner, D., Friedman, S., Frieman, J. A., Fukugita, M., Gunn, J. E., Hennessy, G. S., Hindsley, R. B., Hogg, D. W., Ichikawa, T., Ivezić, Ž., Kent, S., Knapp, G. R., Lamb, D. Q., Leger, R. F., Long, D. C., Lupton, R. H., McKay, T. A., Meiksin, A., Merelli, A., Munn, J. A., Narayanan, V., Newcomb, M., Nichol, R. C., Okamura, S., Owen, R., Pier, J. R., Pope, A., Postman, M., Quinn, T., Rockosi, C. M., Schlegel, D. J., Schneider, D. P., Shimasaku, K., Siegmund, W. A., Smee, S., Snir, Y., Stoughton, C., Stubbs, C., Szalay, A. S., Szokoly, G. P., Thakar, A. R., Tremonti, C., Tucker, D. L., Uomoto, A., Vanden Berk, D., Vogeley, M. S., Waddell, P., Yanny, B., Yasuda, N., & York, D. G. 2001, AJ, 121, 2358
- Blanton et al. (2005) Blanton, M. R., Eisenstein, D., Hogg, D. W., Schlegel, D. J., & Brinkmann, J. 2005, ApJ, 629, 143
- Blanton et al. (2003) Blanton, M. R., Hogg, D. W., Bahcall, N. A., Brinkmann, J., Britton, M., Connolly, A. J., Csabai, I., Fukugita, M., Loveday, J., Meiksin, A., Munn, J. A., Nichol, R. C., Okamura, S., Quinn, T., Schneider, D. P., Shimasaku, K., Strauss, M. A., Tegmark, M., Vogeley, M. S., & Weinberg, D. H. 2003, ApJ, 592, 819
- Borch et al. (2006) Borch, A., Meisenheimer, K., Bell, E. F., Rix, H.-W., Wolf, C., Dye, S., Kleinheinrich, M., Kovacs, Z., & Wisotzki, L. 2006, A&A, 453, 869
- Bouwens et al. (2009) Bouwens, R. J., Illingworth, G. D., Franx, M., Chary, R.-R., Meurer, G. R., Conselice, C. J., Ford, H., Giavalisco, M., & van Dokkum, P. 2009, ApJ, 705, 936
- Bower et al. (2006) Bower, R. G., Benson, A. J., Malbon, R., Helly, J. C., Frenk, C. S., Baugh, C. M., Cole, S., & Lacey, C. G. 2006, MNRAS, 370, 645
- Brammer et al. (2011) Brammer, G. B., Whitaker, K. E., van Dokkum, P. G., Marchesini, D., Franx, M., Kriek, M., Labbé, I., Lee, K.-S., Muzzin, A., Quadri, R. F., Rudnick, G., & Williams, R. 2011, ApJ, 739, 24
- Bruzual & Charlot (2003) Bruzual, G., & Charlot, S. 2003, MNRAS, 344, 1000
- Calzetti et al. (2000) Calzetti, D., Armus, L., Bohlin, R. C., Kinney, A. L., Koornneef, J., & Storchi-Bergmann, T. 2000, ApJ, 533, 682
- Calzetti et al. (1994) Calzetti, D., Kinney, A. L., & Storchi-Bergmann, T. 1994, ApJ, 429, 582
- Calzetti et al. (1997) Calzetti, D., Meurer, G. R., Bohlin, R. C., Garnett, D. R., Kinney, A. L., Leitherer, C., & Storchi-Bergmann, T. 1997, AJ, 114, 1834
- Cameron et al. (2011) Cameron, E., Carollo, C. M., Oesch, P. A., Bouwens, R. J., Illingworth, G. D., Trenti, M., Labbé, I., & Magee, D. 2011, ApJ, 743, 146
- Cassata et al. (2011) Cassata, P., Giavalisco, M., Guo, Y., Renzini, A., Ferguson, H., Koekemoer, A. M., Salimbeni, S., Scarlata, C., Grogin, N. A., Conselice, C. J., Dahlen, T., Lotz, J. M., Dickinson, M., & Lin, L. 2011, ApJ, 743, 96
- Chapman et al. (2003) Chapman, S. C., Blain, A. W., Ivison, R. J., & Smail, I. R. 2003, Nature, 422, 695
- Chapman et al. (2005) Chapman, S. C., Blain, A. W., Smail, I., & Ivison, R. J. 2005, ApJ, 622, 772
- Chary & Elbaz (2001) Chary, R., & Elbaz, D. 2001, ApJ, 556, 562
- Chary & Pope (2010) Chary, R.-R., & Pope, A. 2010, ArXiv e-prints, 1003.1731
- Cimatti et al. (2003) Cimatti, A., Daddi, E., Cassata, P., Pignatelli, E., Fasano, G., Vernet, J., Fomalont, E., Kellermann, K., Zamorani, G., Mignoli, M., Pozzetti, L., Renzini, A., di Serego Alighieri, S., Franceschini, A., Giallongo, E., & Fontana, A. 2003, A&A, 412, L1
- Cimatti et al. (2002) Cimatti, A., Daddi, E., Mignoli, M., Pozzetti, L., Renzini, A., Zamorani, G., Broadhurst, T., Fontana, A., Saracco, P., Poli, F., Cristiani, S., D’Odorico, S., Giallongo, E., Gilmozzi, R., & Menci, N. 2002, A&A, 381, L68
- Civano et al. (2011) Civano, F., Brusa, M., Comastri, A., Elvis, M., Salvato, M., Zamorani, G., Capak, P., Fiore, F., Gilli, R., Hao, H., Ikeda, H., Kakazu, Y., Kartaltepe, J. S., Masters, D., Miyaji, T., Mignoli, M., Puccetti, S., Shankar, F., Silverman, J., Vignali, C., Zezas, A., & Koekemoer, A. M. 2011, ApJ, 741, 91
- Conselice et al. (2004) Conselice, C. J., Grogin, N. A., Jogee, S., Lucas, R. A., Dahlen, T., de Mello, D., Gardner, J. P., Mobasher, B., & Ravindranath, S. 2004, ApJ, 600, L139
- Croton et al. (2006) Croton, D. J., Springel, V., White, S. D. M., De Lucia, G., Frenk, C. S., Gao, L., Jenkins, A., Kauffmann, G., Navarro, J. F., & Yoshida, N. 2006, MNRAS, 365, 11
- Daddi et al. (2007a) Daddi, E., Alexander, D. M., Dickinson, M., Gilli, R., Renzini, A., Elbaz, D., Cimatti, A., Chary, R., Frayer, D., Bauer, F. E., Brandt, W. N., Giavalisco, M., Grogin, N. A., Huynh, M., Kurk, J., Mignoli, M., Morrison, G., Pope, A., & Ravindranath, S. 2007a, ApJ, 670, 173
- Daddi et al. (2000) Daddi, E., Cimatti, A., Pozzetti, L., Hoekstra, H., Röttgering, H. J. A., Renzini, A., Zamorani, G., & Mannucci, F. 2000, A&A, 361, 535
- Daddi et al. (2004a) Daddi, E., Cimatti, A., Renzini, A., Fontana, A., Mignoli, M., Pozzetti, L., Tozzi, P., & Zamorani, G. 2004a, ApJ, 617, 746
- Daddi et al. (2004b) Daddi, E., Cimatti, A., Renzini, A., Vernet, J., Conselice, C., Pozzetti, L., Mignoli, M., Tozzi, P., Broadhurst, T., di Serego Alighieri, S., Fontana, A., Nonino, M., Rosati, P., & Zamorani, G. 2004b, ApJ, 600, L127
- Daddi et al. (2007b) Daddi, E., Dickinson, M., Morrison, G., Chary, R., Cimatti, A., Elbaz, D., Frayer, D., Renzini, A., Pope, A., Alexander, D. M., Bauer, F. E., Giavalisco, M., Huynh, M., Kurk, J., & Mignoli, M. 2007b, ApJ, 670, 156
- Daddi et al. (2005) Daddi, E., Renzini, A., Pirzkal, N., Cimatti, A., Malhotra, S., Stiavelli, M., Xu, C., Pasquali, A., Rhoads, J. E., Brusa, M., di Serego Alighieri, S., Ferguson, H. C., Koekemoer, A. M., Moustakas, L. A., Panagia, N., & Windhorst, R. A. 2005, ApJ, 626, 680
- Dahlen et al. (2010) Dahlen, T., Mobasher, B., Dickinson, M., Ferguson, H. C., Giavalisco, M., Grogin, N. A., Guo, Y., Koekemoer, A., Lee, K.-S., Lee, S.-K., Nonino, M., Riess, A. G., & Salimbeni, S. 2010, ApJ, 724, 425
- De Lucia et al. (2006) De Lucia, G., Springel, V., White, S. D. M., Croton, D., & Kauffmann, G. 2006, MNRAS, 366, 499
- Dunlop et al. (2007) Dunlop, J. S., Cirasuolo, M., & McLure, R. J. 2007, MNRAS, 376, 1054
- Fioc & Rocca-Volmerange (1997) Fioc, M., & Rocca-Volmerange, B. 1997, A&A, 326, 950
- Fontana et al. (2004) Fontana, A., Pozzetti, L., Donnarumma, I., Renzini, A., Cimatti, A., Zamorani, G., Menci, N., Daddi, E., Giallongo, E., Mignoli, M., Perna, C., Salimbeni, S., Saracco, P., Broadhurst, T., Cristiani, S., D’Odorico, S., & Gilmozzi, R. 2004, A&A, 424, 23
- Fontana et al. (2006) Fontana, A., Salimbeni, S., Grazian, A., Giallongo, E., Pentericci, L., Nonino, M., Fontanot, F., Menci, N., Monaco, P., Cristiani, S., Vanzella, E., de Santis, C., & Gallozzi, S. 2006, A&A, 459, 745
- Förster Schreiber et al. (2004) Förster Schreiber, N. M., van Dokkum, P. G., Franx, M., Labbé, I., Rudnick, G., Daddi, E., Illingworth, G. D., Kriek, M., Moorwood, A. F. M., Rix, H.-W., Röttgering, H., Trujillo, I., van der Werf, P., van Starkenburg, L., & Wuyts, S. 2004, ApJ, 616, 40
- Franx et al. (2003) Franx, M., Labbé, I., Rudnick, G., van Dokkum, P. G., Daddi, E., Förster Schreiber, N. M., Moorwood, A., Rix, H.-W., Röttgering, H., van de Wel, A., van der Werf, P., & van Starkenburg, L. 2003, ApJ, 587, L79
- Giavalisco (2002) Giavalisco, M. 2002, ARA&A, 40, 579
- Giavalisco et al. (2004) Giavalisco, M., Dickinson, M., Ferguson, H. C., Ravindranath, S., Kretchmer, C., Moustakas, L. A., Madau, P., Fall, S. M., Gardner, J. P., Livio, M., Papovich, C., Renzini, A., Spinrad, H., Stern, D., & Riess, A. 2004, ApJ, 600, L103
- Giavalisco et al. (1996) Giavalisco, M., Steidel, C. C., & Macchetto, F. D. 1996, ApJ, 470, 189
- Glazebrook et al. (2004) Glazebrook, K., Abraham, R. G., McCarthy, P. J., Savaglio, S., Chen, H.-W., Crampton, D., Murowinski, R., Jørgensen, I., Roth, K., Hook, I., Marzke, R. O., & Carlberg, R. G. 2004, Nature, 430, 181
- Grazian et al. (2007) Grazian, A., Salimbeni, S., Pentericci, L., Fontana, A., Nonino, M., Vanzella, E., Cristiani, S., de Santis, C., Gallozzi, S., Giallongo, E., & Santini, P. 2007, A&A, 465, 393
- Grogin et al. (2011) Grogin, N. A., Kocevski, D. D., Faber, S. M., Ferguson, H. C., Koekemoer, A. M., Riess, A. G., Acquaviva, V., Alexander, D. M., Almaini, O., Ashby, M. L. N., Barden, M., Bell, E. F., Bournaud, F., Brown, T. M., Caputi, K. I., Casertano, S., Cassata, P., Castellano, M., Challis, P., Chary, R.-R., Cheung, E., Cirasuolo, M., Conselice, C. J., Roshan Cooray, A., Croton, D. J., Daddi, E., Dahlen, T., Davé, R., de Mello, D. F., Dekel, A., Dickinson, M., Dolch, T., Donley, J. L., Dunlop, J. S., Dutton, A. A., Elbaz, D., Fazio, G. G., Filippenko, A. V., Finkelstein, S. L., Fontana, A., Gardner, J. P., Garnavich, P. M., Gawiser, E., Giavalisco, M., Grazian, A., Guo, Y., Hathi, N. P., Häussler, B., Hopkins, P. F., Huang, J.-S., Huang, K.-H., Jha, S. W., Kartaltepe, J. S., Kirshner, R. P., Koo, D. C., Lai, K., Lee, K.-S., Li, W., Lotz, J. M., Lucas, R. A., Madau, P., McCarthy, P. J., McGrath, E. J., McIntosh, D. H., McLure, R. J., Mobasher, B., Moustakas, L. A., Mozena, M., Nandra, K., Newman, J. A., Niemi, S.-M., Noeske, K. G., Papovich, C. J., Pentericci, L., Pope, A., Primack, J. R., Rajan, A., Ravindranath, S., Reddy, N. A., Renzini, A., Rix, H.-W., Robaina, A. R., Rodney, S. A., Rosario, D. J., Rosati, P., Salimbeni, S., Scarlata, C., Siana, B., Simard, L., Smidt, J., Somerville, R. S., Spinrad, H., Straughn, A. N., Strolger, L.-G., Telford, O., Teplitz, H. I., Trump, J. R., van der Wel, A., Villforth, C., Wechsler, R. H., Weiner, B. J., Wiklind, T., Wild, V., Wilson, G., Wuyts, S., Yan, H.-J., & Yun, M. S. 2011, ApJS, 197, 35
- Hopkins (2004) Hopkins, A. M. 2004, ApJ, 615, 209
- Hopkins & Beacom (2006) Hopkins, A. M., & Beacom, J. F. 2006, ApJ, 651, 142
- Hopkins et al. (2008) Hopkins, P. F., Cox, T. J., Kereš, D., & Hernquist, L. 2008, ApJS, 175, 390
- Ilbert et al. (2009) Ilbert, O., Capak, P., Salvato, M., Aussel, H., McCracken, H. J., Sanders, D. B., Scoville, N., Kartaltepe, J., Arnouts, S., Le Floc’h, E., Mobasher, B., Taniguchi, Y., Lamareille, F., Leauthaud, A., Sasaki, S., Thompson, D., Zamojski, M., Zamorani, G., Bardelli, S., Bolzonella, M., Bongiorno, A., Brusa, M., Caputi, K. I., Carollo, C. M., Contini, T., Cook, R., Coppa, G., Cucciati, O., de la Torre, S., de Ravel, L., Franzetti, P., Garilli, B., Hasinger, G., Iovino, A., Kampczyk, P., Kneib, J.-P., Knobel, C., Kovac, K., Le Borgne, J. F., Le Brun, V., Fèvre, O. L., Lilly, S., Looper, D., Maier, C., Mainieri, V., Mellier, Y., Mignoli, M., Murayama, T., Pellò, R., Peng, Y., Pérez-Montero, E., Renzini, A., Ricciardelli, E., Schiminovich, D., Scodeggio, M., Shioya, Y., Silverman, J., Surace, J., Tanaka, M., Tasca, L., Tresse, L., Vergani, D., & Zucca, E. 2009, ApJ, 690, 1236
- Ilbert et al. (2010) Ilbert, O., Salvato, M., Le Floc’h, E., Aussel, H., Capak, P., McCracken, H. J., Mobasher, B., Kartaltepe, J., Scoville, N., Sanders, D. B., Arnouts, S., Bundy, K., Cassata, P., Kneib, J.-P., Koekemoer, A., Le Fèvre, O., Lilly, S., Surace, J., Taniguchi, Y., Tasca, L., Thompson, D., Tresse, L., Zamojski, M., Zamorani, G., & Zucca, E. 2010, ApJ, 709, 644
- Kauffmann et al. (2003) Kauffmann, G., Heckman, T. M., White, S. D. M., Charlot, S., Tremonti, C., Peng, E. W., Seibert, M., Brinkmann, J., Nichol, R. C., SubbaRao, M., & York, D. 2003, MNRAS, 341, 54
- Kennicutt (1998) Kennicutt, Jr., R. C. 1998, ARA&A, 36, 189
- Koekemoer et al. (2011) Koekemoer, A. M., Faber, S. M., Ferguson, H. C., Grogin, N. A., Kocevski, D. D., Koo, D. C., Lai, K., Lotz, J. M., Lucas, R. A., McGrath, E. J., Ogaz, S., Rajan, A., Riess, A. G., Rodney, S. A., Strolger, L., Casertano, S., Castellano, M., Dahlen, T., Dickinson, M., Dolch, T., Fontana, A., Giavalisco, M., Grazian, A., Guo, Y., Hathi, N. P., Huang, K.-H., van der Wel, A., Yan, H.-J., Acquaviva, V., Alexander, D. M., Almaini, O., Ashby, M. L. N., Barden, M., Bell, E. F., Bournaud, F., Brown, T. M., Caputi, K. I., Cassata, P., Challis, P. J., Chary, R.-R., Cheung, E., Cirasuolo, M., Conselice, C. J., Roshan Cooray, A., Croton, D. J., Daddi, E., Davé, R., de Mello, D. F., de Ravel, L., Dekel, A., Donley, J. L., Dunlop, J. S., Dutton, A. A., Elbaz, D., Fazio, G. G., Filippenko, A. V., Finkelstein, S. L., Frazer, C., Gardner, J. P., Garnavich, P. M., Gawiser, E., Gruetzbauch, R., Hartley, W. G., Häussler, B., Herrington, J., Hopkins, P. F., Huang, J.-S., Jha, S. W., Johnson, A., Kartaltepe, J. S., Khostovan, A. A., Kirshner, R. P., Lani, C., Lee, K.-S., Li, W., Madau, P., McCarthy, P. J., McIntosh, D. H., McLure, R. J., McPartland, C., Mobasher, B., Moreira, H., Mortlock, A., Moustakas, L. A., Mozena, M., Nandra, K., Newman, J. A., Nielsen, J. L., Niemi, S., Noeske, K. G., Papovich, C. J., Pentericci, L., Pope, A., Primack, J. R., Ravindranath, S., Reddy, N. A., Renzini, A., Rix, H.-W., Robaina, A. R., Rosario, D. J., Rosati, P., Salimbeni, S., Scarlata, C., Siana, B., Simard, L., Smidt, J., Snyder, D., Somerville, R. S., Spinrad, H., Straughn, A. N., Telford, O., Teplitz, H. I., Trump, J. R., Vargas, C., Villforth, C., Wagner, C. R., Wandro, P., Wechsler, R. H., Weiner, B. J., Wiklind, T., Wild, V., Wilson, G., Wuyts, S., & Yun, M. S. 2011, ApJS, 197, 36
- Kong et al. (2006) Kong, X., Daddi, E., Arimoto, N., Renzini, A., Broadhurst, T., Cimatti, A., Ikuta, C., Ohta, K., da Costa, L., Olsen, L. F., Onodera, M., & Tamura, N. 2006, ApJ, 638, 72
- Laidler et al. (2007) Laidler, V. G., Papovich, C., Grogin, N. A., Idzi, R., Dickinson, M., Ferguson, H. C., Hilbert, B., Clubb, K., & Ravindranath, S. 2007, PASP, 119, 1325
- Lane et al. (2007) Lane, K. P., Almaini, O., Foucaud, S., Simpson, C., Smail, I., McLure, R. J., Conselice, C. J., Cirasuolo, M., Page, M. J., Dunlop, J. S., Hirst, P., Watson, M. G., & Sekiguchi, K. 2007, MNRAS, 379, L25
- Lee et al. (2010) Lee, S., Ferguson, H. C., Somerville, R. S., Wiklind, T., & Giavalisco, M. 2010, ApJ, 725, 1644
- Lejeune et al. (1997) Lejeune, T., Cuisinier, F., & Buser, R. 1997, A&AS, 125, 229
- Lin et al. (2011) Lin, L., Dickinson, M., Jian, H.-Y., Merson, A. I., Baugh, C. M., Scott, D., Foucaud, S., Wang, W.-H., Yan, C.-H., Yan, H.-J., Cheng, Y.-W., Guo, Y., Helly, J., Kirsten, F., Koo, D. C., Lagos, C. d. P., Meger, N., Pope, A., Simard, L., Grogin, N. A., Messias, H., & Wang, S.-Y. 2011, ArXiv e-prints, 1111.2135
- Ly et al. (2011) Ly, C., Malkan, M. A., Hayashi, M., Motohara, K., Kashikawa, N., Shimasaku, K., Nagao, T., & Grady, C. 2011, ApJ, 735, 91
- Madau (1995) Madau, P. 1995, ApJ, 441, 18
- Magnelli et al. (2011) Magnelli, B., Elbaz, D., Chary, R. R., Dickinson, M., Le Borgne, D., Frayer, D. T., & Willmer, C. N. A. 2011, A&A, 528, A35+
- Mancini et al. (2009) Mancini, C., Matute, I., Cimatti, A., Daddi, E., Dickinson, M., Rodighiero, G., Bolzonella, M., & Pozzetti, L. 2009, A&A, 500, 705
- Maraston (2005) Maraston, C. 2005, MNRAS, 362, 799
- Maraston et al. (2010) Maraston, C., Pforr, J., Renzini, A., Daddi, E., Dickinson, M., Cimatti, A., & Tonini, C. 2010, MNRAS, 407, 830
- Marchesini et al. (2009) Marchesini, D., van Dokkum, P. G., Förster Schreiber, N. M., Franx, M., Labbé, I., & Wuyts, S. 2009, ApJ, 701, 1765
- Marchesini et al. (2010) Marchesini, D., Whitaker, K. E., Brammer, G., van Dokkum, P. G., Labbé, I., Muzzin, A., Quadri, R. F., Kriek, M., Lee, K.-S., Rudnick, G., Franx, M., Illingworth, G. D., & Wake, D. 2010, ApJ, 725, 1277
- McCarthy (2004) McCarthy, P. J. 2004, ARA&A, 42, 477
- Mobasher et al. (2005) Mobasher, B., Dickinson, M., Ferguson, H. C., Giavalisco, M., Wiklind, T., Stark, D., Ellis, R. S., Fall, S. M., Grogin, N. A., Moustakas, L. A., Panagia, N., Sosey, M., Stiavelli, M., Bergeron, E., Casertano, S., Ingraham, P., Koekemoer, A., Labbé, I., Livio, M., Rodgers, B., Scarlata, C., Vernet, J., Renzini, A., Rosati, P., Kuntschner, H., Kümmel, M., Walsh, J. R., Chary, R., Eisenhardt, P., Pirzkal, N., & Stern, D. 2005, ApJ, 635, 832
- Nonino et al. (2009) Nonino, M., Dickinson, M., Rosati, P., Grazian, A., Reddy, N., Cristiani, S., Giavalisco, M., Kuntschner, H., Vanzella, E., Daddi, E., Fosbury, R. A. E., & Cesarsky, C. 2009, ApJS, 183, 244
- Norberg et al. (2002) Norberg, P., Cole, S., Baugh, C. M., Frenk, C. S., Baldry, I., Bland-Hawthorn, J., Bridges, T., Cannon, R., Colless, M., Collins, C., Couch, W., Cross, N. J. G., Dalton, G., De Propris, R., Driver, S. P., Efstathiou, G., Ellis, R. S., Glazebrook, K., Jackson, C., Lahav, O., Lewis, I., Lumsden, S., Maddox, S., Madgwick, D., Peacock, J. A., Peterson, B. A., Sutherland, W., & Taylor, K. 2002, MNRAS, 336, 907
- Oke (1974) Oke, J. B. 1974, ApJS, 27, 21
- Papovich et al. (2011) Papovich, C., Finkelstein, S. L., Ferguson, H. C., Lotz, J. M., & Giavalisco, M. 2011, MNRAS, 412, 1123
- Papovich et al. (2006) Papovich, C., Moustakas, L. A., Dickinson, M., Le Floc’h, E., Rieke, G. H., Daddi, E., Alexander, D. M., Bauer, F., Brandt, W. N., Dahlen, T., Egami, E., Eisenhardt, P., Elbaz, D., Ferguson, H. C., Giavalisco, M., Lucas, R. A., Mobasher, B., Pérez-González, P. G., Stutz, A., Rieke, M. J., & Yan, H. 2006, ApJ, 640, 92
- Peng et al. (2010) Peng, Y., Lilly, S. J., Kovač, K., Bolzonella, M., Pozzetti, L., Renzini, A., Zamorani, G., Ilbert, O., Knobel, C., Iovino, A., Maier, C., Cucciati, O., Tasca, L., Carollo, C. M., Silverman, J., Kampczyk, P., de Ravel, L., Sanders, D., Scoville, N., Contini, T., Mainieri, V., Scodeggio, M., Kneib, J., Le Fèvre, O., Bardelli, S., Bongiorno, A., Caputi, K., Coppa, G., de la Torre, S., Franzetti, P., Garilli, B., Lamareille, F., Le Borgne, J., Le Brun, V., Mignoli, M., Perez Montero, E., Pello, R., Ricciardelli, E., Tanaka, M., Tresse, L., Vergani, D., Welikala, N., Zucca, E., Oesch, P., Abbas, U., Barnes, L., Bordoloi, R., Bottini, D., Cappi, A., Cassata, P., Cimatti, A., Fumana, M., Hasinger, G., Koekemoer, A., Leauthaud, A., Maccagni, D., Marinoni, C., McCracken, H., Memeo, P., Meneux, B., Nair, P., Porciani, C., Presotto, V., & Scaramella, R. 2010, ApJ, 721, 193
- Pérez-González et al. (2008) Pérez-González, P. G., Rieke, G. H., Villar, V., Barro, G., Blaylock, M., Egami, E., Gallego, J., Gil de Paz, A., Pascual, S., Zamorano, J., & Donley, J. L. 2008, ApJ, 675, 234
- Polletta et al. (2007) Polletta, M., Tajer, M., Maraschi, L., Trinchieri, G., Lonsdale, C. J., Chiappetti, L., Andreon, S., Pierre, M., Le Fèvre, O., Zamorani, G., Maccagni, D., Garcet, O., Surdej, J., Franceschini, A., Alloin, D., Shupe, D. L., Surace, J. A., Fang, F., Rowan-Robinson, M., Smith, H. E., & Tresse, L. 2007, ApJ, 663, 81
- Ranalli et al. (2003) Ranalli, P., Comastri, A., & Setti, G. 2003, A&A, 399, 39
- Ravindranath et al. (2006) Ravindranath, S., Giavalisco, M., Ferguson, H. C., Conselice, C., Katz, N., Weinberg, M., Lotz, J., Dickinson, M., Fall, S. M., Mobasher, B., & Papovich, C. 2006, ApJ, 652, 963
- Reddy et al. (2005) Reddy, N. A., Erb, D. K., Steidel, C. C., Shapley, A. E., Adelberger, K. L., & Pettini, M. 2005, ApJ, 633, 748
- Retzlaff et al. (2010) Retzlaff, J., Rosati, P., Dickinson, M., Vandame, B., Rité, C., Nonino, M., Cesarsky, C., & GOODS Team. 2010, A&A, 511, A50+
- Riguccini et al. (2011) Riguccini, L., Le Floc’h, E., Ilbert, O., Aussel, H., Salvato, M., Capak, P., McCracken, H., Kartaltepe, J., Sanders, D., & Scoville, N. 2011, A&A, 534, A81
- Roche et al. (2002) Roche, N. D., Almaini, O., Dunlop, J., Ivison, R. J., & Willott, C. J. 2002, MNRAS, 337, 1282
- Roche et al. (2003) Roche, N. D., Dunlop, J., & Almaini, O. 2003, MNRAS, 346, 803
- Rodighiero et al. (2007) Rodighiero, G., Cimatti, A., Franceschini, A., Brusa, M., Fritz, J., & Bolzonella, M. 2007, A&A, 470, 21
- Salimbeni et al. (2009a) Salimbeni, S., Castellano, M., Pentericci, L., Trevese, D., Fiore, F., Grazian, A., Fontana, A., Giallongo, E., Boutsia, K., Cristiani, S., de Santis, C., Gallozzi, S., Menci, N., Nonino, M., Paris, D., Santini, P., & Vanzella, E. 2009a, A&A, 501, 865
- Salimbeni et al. (2009b) Salimbeni, S., Fontana, A., Giallongo, E., Grazian, A., Menci, N., Pentericci, L., & Santini, P. 2009b, in American Institute of Physics Conference Series, Vol. 1111, American Institute of Physics Conference Series, ed. G. Giobbi, A. Tornambe, G. Raimondo, M. Limongi, L. A. Antonelli, N. Menci, & E. Brocato, 207–211
- Salpeter (1955) Salpeter, E. E. 1955, ApJ, 121, 161
- Saracco et al. (2010) Saracco, P., Longhetti, M., & Gargiulo, A. 2010, MNRAS, 408, L21
- Saracco et al. (2005) Saracco, P., Longhetti, M., Severgnini, P., Della Ceca, R., Braito, V., Mannucci, F., Bender, R., Drory, N., Feulner, G., Hopp, U., & Maraston, C. 2005, MNRAS, 357, L40
- Scott et al. (2010) Scott, K. S., Yun, M. S., Wilson, G. W., Austermann, J. E., Aguilar, E., Aretxaga, I., Ezawa, H., Ferrusca, D., Hatsukade, B., Hughes, D. H., Iono, D., Giavalisco, M., Kawabe, R., Kohno, K., Mauskopf, P. D., Oshima, T., Perera, T. A., Rand, J., Tamura, Y., Tosaki, T., Velazquez, M., Williams, C. C., & Zeballos, M. 2010, MNRAS, 405, 2260
- Steidel et al. (1999) Steidel, C. C., Adelberger, K. L., Giavalisco, M., Dickinson, M., & Pettini, M. 1999, ApJ, 519, 1
- Steidel et al. (2003) Steidel, C. C., Adelberger, K. L., Shapley, A. E., Pettini, M., Dickinson, M., & Giavalisco, M. 2003, ApJ, 592, 728
- Steidel et al. (1996a) Steidel, C. C., Giavalisco, M., Dickinson, M., & Adelberger, K. L. 1996a, AJ, 112, 352
- Steidel et al. (1996b) Steidel, C. C., Giavalisco, M., Pettini, M., Dickinson, M., & Adelberger, K. L. 1996b, ApJ, 462, L17+
- Steidel et al. (2004) Steidel, C. C., Shapley, A. E., Pettini, M., Adelberger, K. L., Erb, D. K., Reddy, N. A., & Hunt, M. P. 2004, ApJ, 604, 534
- Swinbank et al. (2006) Swinbank, A. M., Chapman, S. C., Smail, I., Lindner, C., Borys, C., Blain, A. W., Ivison, R. J., & Lewis, G. F. 2006, MNRAS, 371, 465
- Thompson et al. (1999) Thompson, D., Beckwith, S. V. W., Fockenbrock, R., Fried, J., Hippelein, H., Huang, J.-S., von Kuhlmann, B., Leinert, C., Meisenheimer, K., Phleps, S., Röser, H.-J., Thommes, E., & Wolf, C. 1999, ApJ, 523, 100
- Toft et al. (2009) Toft, S., Franx, M., van Dokkum, P., Förster Schreiber, N. M., Labbe, I., Wuyts, S., & Marchesini, D. 2009, ApJ, 705, 255
- van den Bergh et al. (2000) van den Bergh, S., Cohen, J. G., Hogg, D. W., & Blandford, R. 2000, AJ, 120, 2190
- van Dokkum et al. (2003) van Dokkum, P. G., Förster Schreiber, N. M., Franx, M., Daddi, E., Illingworth, G. D., Labbé, I., Moorwood, A., Rix, H.-W., Röttgering, H., Rudnick, G., van der Wel, A., van der Werf, P., & van Starkenburg, L. 2003, ApJ, 587, L83
- van Dokkum et al. (2004) van Dokkum, P. G., Franx, M., Förster Schreiber, N. M., Illingworth, G. D., Daddi, E., Knudsen, K. K., Labbé, I., Moorwood, A., Rix, H.-W., Röttgering, H., Rudnick, G., Trujillo, I., van der Werf, P., van der Wel, A., van Starkenburg, L., & Wuyts, S. 2004, ApJ, 611, 703
- van Dokkum et al. (2006) van Dokkum, P. G., Quadri, R., Marchesini, D., Rudnick, G., Franx, M., Gawiser, E., Herrera, D., Wuyts, S., Lira, P., Labbé, I., Maza, J., Illingworth, G. D., Förster Schreiber, N. M., Kriek, M., Rix, H.-W., Taylor, E. N., Toft, S., Webb, T., & Yi, S. K. 2006, ApJ, 638, L59
- van Dokkum et al. (2010) van Dokkum, P. G., Whitaker, K. E., Brammer, G., Franx, M., Kriek, M., Labbé, I., Marchesini, D., Quadri, R., Bezanson, R., Illingworth, G. D., Muzzin, A., Rudnick, G., Tal, T., & Wake, D. 2010, ApJ, 709, 1018
- Wang et al. (2004) Wang, J. X., Malhotra, S., Rhoads, J. E., & Norman, C. A. 2004, ApJ, 612, L109
- Wang et al. (2010) Wang, W.-H., Cowie, L. L., Barger, A. J., Keenan, R. C., & Ting, H.-C. 2010, ApJS, 187, 251
- White & Rees (1978) White, S. D. M., & Rees, M. J. 1978, MNRAS, 183, 341
- Wiklind et al. (2008) Wiklind, T., Dickinson, M., Ferguson, H. C., Giavalisco, M., Mobasher, B., Grogin, N. A., & Panagia, N. 2008, ApJ, 676, 781
- Windhorst et al. (2011) Windhorst, R. A., Cohen, S. H., Hathi, N. P., McCarthy, P. J., Ryan, Jr., R. E., Yan, H., Baldry, I. K., Driver, S. P., Frogel, J. A., Hill, D. T., Kelvin, L. S., Koekemoer, A. M., Mechtley, M., O’Connell, R. W., Robotham, A. S. G., Rutkowski, M. J., Seibert, M., Straughn, A. N., Tuffs, R. J., Balick, B., Bond, H. E., Bushouse, H., Calzetti, D., Crockett, M., Disney, M. J., Dopita, M. A., Hall, D. N. B., Holtzman, J. A., Kaviraj, S., Kimble, R. A., MacKenty, J. W., Mutchler, M., Paresce, F., Saha, A., Silk, J. I., Trauger, J. T., Walker, A. R., Whitmore, B. C., & Young, E. T. 2011, ApJS, 193, 27
- Xue et al. (2011) Xue, Y. Q., Luo, B., Brandt, W. N., Bauer, F. E., Lehmer, B. D., Broos, P. S., Schneider, D. P., Alexander, D. M., Brusa, M., Comastri, A., Fabian, A. C., Gilli, R., Hasinger, G., Hornschemeier, A. E., Koekemoer, A., Liu, T., Mainieri, V., Paolillo, M., Rafferty, D. A., Rosati, P., Shemmer, O., Silverman, J. D., Smail, I., Tozzi, P., & Vignali, C. 2011, ApJS, 195, 10
- Yan et al. (2004) Yan, L., Thompson, D., & Soifer, B. T. 2004, AJ, 127, 1274
- Yun et al. (2012) Yun, M. S., Scott, K. S., Guo, Y., Aretxaga, I., Giavalisco, M., Austermann, J. E., Capak, P., Chen, Y., Ezawa, H., Hatsukade, B., Hughes, D. H., Iono, D., Johnson, S., Kawabe, R., Kohno, K., Lowenthal, J., Miller, N., Morrison, G., Oshima, T., Perera, T. A., Salvato, M., Silverman, J., Tamura, Y., Williams, C. C., & Wilson, G. W. 2012, MNRAS, 420, 957
- Zirm et al. (2007) Zirm, A. W., van der Wel, A., Franx, M., Labbé, I., Trujillo, I., van Dokkum, P., Toft, S., Daddi, E., Rudnick, G., Rix, H.-W., Röttgering, H. J. A., & van der Werf, P. 2007, ApJ, 656, 66