CANDELS: Strong Lensing Galaxies in HST/WFC3 Imaging Data of UDS and GOODS-S
Abstract
We present results from a search for gravitationally lensed galaxies present in the Hubble Space Telescope (HST)/Wide Field Camera-3 (WFC3) images of the Cosmic Assembly Near-IR Deep Extragalactic Legacy Survey (CANDELS). We present one bona fide lens system in UDS and two compact lens candidates in the GOODS-S field. The lensing system in UDS involves two background galaxies, one at lensed to an arc and a counterimage, and the second at a photometric redshift of lensed to a double image. We reconstruct the lensed sources in the source plane and find in each of the two cases the sources can be separated to a pair of galaxies. The sources responsible for the arc are compact with effective radii of 0.3 to 0.4 kpc in WFC3 -band and a total stellar mass and a star-formation rate of M⊙ and M⊙ yr-1, respectively. The abnormally high -band flux of this source is likely due to [O iii] emission lines with a rest-frame equivalent width about 700Å for [O iii] 5007 Å. The sources responsible for the double image have corresponding values of about 0.4 to 0.5 kpc, M⊙ and M⊙ yr-1. Once completed CANDELS is expected to contain about 15 lensing systems and will allow statistical studies on both lensing mass profiles and lensed galaxies.
Subject headings:
Gravitational lensing: strong1. Introduction
Gravitational lensing is an invaluable tool in astrophysics. It has been exploited in the past to study properties of both the background lensed galaxies as well as the foreground lenses (see reviews by Bartelmann, 2010; Treu et al., 2010). The variety of studies enabled by lensing has motivated searches for lensing events in various multi-wavelength astronomical datasets, from optical (e.g., SLACS: Bolton et al. 2006), sub-mm (e.g., Herschel: Negrello et al. 2010) to radio (CLASS: Browne et al. 2003). Given that most galaxy-scale lenses involve image separations, most successful searches for gravitational lenses have involved the use of high resolution imaging. In this respect, HST surveys have been successful in uncovering lensed galaxies even in relatively small areas on the sky (Ratnatunga et al., 1995; Barkana et al., 1999; Fassnacht et al., 2004; Moustakas et al., 2007; More et al., 2011).
The CANDELS is now obtaining WFC3 and ACS imaging data of several well-known extragalactic fields at unprecedented depth and resolution (Grogin et al., 2011; Koekemoer et al., 2011). The early data include F125W, F160W (WFC3), and F814W (ACS) imaging over an area of 249 arcmin2 in GOODS-S and UDS fields. These initial imaging data are adequate for a first study of lensed galaxies. In comparison to the work we present here More et al. (2011) identified 10 candidate lensed galaxies using ACS imaging over 0.22 deg2 of the ECDFS. Based on their success rate at identifying candidate lensing events, we expect about 3 to 4 lensed galaxies in current CANDELS data and about 15 when completed with imaging over 0.35 deg2. Due to the ground-based and ACS data in CANDELS fields, we do expect some fraction of the lensed galaxies to be identified already.
The paper is organized as follows: In Section 2 we present a brief summary of the candidate lens selection. Section 3 describes surface brightness models, while in Section 4 we outline the lens models and discuss results on the three lens systems. For lensing models we assume the best-fit concordance cosmology consistent with WMAP-7 year data (Larson et al., 2011).
| Source | RA(a) | Dec(a) | Sérsi c index | |||||
|---|---|---|---|---|---|---|---|---|
| GOODS-S01 | 53.019907∘ | -27.770704∘ | ″ | ″(c) | (c) | (c) | ||
| (Dark matter) | (d) | (d) | ||||||
| (lensed source) | (e) | (e) | (e) | |||||
| GOODS-S02 | 53.026810∘ | -27.791320∘ | ″ | ″(c) | (c) | (c) | ||
| (Dark matter) | (d) | (d) | ||||||
| (lensed source) | ″(e) | (e) | (e) |
Note. — (a): Lensing galaxy centroids from GALFIT using F814W. (b): In units of km/sec. (c): For the -band lens light profile from GALFIT using F814W. (d): for the lens dark matter profile from lens modeling. (e): for the lensed -band background source light profile from lens reconstruction and GALFIT modeling. (f): Lensing magnification. (g): Effective radius from GALFIT modeling. (h): Axis ratio from GALFIT modeling. (i): Spectroscopic redshift from Vanzella et al. (2005).
2. Lens Candidate Selection
For the lens candidate search we make use of the CANDELS v0.5 drizzled mosaics at the pixel scale of 0.03 and 0.06′′/pixel for WFC3 and ACS bands, respectively, and involving two epochs of UDS and five epochs of GOODS-S (wide)111Mosaics are publicly available at http://candels.ucolick.org/ (Koekemoer et al., 2011). The UDS mosaic has 5 point source depths of 27.3, 26.3 and 25.9 (AB) magnitudes in F814W (-band), F125W (-band), and F160W (-band), respectively. The corresponding depths for GOODS-S mosaics are 27.7, 26.6, and 26.5 (AB). As an initial search for lensed galaxies in the UDS and GOODS-S fields we created individual false-color postage stamps of potential lensing galaxies with mag. Our selection of lensed candidates is simply based on morphological information only. For this, we inspected individual image cutouts searching for both extended structure and color differences at the outskirts of galaxies that could be evidence for lensing. This process allowed us to make an initial selection of 20 candidate gravitationally lensed galaxies. Through an internal poll within the CANDELS team we ranked the list of 20 and selected three high priority targets for further studies reported in this paper.
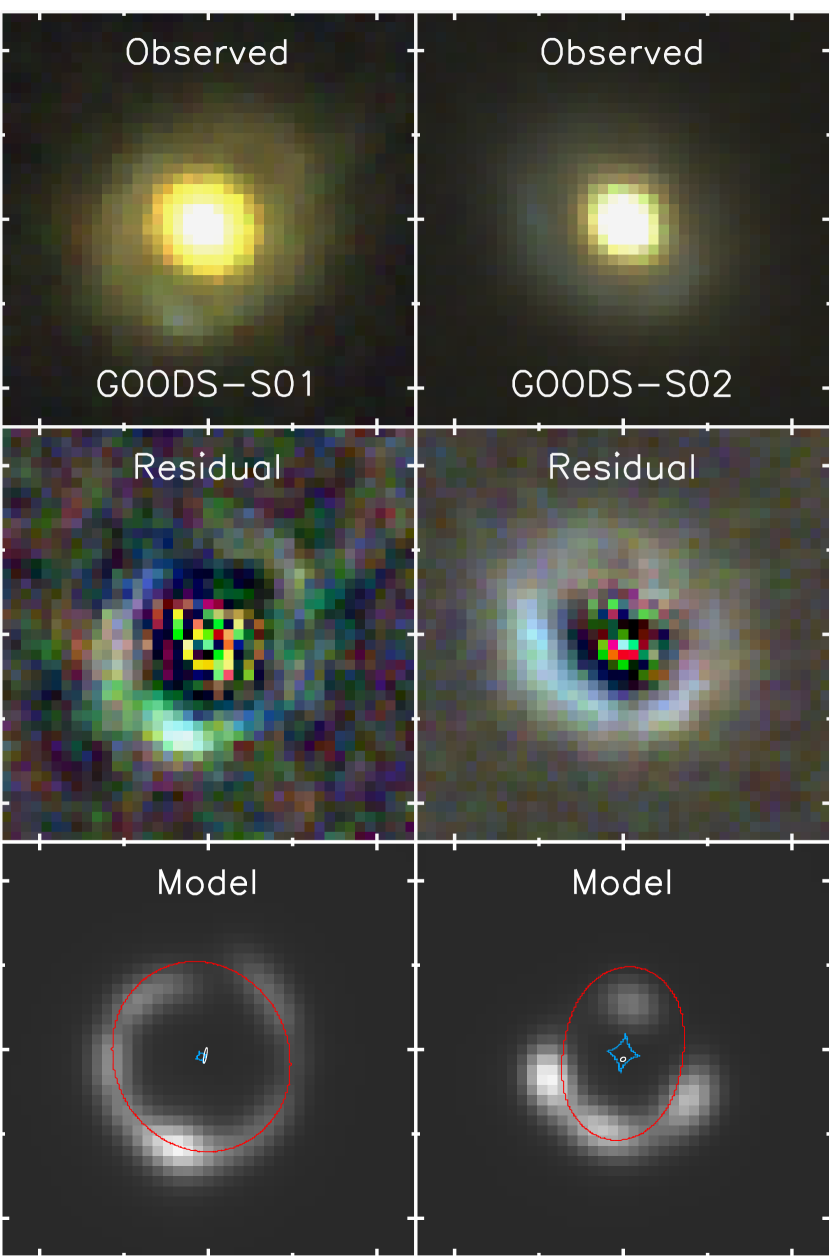
The three lensing candidates are GOODS-S01 and GOODS-S02 (Table 1) and UDS-01 (Table 2). GOODS-S02 was identified by More et al. (2011) as a candidate lensing system and is included as their second highest priority lensing system from ACS images; The highest priority lensing system from More et al. (2011) is not in our candidate list as CANDELS tiles do not overlap with it. GOODS-S01 was previously identified as a partial-ring galaxy in GEMS and GOODS Elmegreen & Elmegreen (2006).
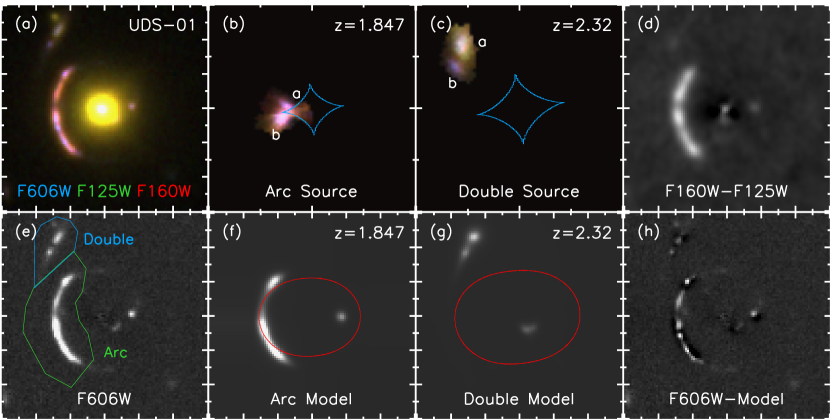
UDS-01 was previously identified as a lensing galaxy by Geach et al. (2007) as part of a radio source followup. The lensed source was later identified in the CFHT Legacy Survey and was included in a snapshot HST/ACS lensing program for strong lenses in the CFHTLS (Tu et al., 2009). The CANDELS WFC3 imaging complements existing ACS data in - (F606W) and -band. Furthermore this field has both CFHTLS MegaCam imaging in the optical and UKIDSS WFCAM Ultra-Deep Survey (UDS) imaging in the near IR. CFHTLS images reach 5 depths of 25.9, 26.5, 25.8, 26.0 and 24.6 magnitudes (AB), respectively, in , , , , and respectively with typical seeing in the UDS-01 region of about 0.8 arcsec (FWHM). We also make use of , and -band images from UKIDSS UDS data release 8 (Almaini et al. in prep.), which reach , and magnitudes (AB, with aperture) respectively. The seeing FWHM in the region of UDS-01 range from for the -band data to for -band.
UDS-01 involves a foreground lens galaxy which is a member of a group/cluster potential at and with a velocity dispersion of 770 km/sec Geach et al. (2007). The system involves two background lensed sources with one at a measured spectroscopic redshift of 1.847 and another with a previously estimated photometric redshift of 2.90 in Tu et al. (2009) using CFHTLS and ACS - and -band data. We revise this estimate to be here with 12-band photometry involving CFHT (, , , , ), UKIDSS (, , ), ACS (, ), and WFC3 (, ).
| Quantity | Value | Ref |
|---|---|---|
| Lens Galaxy | ||
| RA | 34.404790∘ | ACS -band |
| Dec | 5.224868∘ | ACS -band |
| Redshift | 0.64590.0003 | Tu et al. 2009 |
| km s-1 | lens model | |
| ″ | lens model | |
| lens model | ||
| lens model | ||
| ′′ | GALFIT | |
| kpc | ||
| GALFIT | ||
| (Sérsic) | 8.0(I) | GALFIT |
| Lens Cluster | ||
| RA | 34.389725∘ | Geach et al. 2007 |
| Dec | 5.220814∘ | Geach et al. 2007 |
| Redshift | Geach et al. 2007 | |
| km s-1 | Geach et al. 2007 | |
| Tangential Arc | ||
| Redshift | Tu et al. 2009 | |
| ACS/F606W | Photometry | |
| ACS/F814W | ||
| WFC3/F125W | ||
| WFC3/F160W | ||
| RA(II) | 34.402409∘ | lens model |
| Dec(II) | 5.224189∘ | lens model |
| (a) | lens model | |
| (a) | GALFIT/lens reconstuction | |
| (a) | ″ | GALFIT/lens reconstuction |
| kpc | (in F125W) | |
| GALFIT/lens reconstuction | ||
| (b) | lens model | |
| (b) | GALFIT/lens reconstuction | |
| (b) | ″ | GALFIT/lens reconstuction |
| kpc | (in F125W) | |
| GALFIT/lens reconstuction | ||
| M⋆ | M⊙(III) | SED/lens magnification |
| SFR | M⊙yr-1(III) | SED/lens magnification |
| E(B-V) | SED/lens magnification | |
| Double System | ||
| Redshift | photo-z | |
| ACS/F606W | Photometry | |
| ACS/F814W | ||
| WFC3/F125W | ||
| WFC3/F160W | ||
| RA(II) | 34.402245∘ | lens model |
| Dec(II) | 5.223925∘ | lens model |
| (a) | lens model | |
| (a) | GALFIT/lens reconstuction | |
| (a) | ″ | GALFIT/lens reconstuction |
| kpc | (in F125W) | |
| GALFIT/lens reconstuction | ||
| (b) | lens model | |
| (b) | GALFIT/lens reconstuction | |
| (b) | ″ | GALFIT/lens reconstuction |
| kpc | (in F125W) | |
| GALFIT/lens reconstuction | ||
| M⋆ | M⊙(III) | SED/lens magnification |
| SFR | M⊙(III) | SED/lens magnification |
| E(B-V) | SED/lens magnification | |
Note. — (I): GALFIT models converge when . (II): Position of the best-fit brightest source component from lens modeling using F125W (WFC3 -band) image. (III): Corrected for lensing magnification.
3. Surface Brightness Models
The two-dimensional surface brightness profile of each of the three foreground lensing galaxies were modeled using the GALFIT 3.0 routine (Peng et al., 2010) in order to perform the foreground lens-background source separation shown on Figs. 1 and 2. A 1212′′ region was cut out from each of the UDS and GOODS-S mosaics and was used as the input image for galaxy profile modeling.
For GALFIT modeling the foreground lensing galaxies were assumed to have a Sérsic profile of the form
| (1) |
where is the scale radius and is the index. Since the only object of interest for GALFIT modeling was the lensing galaxy for each image, all other sources including the lensed sources were masked for this purpose.
To improve the accuracy and decrease the level of degeneracy of the morphological parameters such as the integrated magnitude, Sérsic index, and effective radius, PSFs for WFC3 data generated internally by CANDELS (Koekemoer et al., 2011) were used as an input for convolution in the modeling. HST/WFC3 noise rms maps were also utilized instead of GALFIT’s internal sigma image generating algorithm to improve the uncertainties reported in the output parameters. The residual after accounting for the central lensing galaxy profile is taken to be the lensed flux of the background source. These residual images are used directly in lens modeling.
4. Lens Models and Results
We use the publicly available Lenstool software (Jullo et al., 2007) in combination with the IDL routine AMOEBA_SA to optimize the lens model and the shape of the lensed galaxy.
For the candidate lenses GOODS-S01 and GOODS-S02, we assume that each of the foreground lens galaxies is embedded in a dark matter halo that can be described as an elliptical singular isothermal sphere (SIS). The halos are fixed to the centroids of the galaxies as determined from GALFIT. For the lensed galaxies, we assume exponential disk profiles with . There are a total of nine free parameters — the position, the intrinsic magnitude, the scale length, the ellipticity, and the position angle (PA) of the source (, , , , , and ), and the ellipticity, the PA, and the velocity dispersion of the dark matter halo (, , and ).
UDS-01 is a more complicated case. The central lensing galaxy at belongs to an X-ray detected galaxy group at . Hence, besides the elliptical SIS halo centered on the lensing galaxy, we also include a circular SIS halo at the center of the galaxy group 56″ NW of UDS-01 with its velocity dispersion fixed to that of the member galaxies (774 km s-1 at Geach et al., 2007). In addition, there are two pairs of background galaxies that are strongly lensed by the joint gravitational potential of the central galaxy and the group: one at corresponding to the tangential arc, the other at a photometric redshift of corresponding to the double system further out (see Fig. 2). Because the tangential system provides better constraints to the dark matter distribution, we use the tangential system to find the parameters of the SIS halo associated with the central lensing galaxy, then we use this solution to constrain the positions and shapes of the double system. Again we assume exponential profiles for the background galaxies.
Our fitting procedure is as follows. For an initial set of parameters describing the source and the deflector, we use Lenstool to generate a deflected image of the source. We then convolve it with the WFC3 PSFs at each band and subtract it from the observed lens-subtracted image to compute the value. This process is iterated with AMOEBA_SA to find the parameters that minimize the value. AMOEBA_SA is based on the IDL multidimensional minimization routine AMOEBA with simulated annealing added (E. Rosolowsky, private communication). We adopt an initial “temperature” of 100 and decrease it by 40% in each subsequent calls of AMOEBA_SA.
4.1. GOODS-S01 and GOODS-S02
Fig. 1 shows the best-fit lensing models for the Einstein ring candidate GOODS-S01 and the cusp lens GOODS-S02 and Table 1 summarizes lens model properties. For lens modeling, we assume that the background galaxies in both systems are at . We attempted to extract the photometric redshift of the background galaxies by SED fitting to CANDELS and archival residual fluxes. Both systems, however, are compact with each having an Einstein radius of 0.5′′ and an accurate separation of the lens profile from the background source flux was challenging. The reduced- value for the best-fit lens model is 1.1 and 1.5 for GOODS-S01 and -S02, respectively.
The dark matter profile of GOODS-S02 lens has an ellipticity of , while the the Einstein radius is ′′. These are consistent with values of 0.48 and 0.4″reported in More et al. (2011), respectively. The lens galaxies have effective radii of kpc (GOODS-S01) and kpc (GOODS-S02). Using the best-fit velocity dispersion and axis ratios, we estimate enclosed masses within critical (Einstein) radii of M☉ and M☉ for GOODS-S01 and S02, respectively. The corresponding -band luminosities for apertures matched to the critical radii of the two galaxies are L☉ and L☉. We find total mass-to-light ratios of and out to critical radii of GOODS-S01 and S02, respectively. Note that there is an additional systematic error of to 2.0 in the ratio associated with the unknown background source redshifts for the two lens systems.
4.2. UDS-01
Fig. 2 shows the best-fit lens model and the lensed galaxy image reconstruction directly in the source plane. Table 2 summarizes lens modeling, profile fitting, and SED modeling results. To measure source properties we make use of WFC3/F125W image. The arc and counterimage, taking the form of a cusp lens, involve an extend source with at least two peaks of emission. The source responsible for double image is also made up of two separate galaxies in the source plane. In Table 2 we separate the properties of each of these galaxy pairs with labels and , while the two components are identified in Fig. 2(b) and (c) panels.
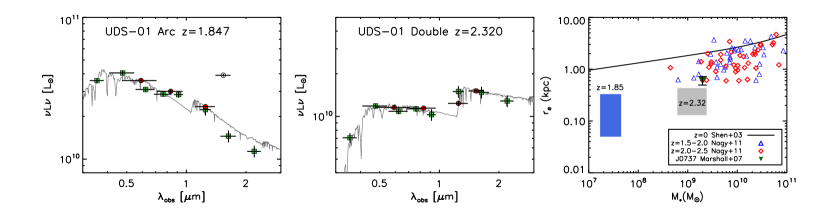
In Fig. 3 we show the SEDs of the sources responsible for the lensed arc and the north-west double source, with the luminosity scale corrected for the magnification In making these SED plots, instead of using GALFIT to remove the lens galaxy, we take advantage of the asymmetry of the lensed system and create residual images by subtracting a mirrored image from the original image. This removes the need for accurate galaxy profiles for the lens. Irregular-sized apertures are made to enclose most of the flux from the arc and the NW-double in the CFHT and UKIDSS images as highlighted in Fig. 2(e). The WFC3/F160W photometry of the arc is abnormally high. This is probably due to the redshifted [O iii] 4959 and 5007 lines, as both fall within the WFC F160W band for a source at . This hypothesis is supported by the fact that the bandpass in WFC3 begins at 1.4 m, while UKIRT WFCAM -band filter used in UKIDSS has effectively a zero throughput at m and misses the [O iii] emission lines.
Stellar population synthesis models are built for exponentially declining star formation histories with SFR(t) exp() with various and ages (Bruzual & Charlot, 2003), with the restriction that template ages are less than the age of the universe at the corresponding redshift. For each template we fit for stellar mass and intrinsic extinction to match the observed SEDs, assuming the extinction law of Calzetti et al. (1994) and parameterized by . The templates that gives the minimum values are chosen as the best fit. Since the SED templates do not include emission lines, we did not include the F160W data point for source in the modeling. The quoted best-fit stellar masses and SFRs are corrected for magnification using amplification factors calculated for the photometry apertures using the best-fit lensing model (Table 2).
We measure the difference of SED predicted flux scaled from F125W filter to F160W and the observed F160W flux as a measurement of the [O iii] intensity. Fig. 2(d) shows that this difference is not localized to a specific region on the arc suggesting that the [O iii] emission is spatially distributed broadly across the two components responsible for the arc. Assuming [O iii] 4959 to 5007 ratio is 0.33, we estimate ergs s-1 cm-2 Å-1 and a rest-frame equivalent width for the [O iii] emission of 700Å. The suggestion that the arc has high [O iii] emission is consistent with the discovery of star-bursting dwarf galaxies in CANDELS with strong [O iii] emission lines falling in the WFC3 -band (van der Wel et al., 2011). Our source is at a slightly higher redshift with [O iii] in the WFC3 -band. The van der Wel et al. (2011) sources have rest-frame equivalent widths as high as 1000Å and [O iii] fluxes a factor of 3 to 4 higher than that of the arc after correcting for magnification. The stellar mass and the SFR we find the arc source with SED fits are consistent with the suggestion that the two sources are dwarf galaxies with a star-burst phase with of around 9 to 10 Myr.
Based on GALFIT modeling of the reconstructed source profile, the sources responsible for the arc are compact with effective radii around 0.05 to 0.5 kpc, while the two sources responsible for the double images have effective radii of 0.2 to 0.6 kpc. In Fig. 3 right panel we summarizes these sources in the stellar mass-size and compare to other samples of galaxies. As summarized there the arc sources are not only dwarf galaxies, or smaller than typical “dwarf” galaxies with a few times 107 M☉ stellar mass, the galaxies are bursting with stars and have high [O iii] emission. The lensing system is radio bright (Geach et al., 2007) and thus a high resolution map of the radio emission will be useful to have to narrow down the source of [O iii] emission, especially if either or both of the two compact, star-bursting galaxies magnified to the arc host an AGN.
To summarize this Letter, we have presented results from a search for lensed galaxies in early CANDELS imaging data involving two candidates in GOODS-South and a bona fide lensing system in the UDS field. We reconstruct the lensed sources in the UDS system and through GALFIT and SED model fits to the total aperture fluxes establish their properties including effective radius, stellar mass, star-formation rate, among others. The pair of galaxies lensed to the arc and a counterimage show bright [O iii] line emission in the WFC -band. The sources are compact and are undergoing a star-bursting phase. They are some of the smallest galaxies with lowest stellar masses at and falls below in size and stellar mass when compared to even dwarf galaxies at these redshifts.
References
- Barkana et al. (1999) Barkana, R., Blandford, R., & Hogg, D. W. 1999, ApJ, 513, L91
- Bartelmann (2010) Bartelmann, M. 2010, Classical and Quantum Gravity, 27, 233001
- Bolton et al. (2006) Bolton, A. S., Burles, S., Koopmans, L. V. E., Treu, T., & Moustakas, L. A. 2006, ApJ, 638, 703
- Browne et al. (2003) Browne, I. W. A., et al. 2003, MNRAS, 341, 13
- Bruzual & Charlot (2003) Bruzual, G., & Charlot, S. 2003, MNRAS, 344, 1000
- Calzetti et al. (1994) Calzetti, D., Kinney, A. L., & Storchi-Bergmann, T. 1994, ApJ, 429, 582
- Elmegreen & Elmegreen (2006) Elmegreen, D. M. & Elmegreen, B. G. 2006, ApJ, 651, 676
- Fassnacht et al. (2004) Fassnacht, C. D., Moustakas, L. A., Casertano, S., Ferguson, H. C., Lucas, R. A., & Park, Y. 2004, ApJ, 600, L155
- Geach et al. (2007) Geach, J. E., Simpson, C., Rawlings, S., Read, A. M., & Watson, M. 2007, Monthly Notices of the Royal Astronomical Society, 381, 1369
- Grogin et al. (2011) Grogin, N. A., et al. 2011, ArXiv e-prints
- Jullo et al. (2007) Jullo, E., Kneib, J. P., Limousin, M., Eliasdottir, A., Marshall, P. J., & Verdugo, T. 2007, New Journal of Physics, 9
- Koekemoer et al. (2011) Koekemoer, A. M., et al. 2011, ArXiv e-prints
- Larson et al. (2011) Larson, D., et al. 2011, ApJS, 192, 16
- Lawrence et al. (2007) Lawrence, A., et al. 2007, MNRAS, 379, 1599
- Marshall et al. (2007) Marshall, P. J., et al. 2007, ApJ, 671, 1196
- More et al. (2011) More, A., Jahnke, K., More, S., Gallazzi, A., Bell, E. F., Barden, M., & Häusler, B. 2011, ApJ, 734, 69
- Moustakas et al. (2007) Moustakas, L. A., et al. 2007, ApJ, 660, L31
- Nagy et al. (2011) Nagy, S. R., Law, D. R., Shapley, A. E., & Steidel, C. C. 2011, ApJ, 735, L19
- Negrello et al. (2010) Negrello, M., et al. 2010, Science, 330, 800
- Peng et al. (2010) Peng, C. Y., Ho, L. C., Impey, C. D., & Rix, H.-W. 2010, AJ, 139, 2097
- Ratnatunga et al. (1995) Ratnatunga, K. U., Ostrander, E. J., Griffiths, R. E., & Im, M. 1995, ApJ, 453, L5+
- Shen et al. (2003) Shen, S., et al. 2003, MNRAS, 343, 978
- Treu et al. (2010) Treu, T. 2010, ARA&A, 48, 87
- Tu et al. (2009) Tu, H., et al. 2009, A&A, 501, 475
- van der Wel et al. (2011) van der Wel, A., et al. 2011, ArXiv e-prints
- Vanzella et al. (2005) Vanzella, E., et al. 2005, A&A, 434, 53