Thermal instability in the collisionally cooled gas
Abstract
We have presented the non-equilibrium (time-dependent) cooling rate and ionization state calculations for a gas behind shock waves with km s-1 ( K). Such shock waves do not lead to the radiative precursor formation, i.e. the thermal evolution of a gas behind the shock waves are controlled by collisions only. We have found that the cooling rate in a gas behind the shock waves with km s-1 ( K) differs considerably from the cooling rate for a gas cooled from K. It is well-known that a gas cooled from K is thermally unstable for isobaric and isochoric perturbations at K. We have studied the thermal instability in a collisionally controlled gas for shock waves with km s-1. We have found that the temperature range, where the postshock gas is thermally unstable, is significantly modified and depends on both gas metallicity and ionic composition of a gas before shock wave. For the temperature range, where the thermal instability criterion for isochoric perturbations is not fulfilled, widens in comparison with that for a gas cooled from K, while that for isobaric perturbations remains almost without a change. For a gas behind shock waves with km s-1 ( K) is thermally stable to isochoric perturbations during full its evolution. We have shown that the transition from isobaric to isochoric cooling for a gas with behind shock waves with K proceeds at lower column density layer behind a shock wave than that for a gas cooled from K. The ionic states in a gas with behind shock waves with K demostrate a significant difference from these in a gas cooled from K. Such difference is thought to be important for correct interpretation of observational data, but hardly help to dicriminate thermally stable gas.
keywords:
cosmology: theory – intergalactic medium – quasars: general – absorption lines – physical data and processes: atomic processes1 Introduction
Thermal instability (TI) comprehensively analyzed by Field (1965) is frequently considered as a good candidate to explain the planetary nebulae evolution (Hunter & Sofia, 1971), cooling flows (Nulsen, 1986), the formation of the interstellar clouds (Burkert & Lin, 2000), the temperature distribution of the unstable interstellar gas in the Galactic disk (Gazol et al., 2001), the formation of high velocity clouds in galactic corona (Binney et al., 2009) and so on. The most interesting question is a possibilty of the TI development behind shock waves. The analysis of stability in the postshock flow was performed by Shchekinov (1978, 1979) and Chevalier & Imamura (1982). Further progress is reached by Yamada & Nishi (2001), who have analyzed the thermal instability behind radiative shock waves and studied its possible role in the fragmentation. In the numerical simulations the role of thermal instability behind radiative shock waves was studied by many authors (e.g., Binette et al., 1985; David et al., 1988; Sutherland et al., 2003). In the above-metioned papers the radiative shock waves with velocities 150 – 1500 km s-1 are considered. On the other hand the thermal/thermo-reactive instabilities are analyzed in a diffuse interstellar photoionized gas with temperature below K (Corbelli & Ferrara, 1995; Smith et al., 2008). Shock waves with velocities km s-1 are quite important for the evolution of dwarf galaxies. Such shock velocities can be assotiated with global star formation processes and winds in dwarf galaxies. Thus, it is interesting to study both a possibility of the thermal instability and the ionization and thermal evolution in a gas behind shock waves with km s-1.
Such shock waves are belived to play a significant role in the metal enrichment of the intergalactic medium (IGM). Metals (heavy elements) produced by stars are transported into the IGM by shock waves from galaxies and clusters of galaxies (Gnedin, 1998; Madau et al., 2001; Shchekinov, 2002; Aguirre & Schaye, 2009; Meiksin, 2009). The efficiency of metal ejection depends on many factors and parameters, e.g. mass of a parent (for metals) galaxy, star formation rate, density profile etc. On one hand massive galaxies should produce and may throw out a sufficient part of metals because of high velocity shock waves. But on the other the escape velocity is quite high for such galaxies and metals may be confined inside them. Whereas during star formation burst dwarf galaxies can expel major part of their metal products in the IGM (Ferrara et al., 2000). The velocity of shock waves produced by dwarfs is about several dozens km s-1. Low-velocity shock waves do not lead to the radiative precursor formation (Dopita & Sutherland, 1996). The ionizing flux produced by the stellar population of a parent galaxy is expected to be insignificant due to the burst character of star formation process (the massive part of the stellar population explodes as supernovae in a short timescale, whereas low mass stars do not produce sufficient number of ionizing photons). Therefore, the ionization and thermal evolution of gas behind low-velocity shocks is mainly governed by collisions between atoms, ions and electrons.
The dynamics of interstellar/intergalactic gas in general may be understood by studying the ionization states of metals. Indeed, the CIV, NV, and OVI ions are sensitive tracers of hot gas with about several times K (e.g., Edgar & Chevalier, 1986). Using theoretical models Indebetouw & Shull (2004a) have investigated the ionization ratios of the Li-like absorbers CIV, NV and OVI in the Galactic halo, Gnat & Sternberg (2009) have considered the ionic column densities as tracers of the thermal and ionization evolution behind strong radiative shocks with velocities more than hundred km s-1. Shock waves with different velocities can be identified using the spectral lines (Cox & Raymond, 1985). The growth of thermal instabilities can be detected by the associated X-ray and optical-ultraviolet lines (David et al., 1988). The analysis of the observed column densities of ions can give information about interstellar and intergalactic structures (e.g., Fox et al., 2005; Simcoe et al., 2006; Gnat & Sternberg, 2007; Agafonova et al., 2007; Vasiliev et al., 2010). However, significant difficulties are connected to adequate interpretation of the obsevational data. Theoretical models of the ionization mechanisms give different predictions for ions and their ratios (e.g., Spitzer, 1996), and usually the ionic ratios do not remove the ambiguities regarding the ionization conditions (e.g., Indebetouw & Shull, 2004b). But we can expect that ionizaton states of metals may help to recognize shock waves with km s-1 and determine physical conditions in postshock gas.
In this paper we study thermal instability in a collisionally controlled gas behind shock waves with km s-1. A possible influence from external ionizing radiation field will be considered elsewhere. The paper is organized as follows. In Section 2 we briefly describe the details of the model. In Sections 3 and 4 we present our results. In Section 5 we summarize our results.
2 Model description
Here we briefly describe our method of calculation. The full description of the method and the references to the atomic data can be found in Vasiliev (2011). We study the ionization and thermal evolution of a lagrangian element of cooling gas. In our calculations we consider all ionization states of the elements H, He, C, N, O, Ne, Mg, Si and Fe. We take into account the following major processes in a collisinal gas: collisional ionization, radiative and dielectronic recombination as well as charge transfer in collisions with hydrogen and helium atoms and ions.
The system of time-dependent ionization state equations should be complemented by the temperature equation. Neglecting the change of number of particles in the system (for fully ionized hydrogen and helium it remains approximately constant) the gas temperature is determined by
| (1) |
where , and are the electron and total hydrogen number densities, is cooling rate, is a constant equal to for isochoric and for isobaric cooling, is the Boltzman constant. Cooling is isobaric when the cooling time is much greater then the dynamical time of a system, and it is isochoric when the time ratio is opposite, .
The total cooling rate is calculated using the photoionization code CLOUDY (ver. 08.00, Ferland et al., 1998). For the solar metallicity we adopt the abundances reported by Asplund et al. (2005), except Ne for which the enhanced abundance is adopted (Drake & Testa, 2005). In all our calculations we assume the helium mass fraction . We solve a set of 96 coupled equations (95 for ionization states and one for temperature) using a Variable-coefficient Ordinary Differential Equation solver (Brown et al., 1989).
We consider pure collisional ionization model, so we should constrain shock wave velocity by a value that does not lead to the radiative precursor formation. The precusor is photoionized by the radiation field emitted by a shocked gas, and consequently the initial ionization states in gas behind a shock front depends on the spectrum emitted by a shock wave. A stable photoionization precursor will be formed when the ionization front velocity in the gas approaching the shock becomes larger than the shock velocity. This condition is satisfied for shock velocity higher than km s-1 (Dopita & Sutherland, 1996) or shock temperature K. Thus, we study the shock waves with temperature . We constrain our calculations by lower value km s-1 corresponded to K. We assume that the gas temperature just behind a shock front instantaneously becomes equal to , but the ionization composition relaxes from that corresponded to temperature before the front. During the relaxation period a gas cools more efficiently due to higher collisional ionization rates of low ionic states existed in the postshock gas, and the ionization composition tends to fit such thermal evolution. In general, for fixed other paramters (density, metallicity) the ionization composition tends to that at a corresponding temeperature in a gas collisionally cooled from K. However, depending on the relation between and the relaxation period needs different time.
The ionization times of H and He are longer than these of metals, so that the influence of H and He on the thermal evolution of gas just behind a shock is expected to be dominant. As an example Figure 1 presents the H and He ionization states in a gas isochorically cooled from K for , 0.1 and solar metallicities. There is no significant dependence of the hydrogen states on metallicty, in contrast to that the helium states show remarkable distinction. The considerable dependence of the H and He states on temperature is clearly seen. Thus, taking different ionization composition corresponded in a gas before shock wave one can expect differences in the thermal evolution of the postshock gas. But the closer is to , the smaller distinction of the thermal evolution is from that for a gas collisionally cooled from K.
A gas temperature before shock wave can vary in wide range. For example, a gas can be relaxed from some previous shock interaction or heated by galactic or extragalactic ionizing radiation. So it is difficult to choose more or less common initial temperature. The gaseous temperature in HII regions is K, the typical temperature of the IGM is K. To coinstrain calculations we suppose that the initial temperature of a gas before shock wave equals K, and a gas has the ionization composition obtained in the non-equilibrium (time-dependent) model at this temperature and given metallicity. But in several sets of models we study the depedence of the gas evolution on . For these models the ionization composition is corresponded to .

3 Cooling rates and thermal instability

The thermal instability criteria for a gas cooled isochorically and isobarically are (Shchekinov, 1978)
| (2) |
respectively. The isochoric and isobaric cooling rates for a gas cooled from K are close to each other (Gnat & Sternberg, 2007). So that a gas is unstable to isochoric/isobaric perturbations in very close temperature ranges. However, the cooling rate of a gas behind a shock may depend on physical condition in a gas before shock front, e.g. ionization composition and temperature of a gas, so that the temperature range, where a gas becomes thermally unstable, can be modified.
Figure 3 presents the isochoric cooling rates, thermal instability criterion, , and characteristic scale for a gas with , 0.1 and 1 behind a shock with . Below we present our calculations in terms of a shock temperature , where km s-1. Also for a given metallicity the isochoric cooling rate for K, a fiducial model, which corresponds to the tabulated cooling rates (e.g., Sutherland & Dopita, 1993; Gnat & Sternberg, 2007), is plotted by thin solid line. First of all we should note that no significant difference between isobaric and isochoric cooling rates for K is found. So here we present figures for the isochoric case only, but due to the different thermal instability criterion we analyze both cases.

Figure 3(upper panels) shows that the cooling rates for the whole shock temperature range considered here, K, tend to the fiducial one and equal to it at low temperature. For gas with this occurs almost at the due to fast ionization of hydrogen for K and both H and He ionization for higher initial temperature (the vertical part of lines in panel a). For higher metallicity other chemical elements, mainly carbon and oxygen, can dominate in cooling. This is clearly seen in Figure 2, which presents the contributions to the total cooling rate from each chemical element for K (upper panel) and K (lower panel) in a gas with solar metallicity. One note that the difference between cooling rates behind shock waves and the rate for the fiducial model reaches maximum for solar metallicity and depends strongly on , but for any the cooling rates coincide at K. Thus, we can conclude that the cooling rate in a gas behind a shock wave differs considerably from the cooling rate for the fiducial model, K, which is usually used to study the thermal evolution of a gas.
Panels (b) present the value for the considered models. Two horizontal lines correspond to the isobaric/isochoric thermal instability criteria. Note that both criteria are satisfied for the fiducial model at K for any metallicity considered here. For both isobaric and isochoric criteria for the models with K are also satisfied (the region below horizontal lines) in the same temperature range as that for the fiducial model, except for very early evolution of a gas behind shock wave (almost vertical tails of the cooling curves correpond to that period of the evolution). Increase of metallicity leads to widening temperature range, where the isochoric criterion is not satisfied, but does not change the range for the isobaric case. A gas evolved from K is thermally unstable to isobaric perturbations during almost full its evolution. In a gas cooled isochorically the value for the solar metallicity demonstrates a significant difference from that for the fiducial model. The temperature range, where a gas is unstable behind shock waves with K, is very close to that for the fiducial model. But such temperature range becomes narrower for lower , e.g. for K a gas is unstable at K, and for K it proceeds at K. For K a gas remains thermally stable to isochoric perturbations during full its evolution.


Panels (c) present the column density of a gas layer, which can be thermally unstable, , where is the thermal length. We have plotted the dependence of , where the instability criterion is satisfied, namely, for any at K in the isobaric case (shown by thin solid lines) as well as for K in the isochoric one (shown by thick solid lines). Note that the criterion for the fiducial model with K is satisfied for K (dash line). The difference between column densitites for K and these for the fiducial model reaches a factor of 2–3 for , it is maximum for early stages of the evolution, where the cooling rate is changed considerably.
Following Gnat & Sternberg (2007) we consider the transition from isobaric to isochoric cooling for the interaction a shock wave with a cloud in terms of the critical column density, , and temperature, where is a critical size of cloud. Figure 4 present such dependence for the set of models with K (solid lines) and for the fiducial model (dash line) for solar metallicity. The cooling becomes isochoric for temperatures and cloud column densities left and above of the curves. Here , so that should be multiplied by the Mach number for a shock wave with .
In the above-considered set of models we start from the ionization composition corresponded to the K. But a gas behind shock wave can have another ionization composition. Figure 5 presents the isochoric cooling rates, thermal instability criterion and characteristic scale for K depending on the initial ionization composition, which is corresponded to K. Figure 5(upper panel) shows that the cooling rates gradually approach to the fiducial one, the difference is negligible for K. The thermal instability criterion and the value also demonstrate the same behavior.
4 Ionization states and their ratios


Figures 6-8 show the , and ionization ratios in a gas with , 0.1 and 1 metallicities behind a shock wave with . The temperature before a shock wave is taken K. Here we consider isochoric ionization ratios, although the difference from isobaric ratios is non-negligible, their temperature dependences show similar behavior.
The ionization ratios for the metallicities considered here demonstrate a significant dependence on and difference from the ratios in the fiducial model. The difference in some temperature ranges reaches several orders of magnitude. The difference of the ratio increases with the growth of and reach maximum (up to two orders of magnitude) for K in a gas with (see the lower panels in Figures 6-8). Further increase of diminishes the difference rapidly, and the ratios for K almost coincide with the fiducial one. Stronger shock wave (higher ) leads to the ionization of higher states, and the difference from the fiducial model should decrease with the growth . Two other ratios exhibit similar behavior.
The difference of the ionic ratios from the fiducial ones is maximum for the lowest metallicity, . For example, the ratio for K differs about four orders of magnitude from that in the fiducial model. In a solar metallicity gas this difference reaches two orders only. Obviously, the ionic fractions decrease fastly in low metallicity gas (e.g. Gnat & Sternberg, 2007), and the recombination lag increases with the metallicity growth. So the comparison of two ions with large gap between ionization potentials, like CIV and OVI (47.9 and 113.9 eV for CIIICIV and OVOVI, respectively), gives higher values for lower metallicity. Whereas the ratio between CIV and SiIV demonstrate weaker dependence on metallicity due to proximity of their ionization potentials (34 eV for SiIIISiIV).
Such a strong dependence on may lead to some uncertainity or inaccuracy of determining the physical conditions in the postshock gas using the tabulated collisional ionization states (e.g. Sutherland & Dopita, 1993; Gnat & Sternberg, 2007). In the solar metallicity gas the most remarkable dependence is within the temperature range, where the postshock gas can be thermally stable for isochoric perturbations (see Figure 3) and the transition from isobaric to isochoric cooling is more probable (Figure 4). Moreover, the postshock material can be efficiently mixed due to the hydrodynamical instabilities (Slavin et al., 1993; de Avillez & Breitschwerdt, 2009), and a degree of uncertainity of determining the physical conditions may increase. So that the strong dependence of ionic states can hardly help to dicriminate this transition, and it should be taken into account for correct interpretation of observational data and synthetic data models obtained from numerical simulations.
Also we have analyzed the dependence on the initial ionization composition of a gas. Figure 9 shows the same ionization ratios, , and , in a gas behind a shock wave with K for different initial ionization composition corresponded to . The increase of leads to less difference of the ionic ratios from these in the fiducial model. As it is mentioned above such difference is more pronounced for ions with larger deviation in their ionization potentials.
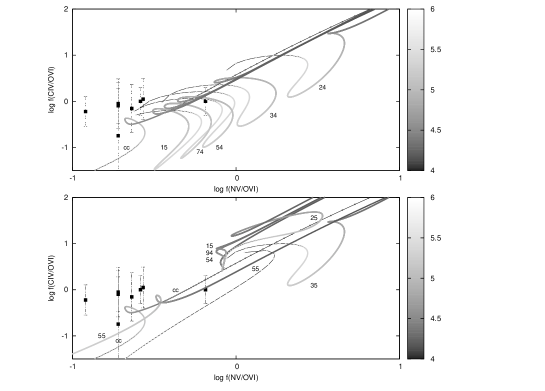
Figure 10 (lower panel) presents the dependence of versus column densities on the temperature behind a shock wave with for a gas with solar metallicity and the initial ionization composition corresponded to K. All tracks start from the same point corresponded to the initial ratio at K. Further evolution depends on collisional ionization rate of ions behind a shock with . As it is expected from the above-mentioned results the tracks differ significantly from the fiducial model: the largest deviation can be found for K, while the tracks for K are close to each other, and the tracks for K becomes closer to that for the fiducial model. The difference becomes negligible at K.
Finally we again consider the dependence on the initial ionization composition of a gas. Figure 10 (upper panel) shows the dependence of the column densities behind a shock wave with K on the initial ionization composition corresponded to . We should note that the tracks for the shock models tends gradually to the fiducial track, but these tracks coincide at K. However, at K a significant difference can be found even for the track K. So that even small deviation of the initial ionic composition leads to remarkably different tracks. In both panels we add the observational data for the high velocity clouds in the Galactic halo (see Table 8 in Fox et al., 2005). Although several tracks are within the errorbars of the observational data, the majority of the points cannot be fitted by any track presented in Figure 10. These observational points are belived to be explained by turbulent mixing behind shock waves (Slavin et al., 1993; de Avillez & Breitschwerdt, 2009).
5 Conclusions
In this paper we have studied the thermal instability, nonequilibrium cooling rates and ionization states in a collisionally controlled gas behind shock waves with km s-1 ( K). Such shock waves do not lead to the radiative precursor formation, and gas evolution is governed by collisions only.
Our results can be summarized as follows.
-
•
The cooling rate in a gas behind shock waves with K differs considerably from the cooling rate for a gas cooled from K.
-
•
The temperature range, where the postshock gas is thermally unstable, is significantly modified and depends on gas metallicity. For both isobaric and isochoric criteria for shock waves with K and K are satisfied in the same temperature range. Increase of metallicity leads to widening temperature range, where the criterion is not fulfilled. For the solar metallicity a gas behind a shock with km s-1 ( K) is thermally unstable to isobaric perturbations during almost full its evolution. But the temperature range, where a gas is unstable to isochoric perturbations, becomes narrower for lower , and a gas remains thermally stable to isochoric perturbations behind shock waves with km s-1 ( K) during full its evolution.
-
•
The column density of a gas layer, which can be thermally unstable, also depends on gas metallicity. The difference between column densitites for K and these for a gas cooled from K reaches a factor of 2–3 for .
-
•
The transition from isobaric to isochoric cooling for a gas with behind shock waves with K proceeds earlier (at lower column density layer) than that occurs in a gas cooled from K.
-
•
The ionic ratios in a gas with behind shock waves with K demonstrate a significant dependence on and difference from the ratios in a gas cooled from K. The difference becomes negligible at K in the metallicity range considered here.
6 Acknowledgements
The author is grateful to Yuri Shchekinov for help and many useful discussions. Gary Ferland and CLOUDY community are acknowledged for creating of the excellent tool for study of the photoionized plasma – CLOUDY code. This work is supported by the RFBR (project codes 09-02-00933, 11-02-90701), by the Federal Agency of Education (project code RNP 2.1.1/1937) and by the Federal Agency of Science and Innovations (project 02.740.11.0247).
References
- Agafonova et al. (2007) Agafonova I. I., Levshakov S. A., Reimers D., Fechner C., Tytler D., Simcoe R. A., & Songaila A., 2007, A&A, 461, 893
- Aguirre & Schaye (2009) Aguirre A. & Schaye J., 2007, EAS, 24, 165
- Asplund et al. (2005) Asplund, M., Grevesse, N., & Sauval, A. J. 2005, in ASP Conf. Ser. 336, Cosmic Abundances as Records of Stellar Evolution and Nucleosynthesis, ed. T. G. Barnes III & F. N. Bash (San Francisco: ASP), 25
- Binette et al. (1985) Binette L., Dopita M.A., Tuohy I.R., 1985, ApJ, 297, 476,
- Binney et al. (2009) Binney J., Nipoti C., Fraternali F., 2009, MNRAS, 397, 1804
- Brown et al. (1989) Brown P. N., Byrne G. D., & Hindmarsh A. C., 1989, SIAM J. Sci. Stat. Comput., 10, 1038
- Burkert & Lin (2000) Burkert A., Lin D.N.C., 2000, ApJ, 537, 270
- Chevalier & Imamura (1982) Chevalier R.A. & Imamura J.N., 1982, ApJ, 261, 543
- Corbelli & Ferrara (1995) Corbelli E., Ferrara A., 1995, ApJ, 447, 708,
- Cox & Raymond (1985) Cox D. P. & Raymond J.C., 1985, ApJ, 298, 651
- David et al. (1988) David L., Bregman J.N., Seab C.G., 1988, ApJ, 329, 66,
- de Avillez & Breitschwerdt (2009) de Avillez M. A. & Breitschwerdt D., 2009, ApJL, 697, 158
- Dopita & Sutherland (1996) Dopita M. A. & Sutherland R. S., 1996, ApJS, 102, 161
- Drake & Testa (2005) Drake J. J. & Testa P., 2005, Nature, 436, 525
- Edgar & Chevalier (1986) Edgar R. J. & Chevalier R. A., 1986, ApJ, 310, L27
- Ferland et al. (1998) Ferland G. J., Korista K. T., Verner D. A., Ferguson J. W., Kingdon J. B. & Verner E. M. 1998, PASP, 110, 761
- Ferrara et al. (2000) Ferrara A., Pettini M., Shchekinov Yu.A., 2000, MNRAS, 319, 539
- Field (1965) Field G. 1965, ApJ, 142, 531
- Fox et al. (2005) Fox A. J., Wakker B. P., Savage B. D., Tripp T. M., Sembach K. R., Bland-Hawthorn J., 2005, ApJ, 630, 332
- Gazol et al. (2001) Gazol A., Vázquez-Semadeni E., Sánchez-Salcedo F.J., Scalo J., 2001, ApJL, 557, 121
- Gnat & Sternberg (2007) Gnat O. & Sternberg A., 2007, ApJS, 168, 213
- Gnat & Sternberg (2009) Gnat O. & Sternberg A., 2009, ApJ, 693, 1514
- Gnedin (1998) Gnedin N. Y., 1998, MNRAS, 294, 407
- Hunter & Sofia (1971) Hunter J.H., Sofia S., 1971, MNRAS, 154, 393
- Indebetouw & Shull (2004a) Indebetouw R. & Shull J.M., 2004, ApJ, 605, 205
- Indebetouw & Shull (2004b) Indebetouw R. & Shull J.M., 2004, ApJ, 607, 309
- Madau et al. (2001) Madau P., Ferrara A., Rees M. J., 2001, ApJ, 555, 92
- Meiksin (2009) Meiksin A. A. 2009, RvMP, 81., 1405
- Nulsen (1986) Nulsen P.E.J., 1986, MNRAS, 221, 377
- Shchekinov (1978) Shchekinov Yu.A., 1978, SvA, 22, 182
- Shchekinov (1979) Shchekinov Yu.A. 1979, Astrophysics, 15, 224
- Shchekinov (2002) Shchekinov Yu. A., 2002, A&AT, 21, 131
- Simcoe et al. (2006) Simcoe R.A., Sargent W.L.W., Rauch M., Becker G., 2006, ApJ, 637, 648
- Slavin et al. (1993) Slavin J. D., Shull J. M., & Begelman M. C. 1993, ApJ, 407, 83
- Smith et al. (2008) Smith B., Sigurdsson S., Abel T., 2008, MNRAS, 385, 143
- Spitzer (1996) Spitzer L., Jr. 1996, ApJ, 458, L29
- Sutherland & Dopita (1993) Sutherland R. S. & Dopita M. A., 1993, ApJS, 88, 253
- Sutherland et al. (2003) Sutherland R.S., Bicknell G.V., Dopita M.A., 2003, ApJ, 591, 238
- Vasiliev (2011) Vasiliev E. O., 2011, MNRAS, 414, 3145
- Vasiliev et al. (2010) Vasiliev E. O., Sethi S. K., Nath B. B., 2010, ApJ, 719, 1343
- Yamada & Nishi (2001) Yamada M. & Nishi R., 2001, ApJ, 547, 99