Orbital and stochastic far-UV variability in the nova-like system V3885 Sgr
Abstract
Highly time-resolved time-tagged FUSE satellite spectroscopic data are analysed to establish the far-ultraviolet (FUV) absorption line characteristics of the nova-like cataclysmic variable binary, V3885 Sgr. We determine the temporal behaviour of low (Ly, Ciii, Niii) and high (Siv, Pv, Ovi) ion species, and highlight corresponding orbital phase modulated changes in these lines. On average the absorption troughs are blueshifted due to a low velocity disc wind outflow. Very rapid ( 5 min) fluctuations in the absorption lines are isolated, which are indicative of stochastic density changes. Doppler tomograms of the FUV lines are calculated which provide evidence for structures where a gas stream interacts with the accretion disc. We conclude that the line depth and velocity changes as a function of orbital phase are consistent with an asymmetry that has its origin in a line-emitting, localised disc-stream interaction region.
keywords:
stars: outflows accretion discs novae: cataclysmic variables stars: mass-loss stars: individual: V3885 Sgr.1 Introduction
Cataclysmic variables (CVs) are mass-exchanging binary stars in which a white dwarf primary accretes material from a late main-sequence secondary. The systems represent an important stage in the life cycle of binary stars undergoing common envelope evolution. Of specific relevance to the investigations presented in this paper is the fact that CVs also provide the setting for some of the most observationally accessible accretion disc-driven outflows in the Universe, since the binary systems are relatively bright and have short ( hours) orbital periods. Outflows in the form of winds with velocities of 1000 km s-1 are evident in almost all high accretion rate CVs, and particularly nova-like and dwarf novae in outburst.
Empirical properties of the high-speed, high-ionization CV winds have been established very effectively from UV line transitions accessible to the IUE, HST and FUSE space borne observatories (see e.g Heap et al. 1978; Cardova & Mason 1982; Hassall et al. 1983; Knigge, Woods & Drew 1995). The observational transition between blueshifted absorption and P Cygni profiles in low inclination (face-on) CVs to broad emission dominated UV lines in more edge-on systems has been interpreted as evidence for the bipolarity of the outflows (e.g. Drew 1987). It is clear however that the morphologies of the UV lines cannot be assumed to be independent of orbital phase or temporal changes. Time-series HST UV and FUSE FUV spectroscopic datasets have revealed extensive variability in the UV resonance lines on hourly time-scales (e.g. Baptista et al. 1995; Prinja et al. 2000; Hartley et al. 2002; Prinja et al. 2003; Froning 2005). The (F)UV time-series studies have revealed an enigmatic variety of characteristics. Several low inclination systems exhibit orbitally modulated, blue-shifted wind features for which the origin of the departure in axisymmetry remains unclear. A few nova-like CVs reveal erratic episodic features that accelerate rapidly across the absorption line profiles; others in contrast have mostly steady wind-formed UV lines. Additional uncertainties concern the origin of thermal emission that produces substantial emission components in CVs viewed at low inclination.
The origin and driving of fast outflows in high-state CVs also remains uncertain, primarily as the effective radiation force in low (e.g. Proga, Stone & Drew, 1997). Though magnetic fields and thermal expansion have been considered as mechanisms for potentially driving the disc winds, line-driven models are currently the more fully developed in the context of bipolar CV winds, and in the hydrodynamic and magneto-hydrodynamic limits (see e.g. Proga 2005). Proga, Stone & Drew (1997) also highlighted the potentially unsteady nature of the line-driven disc winds, with the consequent rise due to instabilities of (stochastic) rapidly evolving (over several minutes) clumps of gas; however in contrast the hydrodynamical models of Pereyra, Kallman & Blondin (1997) indicate more stable outflows. Theoretical predictions of unsteady disc outflows are interesting in the context of the rapid FUSE FUV spectroscopy presented here.
1.1 Nova-like target V3885 Sgr
We present here a study of the nova-like system V3885 Sgr, based on highly time-resolved FUSE datasets. We aim to investigate systematic changes in the UV lines and bipolar disc wind on orbital and rapid ( few minutes) time-scales. We examine whether orbital-related changes are present and examine causal connections to an axi-symmetry of the entire bipolar outflow. The alternative of a non-wind departure of symmetry due to line-emitting hots spots or disc residing structures is also investigated.
V3885 Sgr is a bright, non-eclipsing CV (e.g. Warner 1995). The recent studies of Ribeiro & Diaz (2007) and Linnell et al. (2009) have provided firm values for the orbital, disc and binary parameters. Some adopted values are listed in Table 1.
| Parameter | Value | Reference |
|---|---|---|
| Orbital Period | 0.20716 days | Ribeiro & Diaz (2007) |
| Inclination | 65o 2o | Linnell et al. (2009) |
| Systemic velocity | 45 km s-1 | Ribeiro & Diaz (2007) |
Linnell et al. also provide an extensive line list for the FUSE spectrum of V3885 Sgr. The disc wind in V3885 Sgr was previously studied by Hartley et al. (2002), using HST STIS data to provide some evidence for rapid ( 100 sec) variations in the Nv, Siiv and Civ P Cygni lines; their dataset was not extensive enough to examine orbitally modulated behaviour.
.
2 FUSE time-tagged dataset
The FUSE satellite instruments are described in detail by Moos et al. (2000). Four spectra (SiC1, SiC2, LiF1, LiF2) are imaged in two segments (A and B). The total of eight segments covers a spectral range from 905Å to 1187Å, with sufficient overlap between individual segments. Our observations of V3885 Sgr were obtained in time-tag (TTAG) mode, so that the arrival times of photons are recorded. The data were secured through the large aperture (30" 30") and then extracted in 100 sec bins. The original exposure times of the three raw exposures re-reduced for this project were 12,900 sec (Prog. ID P197; Malina; 2000 May 24) and 8300 sec and 71000 sec (Prog. ID D905; Froning; 2003 September 21/22). After excluding a few very noisy spectra, the final dataset analysed comprises 126 FUSE spectra spanning 11.7 hours on 2000 May 24 (‘Obs1’) and 155 spectra over 25.7 hours between 2003 September 21/22 (‘Obs2’). The time-sequence in Obs 2 is interrupted by a data gap of 17.6 hours. The spectral resolution of an individual spectrum is 0.1 Å, with continuum signal-to-noise 10.
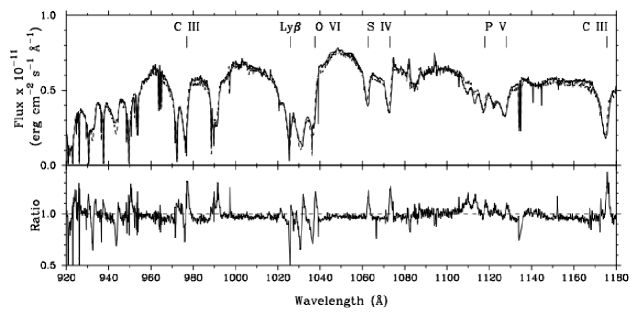
The mean spectrum for Obs1 and Obs2 is shown in Fig. 1. A familiar set of high-state CV lines are seen. The lower plot is Fig. 1 shows the ratio of the two mean profiles from 2000 and 2003, and demonstrates that line profile variability is extensive across the FUSE range. In contrast the continuum flux levels agree well over the almost 3 year time-span between.
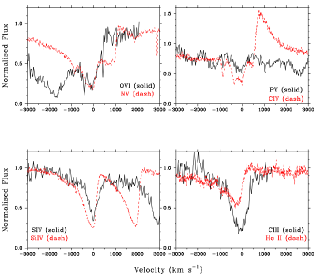
Close-up views of key spectral lines are shown in Fig. 2, where line profiles from a representative individual FUSE spectrum are show, together with UV profiles from HST STIS (Prog. i.d. O5BI06010; 2000 November 13; described in detail by Hartley et al. 2002). Additional individual spectra are also shown later in Fig. 9. The maximum blueward velocity of the lines does not differ significantly between the high ions (Oiv, Nv) and low ion species (Heii, Ciii). (Note that from herein the data have been corrected for a systemic (white dwarf) velocity of 45 km s-1; see Table 1). Oiv, Nv, Siv, Siiv, Ciii all exhibit some blueward asymmetry. One of our goals here is to assess what component of the variable total absorption is non-outflow, i.e. due to accretion disc-stream interaction instead. The individual FUSE spectra from 2000 and 2003 do not exhibit any cases of strong emission components with respect to the local continuum. The CIV 1550 resonance line is undoubtedly wind-formed and is the only spectral line in V3885 Sgr to reveal an unambiguous emission feature (see also Hartley et al. 2002).
3 Variability characteristics
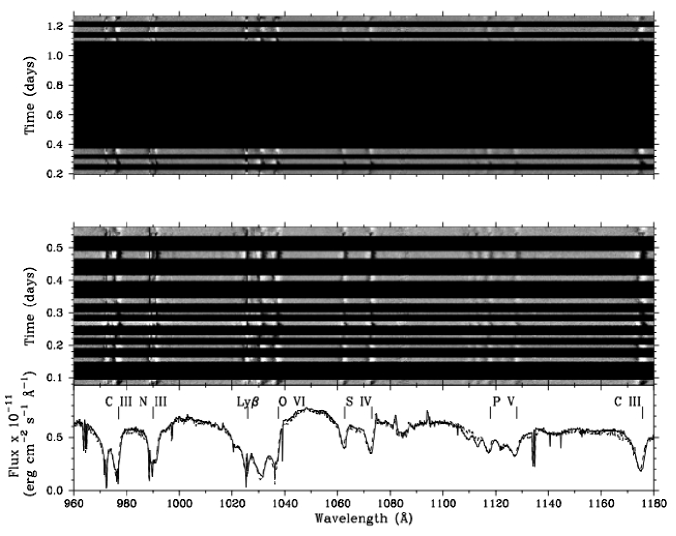
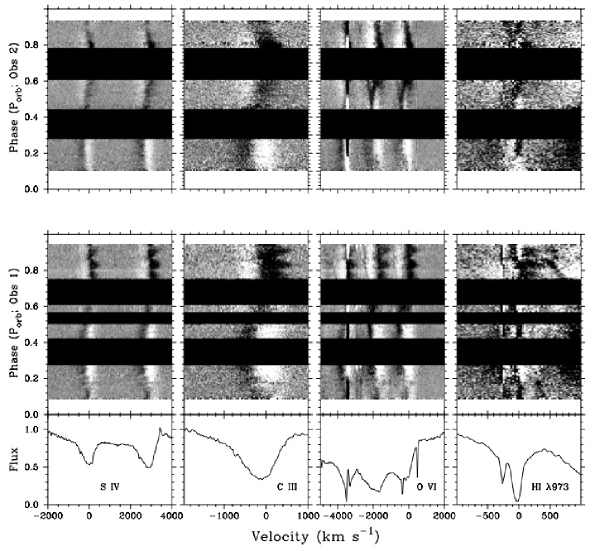
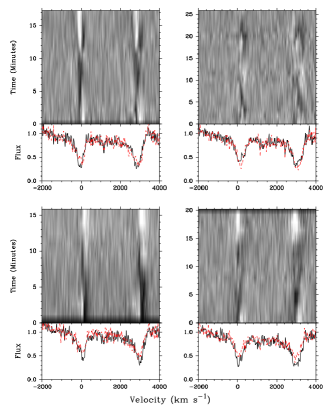
The FUSE data sets of V3885 Sgr assembled here permit us to explore variability across a wide range of spectral lines, covering low and high ions. To globally compare the temporal behaviour of the lines, dynamic spectra (grey-scale images) were constructed covering the entire TTAG datasets for Obs1 and Obs2. The respective images are shown in Fig. 3, as a function of time. To enhance the contrast in the relative profile changes, quotients are shown between the individual TTAG spectra and the respective (Obs1 or Obs2) overall mean spectrum. As was the case in our previous studies (e.g. Prinja et al. 2003, RW Sex; Prinja et al. 2004, V592 Cas), almost every reasonably developed absorption line in V3885 Sgr is varying, and the changes are in concert between low and high ionization species. The ‘twisted’ black and white tracks seen in the images in Fig. 3 correspond well between the different lines, and are indicative of an ‘S-wave’ type velocity motion of the absorption lines (see Sect 3.1).
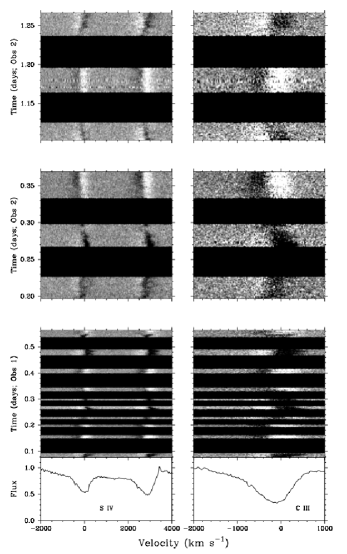
The time-variability evident in Siv 1063, 1073 and Ciii 1176 is shown in closer detail in Fig. 4, this time as a function of velocity. The behaviour agrees very well between the two lines. Systematic changes are seen both blueward and redward of the rest velocity, but with a greater blueward extension to 500 km s-1. The motion demonstrated here over the hourly time-scales is a velocity swaying of the entire absorption profiles, as opposed to changes confined to the line wings or localised optical depth structure moving across the troughs.
To estimate the significance of the line profile variability as a function of velocity, we applied the temporal variance spectrum (TVS) analyses (see e.g. e.g. Fullerton et al. 1996), and computed for each spectral line:
| (1) |
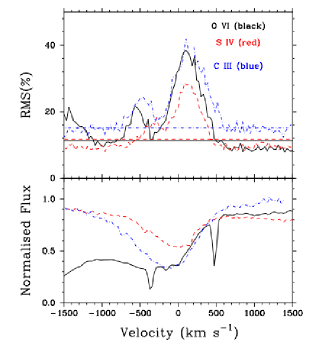
where is the normalized intensity of the th pixel in the th spectrum, is the weighted mean of the normalized intensity, is the inverse of of spectrum measured in an adjacent continuum band, and . The results are shown as root mean square percentages (= TVS 100) in Fig. 5. The RMS changes agree very well in structure, amplitude and velocity range between Ovi, Siv and Ciii. There are two distinct components to the variability; (i) variance almost symmetric about rest velocity, and extending to 400 km s-1, though perhaps more redward than this range in Ciii. We attribute this component of the TVS to the corresponding velocity movement of the the lines, which provides the dominant S-wave pattern seen in Fig. 4. (ii) A weaker more blueward variance between 400 km s-1 to 700 km s-1. Note that the absorptive line features in the FUV spectrum of V3885 Sgr have a greater redward extent than e.g. was the case in V592 Cas, RW Sex, BZ Cam (see references in Sect. 1).
3.1 Orbital Phased-modulated behaviour
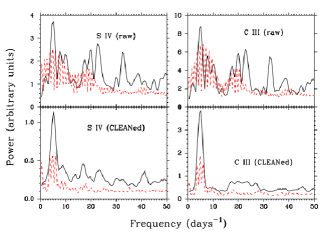
The time-scales of variability evident in Figs. 3 and 4 are commensurate with the generally accepted orbital period of V3885 Sgr of 0.207 days (Table 1). Our time-series dataset of V592 Cas is not as extended as previous (optical) studies of this system that have established orbital parameters, especially in the case of Obs2. Nevertheless, we conducted a periodogram analysis to parameterise the apparent cyclic behaviour. The TTAG datasets for the Siv 1063 and Ciii 1176 lines were Fourier analysed using the iterative CLEAN algorithm (Roberts, Lehár & Dreher 1987) to deconvolve the features of the window function from the discrete Fourier transform. (A gain of 0.5 with 100 iterations was used.) The frequency range sampled by the data from 0.5 days-1 to 50 days-1 was examined for periodic signals. The only potentially significant peaks in the resulting power spectra (see Fig. 6) are at 4.940 day-1 (Ciii; Obs1), 5.206 day-1 (Siv; Obs1), 4.853 day-1 (Ciii; Obs2), and 4.837 day-1 (Siv; Obs2). We give greater weight to the more continuously sampled results from Obs1, where the mean frequency corresponds to a period of 0.197 days. We estimate a 30% uncertainty in these frequencies based on the half-width at half-maximum of the zeroth order peak of the window function Fourier transform. The 0.197 day period is repeated over about 2.5 cycles during the full span of the observations in Obs1. We conclude that the major systematic hourly variations seen in the FUV lines of V3885 Sgr are modulated on the orbital period of the system.
Grey-scale representations of the individual quotient (with respect to the mean) line profiles are shown in Fig. 7 phased on the generally accepted orbital period (0.207 day; Table 1). The data for Siv and Ciii have been phased using the accurate long-term ephemeris of Ribeiro & Diaz (2007) which is based on optical spectroscopy obtained between 1999 and 2002, i.e. straddling the epochs of our FUSE datasets; Sect. 2. In Fig. 7, Phase = 0 corresponds to the +ve to ve crossing in velocity of radial velocity curves for the lines in Ribeiro & Diaz (2007). The cyclic modulation has a greater blueward extent, but the changes are also clearly shallower in optical depth on the blueward side, between 0 and 300 km s-1. The strongest variations are close to or at rest velocity.
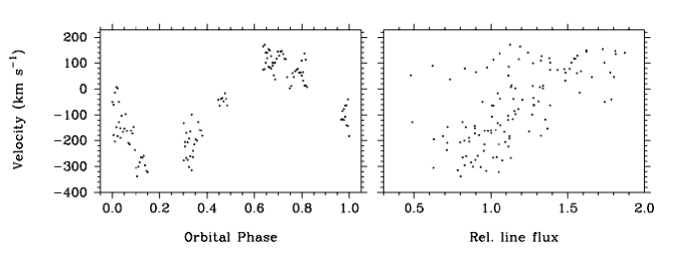
The line changes in V3885 Sgr were also measured by (least-squares) fitting the Siv 1062.66 component with single Gaussian model profiles, to record the central velocity, width and relative flux of the line. The blue component of this doublet is relatively free of emission features and the central absorption trough is well matched by the adopted Gaussian profile. The central velocities determined from the profile fits are plotted as a function of orbital phase in Fig. 8; the velocity shift toward the blueward side is about 100 km s-1 greater than the redward motion (left-panel). Though there is some scatter, the Gaussian fits also suggest that the strength of the FUV absorption lines is greater at redward velocities. the line shifts toward blueward velocities (right-hand panel). The line-of-sight velocity dispersion is also variable, as indicated by the full-width at half-maximum of the fitted profile in Siv, which vary between 200 km s-1 to 550 km s-1; there is however no obvious trend with orbital phase.
3.2 Rapid variability
Our FUSE dataset has established that the FUV resonance and other absorption lines in V3885 Sgr vary cyclically on the orbital period. The variation is characterised by velocity shifts of several 100 km s-1 and the optical depth changes are stronger close to rest velocity than at blueward velocities. One of the drivers for assembling FUSE TTAG datasets of V3885 Sgr in 100 sec. bins is to search for evidence of very rapid ( minutes) line profile changes. Fluctuations on this short time-scale may betray clumped gas arising from instabilities in the line-driven disc wind (see e.g. the predictions of Proga, Stone & Drew 1998), or perhaps stochastic changes associated with other line absorbing structures such as the accretion stream. It is interesting to note that there is sub-structure within the overall modulation. See for example the data between phases 0.75 and 0.9 in Obs1 in Fig 7. The ‘jagged’ structure seen here is very well mimicked between the Siv doublets and also in Ciii.
Our approach was to first ‘subtract’ the primary orbital modulation of the lines and then examine the residual spectra for very short time-scale changes (i.e. less than 10% of the orbital period). The dataset in Obs1 was isolated into 10 different time-bins, that are defined by continuous runs of data, each with no gaps greater than 0.03 days. These continuous data bins are in fact seen in the lower grey-scale images in Figs. 3 and 4, each separated by a black data gap. The individual TTAG spectrum in each of these 10 bins was then divided by the corresponding mean for the respective bins. These mean profiles can be considered as representative of the average line over 5% to 7% of the orbital period. Figure 9 shows dynamic spectra for the quotient Siv doublet lines taken from 4 of the 10 continuous data bins, where additional very rapid variability is clearly present. These images, and the pair of line profiles shown below the grey-scales, point to optical depth and velocity changes occurring on time-scales down to 5 minutes or less. The upper-right panel in Fig. 9, for example, shows two discrete ‘events’ lasting over about 7 minutes (i.e. 2% of the orbital period). These changes clearly do not follow the sinusoid of the overall orbital motion (which we have in any case ‘removed’ to the 1st order). These short-timescale variations are also evident in a correlated manner in high ion species such as the Ovi doublet (see Fig. 7; Obs 1 data at phase 0.8 to 0.82). The correspondence between different lines suggests the rapid variability is due to density fluctuations as opposed to changes in the ionization state.
4 Doppler tomography of Siv absorption
The image reconstruction method known as Doppler tomography has provided 2D and 3D images of the velocity flows in a range of interacting binaries (e.g., Marsh & Horne 1988; Richards, Albright & Bowles 1995; Richards, Sharova and Agafonov 2010). It has been applied to CVs, X-ray and gamma-ray binaries, RS CVn binaries, and Algol-type binaries. A diverse set of circumstellar structures has been identified in the tomograms including the gravitational stream of gas from the L1 point towards the mass gaining star, a transient or classical accretion disc, shock regions associated with interactions between the gas stream and the disc, an accretion annulus representing regions where the gas has slowed down after circling the mass gainer, and often emission sources indicative of magnetic phenomena such as prominences and coronal mass ejections.
Hartley et al. (2005) created Doppler tomograms of V3885 Sgr from H, H, and Hei 4472 spectra collected in 2003 Sep, and interpreted the results in terms of emission from an accretion disc. They noted that the disc flow pattern could be explained either by spiral shocks or by the tidally-thickened regions of the outer disc being illuminated by light from the inner disc or boundary layer. In addition, Ribiero and Diaz (2007) created tomograms of V3885 Sgr based on H and Hei 6678 spectra collected from 1999 Sep to 2002 Jun. The H image was dominated by emission from the mass donor, while the Hei 6678 image showed evidence of the accretion disc as well as emission from the mass donor. These papers have shown that the tomography technique is a very convenient way of looking at the complex line profile data in V3885. The technique has been used in the case of Algol binaries to explore the velocity regime in the cases of both optically thin and optically thick lines (e.g., CX Dra, Richards et al. 2000; and TT Hya, Miller et al. 2007) with results that are consistent with the observed spectra. Applying the tomography technique to optically thick line profiles containing non-negligible emission components is challenging because of the degeneracy between optical depth and emissivity embedded in the Fourier slice theorem (also known as the Radon transform). A careful interpretation of the results is essential in these cases to demonstrate the reliability of the tomography results.
| Parameter | Value |
|---|---|
| Orbital Period | 0.2071607 days |
| Systemic velocity | 45 km s-1 |
| Mass ratio, | 0.679 |
| Primary velocity amplitude K1 | 139 km s-1 |
| Secondary velocity amplitude K2 | 205 km s-1 |
| Mass of primary | 0.7 M⊙ |
| Radius of primary | 0.02 R⊙ |
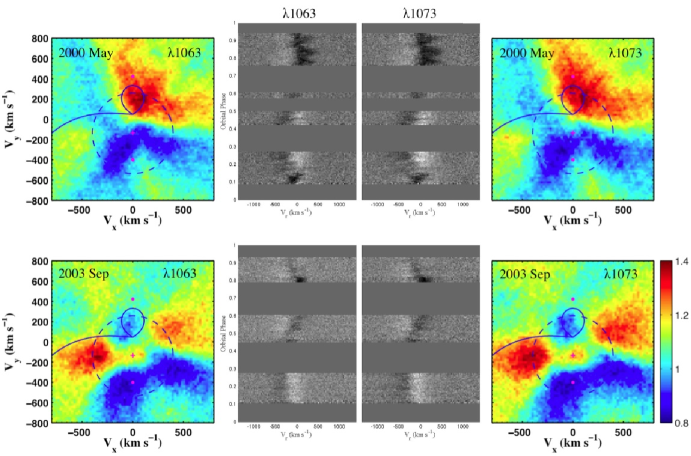
We explore here whether tomography can offer any constraints on the line formation regions of the variable FUV absorption in V3885 Sgr. We add the caveat that the line formation of the FUV resonance lines is likely to be complex due to contributions from multiple physical sources such as the disc, discstream interaction, and the outflow. Two dimensional images of V3885 Sgr were calculated using a back-projection tomography code (e.g. Richards 2004). Since the observed Siv doublet profiles are dominated by absorption, the tomograms were made from difference profiles by subtracting the mean spectrum for each epoch (Obs1, Obs2) from each respective observed spectrum. The coverage afforded by our FUSE time-series is reasonably complete in phase except for phases 0.30.4 and 0.60.7 (e.g. Fig. 7), and high resolution spectra collected around the orbit of the binary are required to produce a good image. Tomograms were calculated from Siv 1063, 1073 spectra collected during observing runs on 2000 May 24 (Obs1) and 2003 Sep. 21/22 (Obs2). The parameters of V3885 Sgr adopted for the calculation are listed in Table 2. The Doppler maps based on the Siv difference spectra are shown in Fig. 10 and reveal the line emission regions in Doppler coordinates (,), where low velocity patterns correspond to the inner regions of the images, and high velocity parts of the inner disc are mapped to the outer portions of the tomograms.
The tomograms reveal closely corresponding structures for the separate 1063 (blue) and 1073 (red) components of the Siv doublet, although the absorption features in the blue difference spectra were typically weaker than in the red spectra. There are similarities between the tomograms derived at the two epochs, which is expected since the orbital modulation is present at both epochs (e.g. Fig. 7). However, some clear differences are evident. For example, the intense emission source seen in Obs1 near the velocity of the mass donor (at 0 to 100 km s-1 and 200 to 500 km s-1) is significantly reduced in Obs2 (see Fig. 10). During Obs2, the most intense emission arose from two regions on opposing sides of the accretion disc around the white dwarf with velocities of 250 to 700 km/s and +300 to 700 km/s. The blueshifted region is close to where the gas stream would interact with the accretion disc, and the redshifted part can be viewed half an orbit away, as emission from the stream-disk impact region moving away from us.
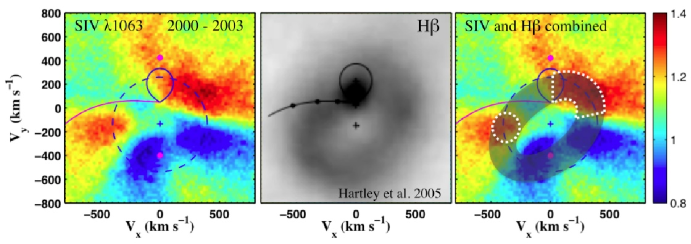
Fig. 11 shows the comparison between the Siv tomograms and the H tomograms from Hartley et al. (2005). The main difference between the images results from the incomplete phase coverage for the Siv data. However, the most intense parts of the Siv tomograms overlap with the brightest parts of the accretion disc identified in the H tomograms. The regions of overlap are illustrated by the dashed areas on the image in the right frame of Fig. 11. The trailed spectrograms of the Siv lines display an S-wave pattern suggesting that a complete data set might produce a more disk-like image as seen in the H tomogram.
5 Discussion
We have analysed the FUV absorption line characteristics of the nova-like CV V3885 Sgr. FUSE satellite spectra secured in TTAG mode were extracted in 100 sec bins to provide intensive time-series datasets comprising of 126 spectra in 2000 May and 155 spectra in 2003 September. All the well developed absorption lines in the FUSE range are tightly modulated on the system orbital period of 0.207 days. The TTAG data additionally reveal very rapid ( 5 to 10 mins) fluctuations in the absorption lines, which are indicative of stochastic density changes. We have calculated the first FUV Doppler tomograms of V3885 Sgr and highlight a variable line-emitting source where the gas stream from the secondary interacts with the accretion disc. The FUV lines are on average blueshifted thus suggesting a disc outflow is also present (see e.g. Fig. 2 and HST data of Hartley et al. 2002).
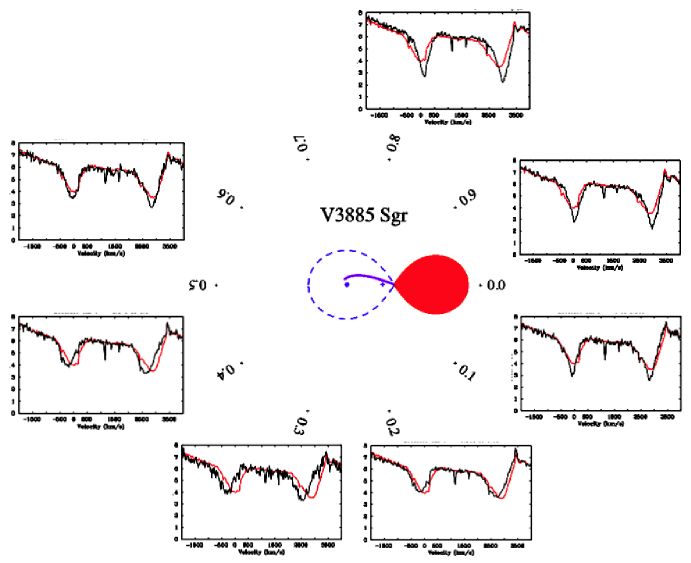
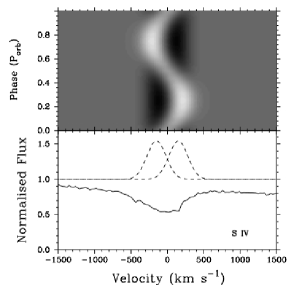
The orbital phase dependent behaviour of the FUV lines is summarised in Fig. 12 where we show phased-binned Siv doublet profiles compared to the mean profile, for the dataset of 2000 May (Obs1). The variable line profile morphology is illustrated clearly. The absorption is narrower and deeper at the most redward velocities (phase 0.75), and the absorption is shallower when most blueshifted (phase 0.25). The orbital phase-dependent changes in line velocity and optical depth are in concert for a very wide range of ion species, including low ions such as Ly, Ciii, NIII and high ionization lines of Pv and Ovi. This correspondence suggests that the FUV lines have the same physical origin or that the material generating them is coherent enough to supply low and high ionization regions. The Monte Carlo based radiative transfer models of Long & Knigge (2002) predict the thermal and ionization structures of disc winds in CVs. The disc and wind models, with plausible mass accretion rates, provide simulations that can successfully reproduce multiple lines in high state systems. The models can match the general cases where Civ and Nv are observed as well developed P Cygni profiles, and lower ion lines such as Ciii and Niii appear in absorption only.
More problematic for the line-driven disc wind model is the origin of the axisymmetry that results in orbital modulation of all the wind-formed lines. Time-resolved FUSE spectroscopy of other non-eclipsing nova-like CVs has also revealed modulation on the orbital period (e.g. RW Sex, Prinja et al. 2003; V592 Cas, Prinja et al. 2004). In the case of V3885 Sgr presented here it is difficult to imagine a scenario where the orbital-phase modulations in UV lines are entirely to due an asymmetry that has a wind-only origin. There is no clear mechanism for shifting the velocities of the entire bipolar outflow that arises in the inner disc by several 100 km s-1 in a cyclic manner on the orbital period.
We propose that it is more plausible that the orbital behaviour of the FUV lines in V3885 Sgr is due to interaction(s) between the disc and the mass accreting stream from the donor secondary. A disc-stream interaction region, such as line emitting hot spot, may be highlighted in the Doppler tomography presented in Sect. 4. Also revealing in this context are the line depth changes as a function of velocity and orbital phase (Figs. 8 and 12). We interpret that a relatively steady component of the blueshifted absorption lines arises from a slow (few 100 km s-1) disc wind in V3885 Sgr. The source of the orbital changes in the lines may then be due to a disc-residing emission-line hot spot. We draw some parallels here with the study of Long et al. (2009) of the dwarf nova VW Hyi in quiescence. Long et al. propose that significant emission in the FUSE range may arise due to a 25,000 K hot spot where the material from the secondary encounters the disc. In the context of V3885 Sgr, at phase 0.25 the emission source due to a hot spot has a maximum positive velocity ( 150 km s-1, see e.g. Fig. 8). The superposition of this emission component on an ‘underlying’ disk wind absorption has the effect of ‘filling in’ the very low to rest velocity regions of the absorption trough, while the high velocity absorption ( 200 km s-1) is relatively unaffected. In contrast at phase 0.75 the emission due to a hot spot has maximum blueward velocity, and thus the high velocity absorption is now affected, while the absorption depth of the lowest velocity regions of the profile remains comparatively high (e.g. Fig. 12).
We attempted a simple illustration of this scenario by adopting a Gaussian profile (FWHM = 300 km s-1; peak flux above continuum = 1.5) to crudely represent the emission component from a localised disc-stream interaction region, such as a hot spot. The Gaussian profile velocity was shifted as a function of orbital phase with a semi-amplitude of 150 km s-1 (phase = 0 corresponds to red to blue crossing, and maximum redward and blueward velocities occur at phases 0.25 and 0.75, respectively). The product of the emission profile and the mean Siv 1063 profile observed in Obs1 was then used to form a short ‘time-series’. The line profiles generated essentially approximate a steady low velocity outflow with a superimposed disc residing emission source. The phase-dependent behaviour of the emission line source is shown in Fig. 13. Though we have simply assumed a fixed emission strength and width (see counter evidence in Sect. 3.1), the grey-scale image in Fig. 13 nevertheless reproduces the empirical result that the redward absorption between 0 and 300 km s-1 is weaker at phase 0.25 and more enhanced at phase 0.75 (cf. Figs. 7 and 8). A more accurate reproduction of the behaviour observed in V3885 Sgr would require ad-hoc reduction of the blueward emission line strength at phase 0.75. Ultimately it would be necessary to examine the line formation and dynamics of a localised disc residing emission source that in effect acts as the lower boundary to the ‘overlying’ disc wind in V3885 Sgr. We conclude meanwhile that the orbital phase behaviour of FUV absorption lines in V3885 Sgr is not due to an asymmetry in the disc wind. The line profile variability more likely betrays a line emission source associated with a localised region where gas from the secondary interacts with the accretion disc.
6 Concluding summary
We have analysed the variability characteristics of FUSE (TTAG) time-series spectra of the non-eclipsing, nova-like system V3885 Sgr. The data were secured over two epochs in 2000 and 2003. Our key results are:
(i) The low (Ciii), intermediate (Siv) and high (Pv, Ovi) ionization lines vary in a tightly corresponding manner, on time-scales of a fraction of the system orbital period ( 0.21 days).
(ii) The line profile variability is predominantly orbital-phase modulated, with a S-wave velocity motion of the observed absorption troughs over a range of 200 km s-1 to +200 km s-1.
(iii) For phase = 0 corresponding to the +ve to ve crossing of the spectral lines, the maximum blueward velocity occurs at phase 0.25 and the maximum redward displacement is at 0.75.
(iv) In addition to the orbital modulations, stochastic line profile changes are evident on time-scale down to 3 minutes. We associate these events with instabilities in the accretion stream or disc wind.
(v) We have derived the first FUV tomograms of V3385 Sgr, to complement previously published tomography based on optical spectra. With the caveat that the FUV lines likely arise from multiple line formation regions, we find evidence in the tomograms for structures forming where the gas stream interacts with the accretion disc.
(vi) We favour a scenario where localised disc-stream interaction generates a line-emitting source, and thus provides the dominant axisymmetry for orbital modulated FUV line profile behaviour in V3885 Sgr.
Acknowledgements
This research was partially supported by NSF grant AST-0908440 to MTR. LWP acknowledges support from STFC studentship. We thank an anonymous referee for helpful suggestions that improved this paper.
References
- [1] Agafonov M.I., Sharova O.I, Richards M.T., 2009, ApJ, 690, 1730
- [2] Baptista R., Horne K., Hilditch R.W., Mason K.O., Drew J.E., 1995, ApJ, 448, 395
- [3] Córdova F., Mason K.O., 1982, ApJ, 260, 716
- [4] Drew J.E., 1987, MNRAS, 224, 595
- [5] Froning C.S., 2005, in The Astrophysics of Cataclysmic Variables and Related Objects, ASP Conf. Series, Vol. 330, 81, eds J.M. Hameury and J.P. Lastoa, San Francisco
- [6] Fullerton A.W., Gies D.R., Bolton C.T, 1996, ApJS, 103, 475
- [7] Hartley L.E., Drew J.E. Long K.S., Knigge C., Proga D., 2002, MNRAS, 332, 127
- [8] Hartley L.E., Murray J.R., Drew J.E., Long K.S., 2005, MNRAS, 363, 285
- [9] Hassall B.J.M, Pringle J.E., Schwarzenberg-Czerny A., Wade R.A., Whelan J.A.J., Hill P.W., 1983, MNRAS, 203, 865
- [10] Heap S.R. et al., 1978, Nature, 275, 385
- [11] Knigge C., Woods J.A., Drew J.E., 1995, MNRAS, 273, 225
- [12] Linnell A.P., Godon P., Hubeny I., Sion E.M., Szkody P., Barrett P.E., 2009, ApJ, 703, 1839
- [13] Long K.S., Knigge C., 2002, ApJ, 579, 725
- [14] Long K.S., Gänsicke, B.T., Knigge, C., Froning, C.S., Monrad, B., 2009, ApJ, 697, 1512
- [15] Marsh T.R., Horne K., 1988, MNRAS, 235, 269
- [16] Miller B., Budaj J., Richards M.T., Koubský P., Peters G.J., 2007, ApJ, 656, 1075, 1091
- [17] Moos H.W, et al., 2000, ApJ, 538, L1
- [18] Pereyra N.A., Kallman T.R., Blondin J.M., 1997, ApJ, 477, 368
- [19] Prinja R.K., Ringwald F.A., Wade R.A., Knigge C., 2000, MNRAS, 312, 316
- [20] Prinja R.K., Long K.S., Froning C.S., Knigge C., Witherick D.K., Clark J.S., Ringwald F.A., 2003, MNRAS, 340, 551
- [21] Prinja R.K, Knigge C., Witherick D.K., Long K.S., Brammer G., 2004, 355, 137
- [22] Proga D., 2005, in The Astrophysics of Cataclysmic Variables and Related Objects, ASP Conf. Series, Vol. 330, 103, eds J.M. Hameury and J.P. Lastoa, San Francisco
- [23] Proga D., Stone J.M., Drew J.E., 1997, MNRAS, 295, 595
- [24] Ribeiro F., Diaz M.P., 2007, ApJ, 133, 2659
- [25] Richards M.T., 2004, AN, 325, 229
- [26] Richards M.T., Albright G.E., Bowles L.M., 1995, ApJ, 438, L103
- [27] Richards M.T., Sharova O.I., Agafonov M.I., 2010, ApJ, 720, 996
- [28] Warner B., 1995, Cataclysmic Variable Stars; Cambridge: CUP