Study of Diboson Production at CMS
Abstract
I present an overview of the measurements of the diboson (, , , , and ) production cross sections in proton-proton collisions at TeV. The measurements are based on 36 and 1.1 of data collected with the CMS detector at the LHC in 2010 and 2011, respectively. The vector bosons and are reconstructed in purely leptonic decays. The measured cross sections are compared with the Standard Model expectations calculated at next-to-leading order in perturbative QCD. Limits on anomalous triple gauge boson couplings are derived.
I Introduction
The gauge boson self-interactions appear as vertices involving three or four gauge bosons. The study of diboson production in proton-proton collisions is an important test of the standard model (SM) because of its sensitivity to the self-interaction between gauge bosons via trilinear gauge couplings (TGC). The values of these couplings are fully fixed in the SM by the gauge structure of the Lagrangian. Any deviation, manifested as an increased cross section, would indicate new physics. Understanding diboson production is also important for Higgs boson searches, because electroweak and production are irreducible backgrounds for high mass Higgs.
II CMS Detector
A detailed description of the CMS detector can be found elsewhere :2008zzk . The layout comprises a superconducting solenoid providing a uniform magnetic field of 3.8 T. The bore of the solenoid is instrumented with various particle detection systems. The inner tracking system is composed of a pixel detector with three barrel layers at radii between 4.4 and 10.2 cm and a silicon strip tracker with 10 barrel detection layers extending outwards to a radius of 1.1 m. Each system is completed by two end caps, extending the acceptance up to . A lead tungstate crystal electromagnetic calorimeter with fine transverse () granularity and a brass-scintillator hadronic calorimeter surround the tracking volume and cover the region . The steel return yoke outside the solenoid is in turn instrumented with gas detectors which are used to identify muons in the range . The barrel region is covered by drift tube chambers and the end cap region by cathode strip chambers, each complemented by resistive plate chambers.
III Measurement of the cross section
This measurement is based on data taken in 2011 corresponding to an integrated luminosity () of 1.1 . A similar analysis using 35 of 2010 data is described in Ref. Chatrchyan201125 . The fully leptonic final state consists of two oppositely charged leptons and large missing energy from the two undetectable neutrinos. Events are selected using triggers that require the presence of one or two high- leptons (electrons or muons). Lepton candidates are then reconstructed offline and events with two oppositely charged, high-, isolated leptons (, , ) are chosen using the following criteria:
-
•
Leading lepton GeV, second lepton GeV.
-
•
To reject Drell-Yan events with mismeasured associated with poorly reconstructed leptons, we use the projected which is the component of transverse to the closest lepton if , and the full otherwise. Events are required to have projected above 40 GeV in the and final states, and above 20 GeV for the final state. These requirements remove more than 99% of the Drell-Yan background.
-
•
To further minimize the Drell-Yan background, events with same flavor leptons with a dilepton invariant mass within GeV of the mass are rejected. Also for this final state, require for the most energetic jet with GeV to cope with the +1 jet background.
-
•
Veto events with one or more jets with GeV to suppress the +jets and top backgrounds. To further reduce the top quark background, apply a top veto based on soft-muon and -jet tagging.
-
•
Background contribution from and diboson processes is reduced by rejecting events which have an additional third lepton passing identification and isolation requirements.
The above steps are described in detail in Ref. HWWAnalysis .
The backgrounds include: and multi-jet events where at
least one of the jets is misidentified as a lepton, top production (
and ), the process, and other diboson processes
(, and ).
A combination of data-driven methods and detailed Monte Carlo (MC)
simulation studies are used to estimate background contributions.
The following backgrounds are estimated from data: , QCD,
, top, and .
The remaining background contributions, and ,
are taken from simulation.
| Sample | Yield |
|---|---|
| 349.7 30.3 | |
| 17.2 1.6 | |
| 106.9 38.9 | |
| 63.8 15.9 | |
| 12.2 5.3 | |
| 1.6 0.4 | |
| / not in | 8.5 0.9 |
| 8.7 1.7 | |
| signal + background | 569 52 |
| Data | 626 |
| Source | non- resonant | top | DY | ||||
|---|---|---|---|---|---|---|---|
| Luminosity | — | — | 6 | — | — | — | 6 |
| Trigger efficiencies | 1.5 | 1.5 | 1.5 | — | — | — | 1.5 |
| Muon efficiency | 1.5 | 1.5 | 1.5 | — | — | — | 1.5 |
| Electron id efficiency | 2.5 | 2.5 | 2.5 | — | — | — | 2.5 |
| Momentum scale | 1.5 | 1.5 | 1.5 | — | — | — | 1.5 |
| resolution | 2.0 | 2.0 | 2.0 | — | — | — | 1.0 |
| pile-up | 1.0 | 1.0 | 1.9 | — | — | — | 1.0 |
| Jet counting | 5.5 | 5.5 | 5.5 | — | — | — | 5.5 |
| PDF uncertainties | 3.0 | 3.0 | 4.0 | — | — | — | 4.0 |
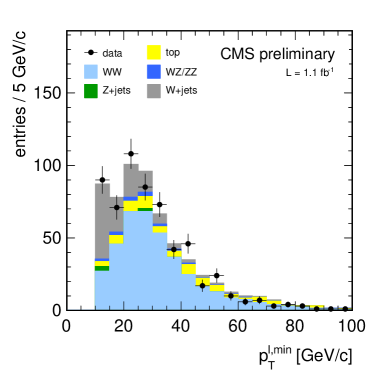
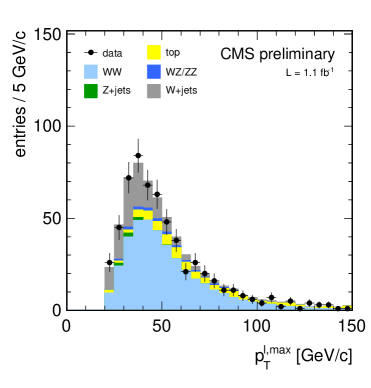
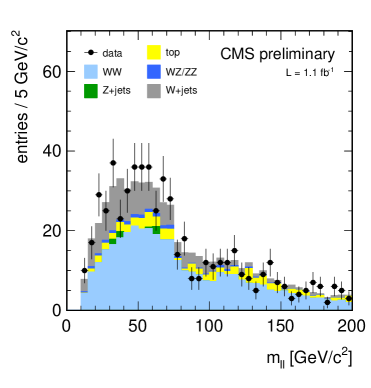
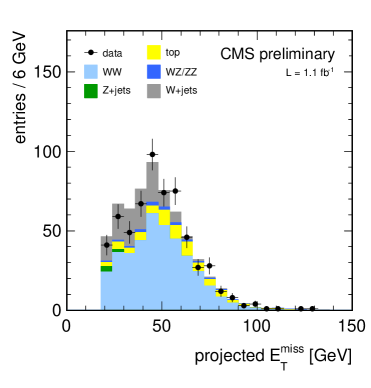
The total number of expected signal and background events, after applying the data-driven corrections, and observed data are reported in Table 1. The distributions of the key analysis variables are shown in Figure 1. Systematic uncertainties are summarized in Table 2. We obtain a total efficiency of (6.69 0.51)%. The yield is calculated from the number of events in the signal region, after subtracting the expected contributions of the various SM background processes. From this yield and the branching fraction pdg , the production cross section in collisions at 7 TeV is found to be
This is consistent with the SM expectation of pb at NLO MCFM within one standard deviation. More details on this measurement are given in Ref. diboson1p1invfb .
IV Measurement of the cross section

The decay is characterized by a pair of same-flavor, opposite-charge isolated leptons with an invariant mass corresponding to the boson, together with a third isolated lepton and large . The background comes from events with 3 leptons, genuine or fake, and can be grouped in the following classes:
-
•
Non-peaking background: di-lepton events without a boson, such as , QCD or +jets. All but the first of these can be neglected in this analysis.
-
•
Events with + fake lepton, +jets (including +heavy quarks), or (with photon conversion).
-
•
Events with a real and a third isolated lepton, essentially from decays in which one of the four leptons is lost. This background is irreducible but is small due to the small cross section.
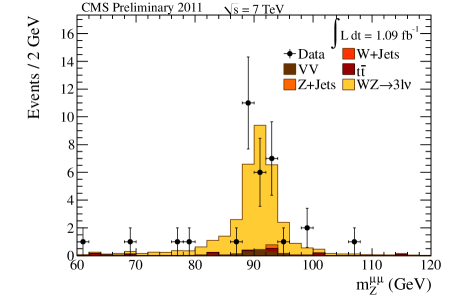
Candidate events are selected using a double electron or double muon trigger. The boson is reconstructed from two opposite sign, same flavor leptons passing loose identification criteria. The leading and second leading lepton are required to have GeV and GeV for the () case, and their invariant mass should be in the range 60–120 GeV. In case of multiple candidates, the candidate with the mass closest to the nominal mass is selected. We look for the boson decay by requiring a third isolated lepton with GeV, and requiring in the event to be larger than 30 GeV.
| Sample | ||||
|---|---|---|---|---|
| +Jets | 0.89 | 0.10 | 0.31 | 0.17 |
| 0.83 | 0.95 | 0.56 | 0.59 | |
| 0.40 | 0.95 | 0.40 | 0.97 | |
| 0.80 | 0.10 | 0.03 | 0.00 | |
| +Jets | 0.00 | 0.00 | 0.00 | 0.00 |
| +Jets | 0.02 | 0.04 | 0.00 | 0.00 |
| Total Background | 2.95 | 2.14 | 1.31 | 1.72 |
| 14.47 | 17.49 | 13.95 | 18.56 | |
| All MC | 17.42 | 19.62 | 15.26 | 20.28 |
| Data | 22 | 20 | 13 | 20 |
The efficiency for leptons to pass the isolation and identification requirements is measured using “tag-and-probe” method from the events in data. The measured efficiency values for muons and electrons are and , respectively. In a data sample corresponding to , 75 events pass these selection criteria. The data yield and MC expectations for each channel are given in Table 3. The invariant mass of the candidates for the selected events is shown in Fig. 2. We estimate the +jets background using the data sidebands, and the fake-lepton originated backgrounds by computing the jet lepton fake rate from jets events in data. Similarly, we estimate the background contamination within the signal region using di-lepton events in data. We estimate all other background contributions, including , , and where either or from simulation.
The value of is 19% for the and final states each, 23% for the final state, and 25% for the final state. A summary of systematic uncertainties is given in Table 4. The cross sections for the four channels are combined, taking into account the correlations among the systematic uncertainties and known branching ratios pdg . This results in the cross section measurement
The theoretical NLO prediction is MCFM , which is in good agreement with the measured value. Cross section measurements in the individual channels are consistent with the central value. More details on this measurement are given in Ref. diboson1p1invfb .
| Source | Systematic uncertainty | Effect on | |||
|---|---|---|---|---|---|
| Electron energy scale | 2% | 1.7% | 0.25% | 0.9% | n/a |
| Muon scale | 1% | n/a | 0.5% | 0.2% | 0.9% |
| MET Resolution | 0.5% | 0.5% | 0.5% | 0.5% | |
| MET Scale | 0.3% | 0.2% | 0.1% | 0.1% | |
| Pileup | 3.1% | 0.8% | 1.6% | 1.6% | |
| 1.0% | 1.0% | 1.0% | 1.0% | 1.0% | |
| NLO effect | 2.5% | 2.5% | 2.5% | 2.5% | 2.5% |
| Total uncertainty on | 4.5% | 2.9% | 3.3% | 3.3% | |
| Source | Systematic uncertainty | Effect on | |||
| Electron trigger | 1.5% | 1.5% | 1.5% | n/a | n/a |
| Electron reconstruction | 0.9% | 2.7% | 1.8% | 0.9% | n/a |
| Electron ID and isolation | 2.5% (loose), 3.2% (tight) | 5.9% | 5.0% | 3.2% | n/a |
| Muon trigger | 0.54% | n/a | n/a | 1.08% | 1.08% |
| Muon reconstruction | 0.74% | n/a | 0.74% | 1.48% | 2.22% |
| Muon ID and isolation | 0.74% | n/a | 0.74% | 1.48% | 1.94% |
| Total uncertainty on | 6.7% | 5.6% | 4.2% | 3.6% | |
| Source | Systematic uncertainty | Effect on WZ yield | |||
| Background estimation | |||||
| 7.5% | 0.2% | 0.4% | 0.3% | 0.4% | |
| 13% | 0.5% | 0.08% | 0.04% | 0.08% | |
| 1.3% | 1.3% | 0.9% | 0.5% | ||
| Jet fake rate | 3.3% | 4.9% | 5.2% | 4.2% | |
| Source | Systematic uncertainty | Effect on luminosity | |||
| Luminosity | 6.0% | 6.0% | 6.0% | 6.0% | 6.0% |
V Measurement of the cross section
The process with , , or is characterized by two pairs of same flavor, opposite charge, high , isolated leptons, coming from the primary vertex, with an invariant mass corresponding to a boson. The process has a clean signature with very little experimental background. We reconstruct each boson in the mass range GeV. One is required to decay into a pair of electrons or muons, and the second can decay to or . The data sample used for this analysis corresponds to , and most of the events are selected using a double electron or double muon trigger. For the final state with , we require the following event selection:
-
1.
First Z: a pair of loosely identified lepton candidates of opposite charge and matching flavor (, ) satisfying GeV, GeV and GeV; the pair with reconstructed mass closest to the nominal boson mass is retained.
-
2.
Choice of the “best ”: retain a second lepton pair of opposite charge and matching flavor, among all the remaining combinations with GeV and such that the reconstructed four-lepton invariant mass satisfies GeV. If more than one combination is found satisfying all the criteria, the one built from leptons of highest is chosen.
For the final state, the first boson is required to decay to or as described above, and the second decays into a pair of taus. Each tau candidate can decay leptonically to a or , or hadronically. Therefore, there are four possible final states for the second : . The selection requirements are:
-
•
Muon or electron with greater than 10 GeV, hadronic taus with greater than 20 GeV;
-
•
The two leptons should be isolated and should have opposite charge.
-
•
30 Visible Mass () 80 GeV
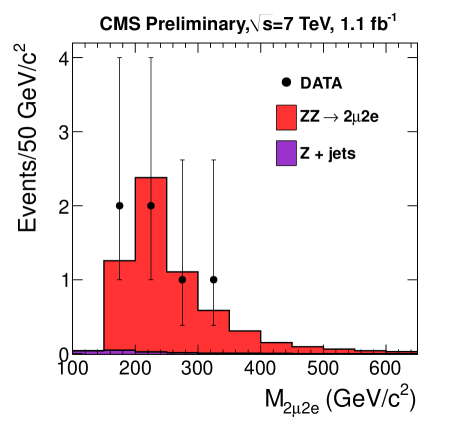
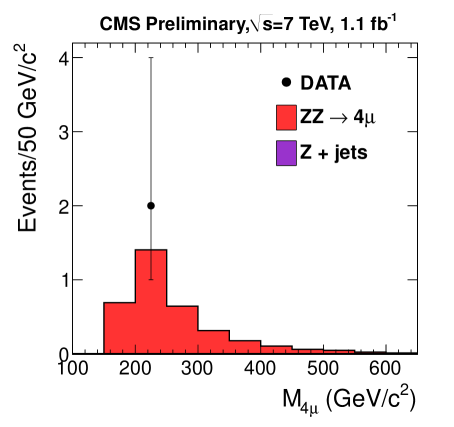
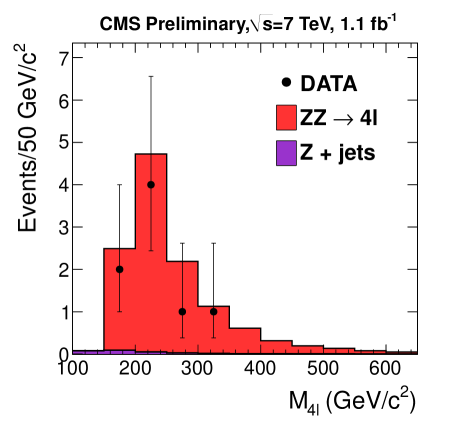
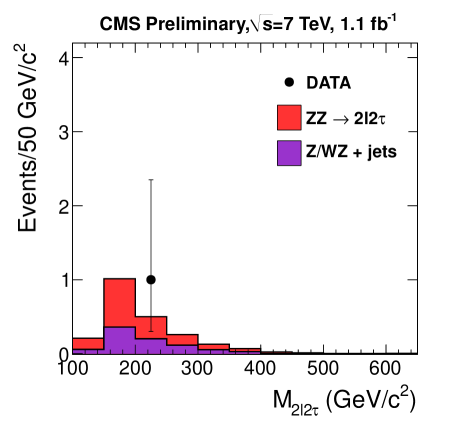
The reducible instrumental background is very small or negligible. We estimate any residual background and the associated systematic uncertainty using empirical methods based on experimental data. These are described in more detail in Ref. diboson1p1invfb . In the final state, we observe events compared to events expected from the SM. The reconstructed four-lepton invariant mass distribution is shown in Fig. 3. Table 5 shows the number of expected and observed events for the individual final states, and also the number of background events estimated using data-driven techniques. The main sources of systematic uncertainties are summarized in Table 6.
| Final state | |||
|---|---|---|---|
| 4 | 2 | ||
| 4 | 0 | ||
| 2e2 | 6 | ||
| 1 |
| 4 | 4e | 2e2 | |
| source | Effects on acceptance A | ||
| PDF+QCD scale | 2.2 % | 2.2 % | 1.8 % |
| source | Effects on efficiency | ||
| total uncertainty on | 1.7 % | 3.7 % | 3.0 % |
| Background (Z+jets) | 100 % | 43 % | 40 % |
| Luminosity | 6 % | ||
The acceptance for the kinematic thresholds and detector coverage is in the range 0.56–0.59 for the 4, 4 and 22, and 0.18–0.21 for the 2l2 final states. The resulting cross section is
which can be compared to the theoretical NLO prediction computed with MCFM MCFM . More details on this measurement are given in Ref. diboson1p1invfb .
VI Measurements of the and cross sections
The final state is characterized by a prompt, energetic, and isolated lepton, significant due to the presence of the neutrino from the boson decay, and a prompt isolated photon. The final state has two isolated leptons and a prompt isolated photon. Data for this study are selected with a trigger that requires at least one energetic electron or muon. This requirement is about 90% efficient for the signal and 98% efficient for . The trigger efficiency is close to 100% for both final states. As the and cross sections diverge for soft photons or, in the case of production, for small values of the dilepton invariant mass, we restrict the cross section measurement to the phase space defined by photon GeV and . Furthermore, for the in the event must exceed 25 GeV, and for the the must be above 50 GeV. The data sample used for this analysis corresponds to .
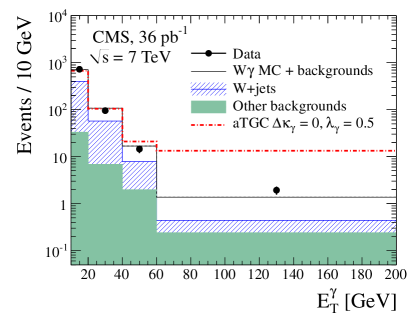
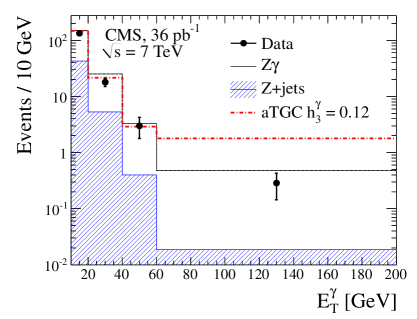
We require a well identified and isolated photon candidate in or . The isolated leptons from the or decay are required to have GeV and (2.4 for muon). The muon candidate in is further restricted to be in . The main background to / production comes from /+jets processes. We estimate this in data by measuring the -dependent probability for a jet to be identified as photon, and then folding this probability with the non-isolated photon candidate spectrum. The distribution for photon candidates in events passing the full selection is given in Fig. 4. For , we observe 452 events in the and 520 events in the final states. The background from misidentified jets is estimated to be for , and for . Backgrounds from other sources, such as and diboson, are estimated from simulation and found to be and for and , respectively. The process , with subsequent decay, also contributes at the percent level and is estimated from simulation. For , we observe 81 events in the and 90 events in the final states. The +jets background to these final states is estimated to be and , respectively. Other backgrounds are negligibly small. All systematic uncertainties are summarized in Table 7.
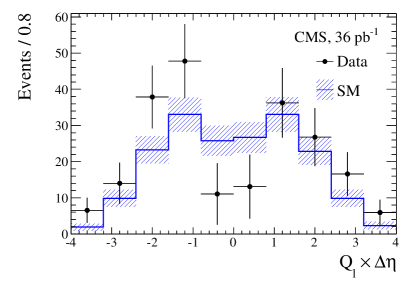
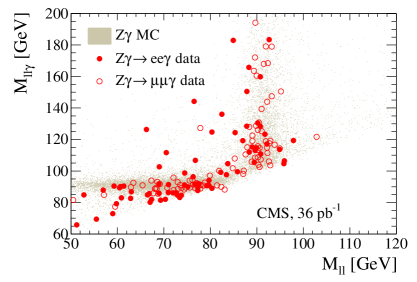
Leading order production can be described by three processes: initial state radiation (ISR), where a photon is radiated by one of the incoming quarks; final state radiation (FSR), where a photon is radiated from the charged lepton from the boson decay; and finally through the vertex, where a photon couples directly to the boson. The three tree-level production processes interfere with each other, resulting in a radiation-amplitude zero (RAZ) in the angular distribution of the photon. In the SM, the location of the dip minimum is located at . Anomalous production can result in a flat distribution. In Fig. 5 we plot the charge-signed rapidity difference in background-subtracted data. There is a good agreement between the data and MC prediction. In the SM, leading order production is described via ISR and FSR processes only, because the and TGCs are not allowed at the tree level. The distribution of the mass as a function of the dilepton mass is shown in Fig. 5.
| Source | Effect on | |||
|---|---|---|---|---|
| Lepton energy scale | 2.3% | 1.0% | 2.8% | 1.5% |
| Lepton energy resolution | 0.3% | 0.2% | 0.5% | 0.4% |
| Photon energy scale | 4.5% | 4.2 % | 3.7% | 3.0% |
| Photon energy resolution | 0.4% | 0.7% | 1.7% | 1.4% |
| Pile-up | 2.7% | 2.3% | 2.3% | 1.8% |
| PDFs | 2.0% | 2.0% | 2.0% | 2.0% |
| Total uncertainty on | 6.1% | 5.2% | 5.8% | 4.3% |
| Effect on | ||||
| Trigger | 0.1% | 0.5% | ||
| Lepton identification and isolation | 0.8% | 0.3% | 1.1% | 1.0% |
| selection | 0.7% | 1.0% | N/A | N/A |
| Photon identification and isolation | 1.2% | 1.5% | 1.0% | 1.0% |
| Total uncertainty on | 1.6% | 1.9% | 1.6% | 1.5% |
| Background | 6.3% | 6.4% | 9.3% | 11.4% |
| Luminosity | 4% | |||
We find the cross section for production to be pb and pb. The combination of the two results yields pb. This result agrees well with the NLO prediction baurWg of pb. The Z cross section is measured to be pb for the ee final state, and pb for the final state. The combination of the two results yields pb. The theoretical NLO prediction baur is pb, which is in agreement with the measured value. More details on these measurements are given in Ref. VGammaCMS .
VII Limits on anomalous triple gauge couplings from 36 data
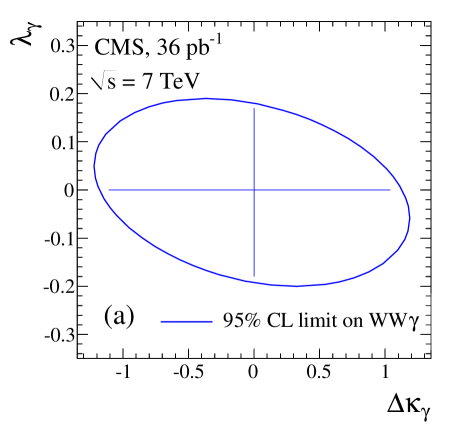
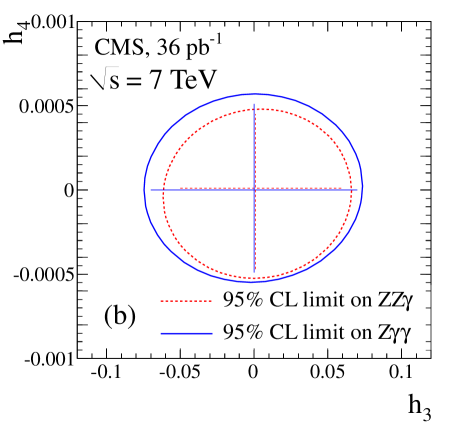
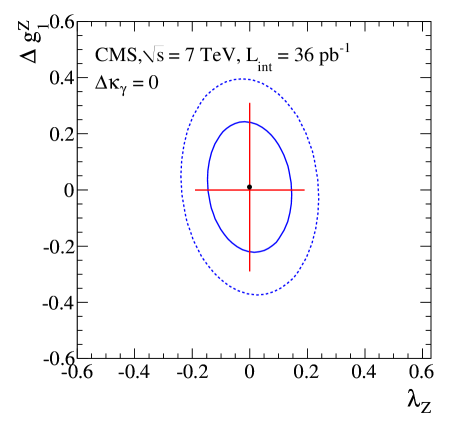
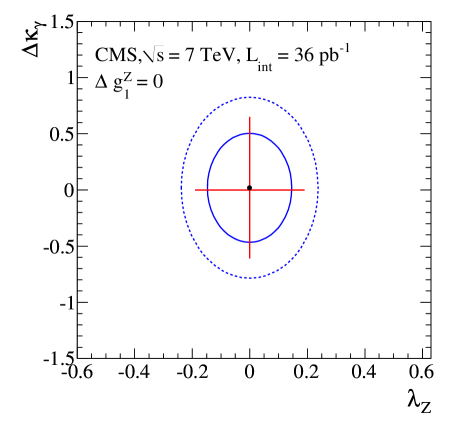
The most general Lorentz-invariant Lagrangian that describes the coupling has seven independent dimensionless couplings , , , , , , and pdg . By requiring invariance and gauge invariance only two independent parameters remain: and . From coupling introduces two more independent parameters: and . In the SM, , , , and . We define anomalous TGC (aTGCs) to be deviations from the SM predictions, so instead of using we define . For the or couplings, the most general Lorentz-invariant and gauge-invariant vertex is described by only four parameters (; ) baur . By requiring invariance, only two parameters, and , remain. The SM predicts these couplings to vanish at tree level. We produce simulated samples of , and signals for a wide range of aTGCs values. A grid of and values is used for the coupling, and values for the coupling, and and values for the and couplings.
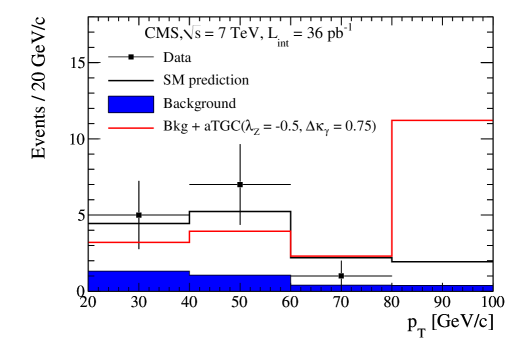
Assuming Poisson statistics and log-normal (Gaussian in case of ) distributions for the generated samples and background systematic uncertainties we calculate the likelihood of the observed photon (for , samples) or the leading lepton (in case of sample) spectrum in data given the sum of the background and aTGCs predictions for each point in the grid of aTGCs values. The resultant two-dimensional 95% confidence level (CL) limits are given in Fig. 6 and in Fig. 7. To set one-dimensional 95% CL limits on a given anomalous coupling we set the other aTGCs to their respective SM predictions. The results are summarized in Table 8. Figure 8 shows the leading lepton distributions in data and the predictions for the SM signal and background processes, and for a set of large anomalous couplings.
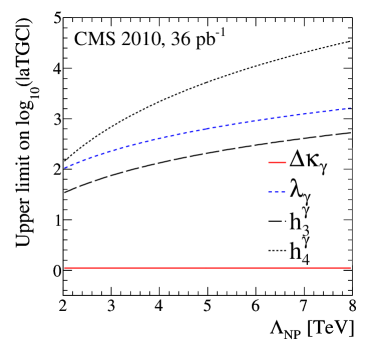
All the non-SM terms in the effective Lagrangian are scaled with , where is an aTGC, is the mass of the gauge boson ( boson for the coupling, and boson for and couplings), and is a power that is chosen to make the aTGC dimensionless. The values of for , , , and are 0, 2, 2, and 4, respectively. An alternative way to scale those new physics Lagrangian terms is with , where is the characteristic energy scale of new physics. We present upper limits on aTGCs for values between 2 and 8 TeV in Fig. 8.
More details on these measurements are given in Ref. VGammaCMS and Ref. HWWAnalysis .
References
- (1) R. Adolphi et al., CDF Collaboration, JINST 3, S08004 (2008).
- (2) S. Chatrchyan et al. [CMS Collaboration], Phys. Lett. B 699, 25 (2011).
- (3) CMS Collaboration, “Search for the Higgs Boson in the Fully Leptonic Final State”, CMS-PAS-HIG-11-014, url: http://cdsweb.cern.ch/record/1376638?ln=en (2011).
- (4) K. Nakamura et al. (Particle Data Group), J. Phys. G 37, 075021 (2010).
-
(5)
J. Campbell, K. Ellis, and C. Williams,
“MCFM - Monte Carlo for FeMtobarn processes”,
url: http://mcfm.fnal.gov (2011). - (6) CMS Collaboration, “Measurement of the , and cross sections at CMS”, CMS-PAS-EWK-11-010, url: http://cdsweb.cern.ch/record/1370067?ln=en (2011).
- (7) U. Baur, T. Han, and J. Ohnemus, Phys. Rev. D48, 5140 (1993).
- (8) U. Baur and E. Berger, Phys. Rev. D47, 4889 (1993).
- (9) S. Chatrchyan et al. [CMS Collaboration], Phys. Lett. B 701, 535 (2011).