Mixing Board Versus Mouse Interaction In Value Adjustment Tasks
Abstract
We present a controlled, quantitative study with participants comparing interaction with a haptically enhanced mixing board against interaction with a mouse in an abstract task that is motivated by several practical parameter space exploration settings.
The study participants received sets of one to eight integer values between and , which they had to match by making adjustments with physical or graphical sliders, starting from a default position of . Based on recorded slider motion path data, we developed an analysis algorithm that identifies and measures different types of activity intervals, including error time moving irrelevant sliders and end time in breaks after completing each trial item. This decomposition facilitates data cleaning and more selective outlier removal, which is adequate for the small sample size.
Our results showed a significant increase in speed of the mixing board interaction accompanied by reduced perceived cognitive load when compared with the traditional mouse-based GUI interaction. We noticed that the gains in speed are largely due to the improved times required for the hand to reach for the first slider (acquisition time) and also when moving between different ones, while the actual time spent manipulating task-relevant sliders is very similar for either input device. These results agree strongly with qualitative predictions from Fitts’ Law that the larger targets afforded by the mixer handles contributed to its faster performance.
Our study confirmed that the advantage of the mixing board acquisition times and between times increases, as more sliders need to be manipulated in parallel. To investigate this further, we computed a measure of motion simultaneity based on velocity correlation. This enabled us to identify types of items for which increased simultaneous adjustments occur.
In the context of continuous parameter space exploration our findings suggest that mixing boards are a considerable option that provides a detailed multi-value control. The strengths of this input method should particularly show in settings where screen space is precious and undisrupted visual focus is crucial.
category:
H.5.2 Information interfaces and presentation (e.g., HCI)User Interfaces, Input devices and strategies (e.g., mouse, touchscreen)
keywords:
mixing board, tangible interaction techniques, TUI1 Introduction
Many applications require frequent adjustment of numeric or categorical parameters. In audio and video production, properties of the sound or video tracks must be adjusted frequently. In visualization, applications transform data into interactive images that can be explored by adjusting parameter values.
Traditionally, audio mixing has been performed using large arrays of analog sliders. These devices are so closely associated with that task that they are commonly referred to as “mixing boards” or “mixers”. With the shift to digital media, the underlying mechanics have become digital, but the physical interface remains an array of sliders.
From the perspective of interface style, a mixing board occupies an interesting point at the intersection of tangible user interfaces, augmented reality, and haptic user interfaces. The sliders embody the benefits of a tangible interface: their handles engage the whole hand and provide strong feedback on contact, they are physically constrained to a single direction of motion, they have physical backstops stopping motion at their limits of travel, and each slider is maintained in fixed physical relationship relative to the others. Augmenting the mixing board by front-projecting graphical output on it [Crider et al. (2007)], integrates the space of the user’s movements with the display space, a form of augmented reality. Finally, some mixing boards have motorized sliders, allowing software controlled haptic effects such as detents.
Although a mixing board offers the benefits of these three interface styles, it is also limited compared to more typical members. Movement and display of a slider are restricted to a single degree of freedom, with all sliders in the same plane and direction, whereas most tangible and augmented reality interfaces emphasize movement in three or six degrees of freedom. Yet restricted as it is, the interaction task supported by the mixing board, entering several bounded numeric values, recurs in applications ranging from scientific and medical data analysis, computer-aided design, to setting document margins.
In a prior qualitative study, participants reported a greater sense of engagement and productivity when using the mixing board for such tasks [Crider et al. (2007)]. In this study, we focus on quantifying the performance benefits from the tangible properties of the mixing board. We compare its acquisition time, movement time, and workload demands to those of a similar array of graphical sliders. We also compare subjective, qualitative evaluations of the two interfaces by our 12 participants.
2 Previous Work
Specialized, spatially-multiplexed input devices have been shown to outperform generic, temporally-multiplexed devices (such as mice) for a variety of applications. Fitzmaurice and Buxton [Fitzmaurice and Buxton (1997)] demonstrated that physical or “graspable” user interfaces with specialized shapes and dedicated functions were superior to a generic input device for a target tracking task. In particular, they found only half the time with the mouse-based interface was spent actually adjusting the graphical widgets with the mouse, while for the specialized graspable interface, about 89% of the time was spent moving the physical devices. The difference between the two was largely due to the greater time required to select the graphical widget with the mouse over grabbing a physical device with the hand.
Temporally-multiplexed input devices such as mice have a potential cognitive load as well. They require users to first acquire the device, move the pointer to acquire a graphical widget, and then manipulate the widget. As a result, such devices can break the flow of a user’s cognitive engagement with the task, negatively impacting performance [Faisal et al. (2005)]. Jacob and Sibert’s work [Jacob et al. (1994)] demonstrated that input devices which support the type of motion required by the task may alleviate this problem. Additionally, people may be able to use physical devices without removing their gaze from their object of interest, unlike graphical widgets which require that direct visual focus be shifted to them and away from the object of interest. Such non-visual interaction may promote better engagement with the task and more efficient performance.
Several studies have specifically compared various forms of sliders. Hunt and Kirk [Hunt and Kirk (1999)] compared physical and virtual sliders for setting parameters in a sound matching task. By using a computer and human marker to gauge how close they were to the correct sounds, they determined that their participants achieved better results using physical sliders. Chipman et al. [Chipman et al. (2004)] compared a physical slider, a graphical scrollbar, and the mouse wheel for two scrolling tasks. Both physical interfaces performed better than the graphical scrollbar, with the mouse wheel being superior for searching and the physical slider being superior for a reciprocal tapping task.
Mixing boards have long been used to control input and output signals in video and audio applications. However, mixing boards have rarely been used in other classes of applications. Shahrokni et. al. [Shahrokni et al. (2006)] applied a force-feedback slider in visualizing laws of physics in an educational game, but their work is only a proof-of-concept and offers no analysis of the device. Rheingans [Rheingans (1992)] reported using physical sliders to interactively control color mappings in a visualization tool, although the physical interface was not the focus of her work.
A few customized physical interfaces have been developed for spatial navigation in 3D visualization applications (e.g., Hinckley et al. [Hinckley et al. (1994)] and Konieczny et al. [Konieczny et al. (2005)]). Much less work has been done to examine physical interfaces for non-spatial controls. SeismoSpin [McKelvin et al. (2003)], a custom physical input device for interacting with earthquake visualizations, was reported to be more engaging and interactive than traditional interfaces.
Tangible controls also permit two-handed input, which can be more efficient for at least two reasons: less hand movement is needed because the two hands have resting positions on different controls, and for some types of input, hands can be used simultaneously [Buxton and Myers (1986)]. Kabbash et al. [Kabbash et al. (1994)] suggested that the two hands should be used in a dependent way, with the non-dominant hand setting a frame of reference for precise action performed by the dominant hand. We do not suggest that our mixing board is an optimal two-handed interface, but the ability to use two hands simultaneously may impart some benefit.
Research Questions: The goal of our study was to answer several questions regarding the effectiveness of a mixing board as input device, and not necessarily in the context of a specific application. By measuring the time it takes to complete certain tasks with either the mixing board or a mouse, observing our study participants, and asking them about their experience, we hoped to determine:
-
•
Which device, overall, completes the given tasks more quickly and why?
-
•
Which types of tasks does the mixing board excel in?
-
•
The mixer allows for simultaneous adjustments. For what types of items do they occur?
-
•
Do target values that are near or far from the initial position for different windows of precision cause a difference in performance (confirming Fitts’ Law)?
-
•
What adjustment strategies do participants follow to accomplish their tasks?
-
•
Which device do participants subjectively prefer, and for what reasons?
3 Experimental Task and Study Design
In order to cover different possible application scenarios, we chose to study an abstract multi-value adjustment task that is representative of different practical settings. A description of the task and the study design is given in the following. Details of the hardware and software setup are postponed to Appendix A.
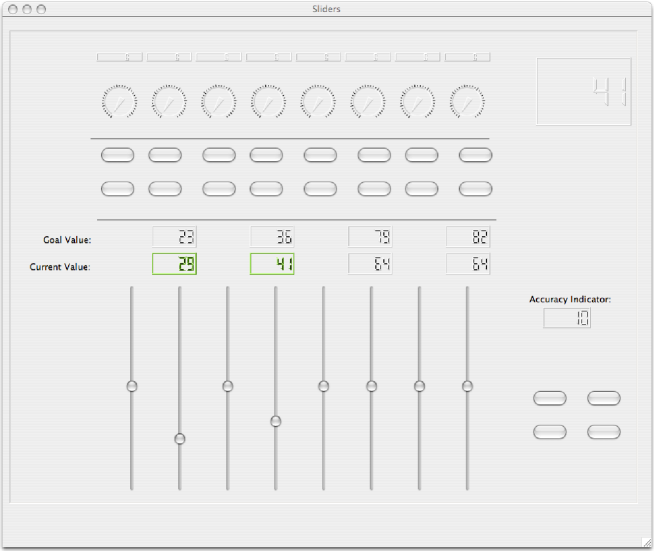
Task: In each trial, participants were presented a tuple of values and asked to set controlling sliders to those values within a specified precision, requiring one, two, four, or eight sliders to be set. The screen displayed an interface (Figure 1) that resembles the BFC2000 mixing board used in the study (see Figure 9 below for comparison), except for one difference: The mixing board used a multiplexed display in its upper right corner to show current values of the last moving slider. The GUI displayed current and target values above each slider that the participant was asked to move in a trial. Adjustments to the graphical or the motorized physical sliders caused the corresponding movements on the alternate interface.
Physical size: The standard Mac OS X aqua sliders, in the initial study had a diameter of 5 mm on the screen. Moving the mouse pointer over this distance at a low velocity, amounted to about 8 mm of mouse movement. The mixing board slider knobs measured mm. The length of a GUI slider was 75 mm and 110 mm for the mixer, spaced at 20 mm for the GUI and 27 mm on the board.
3.1 Experimental Design
The number of values to be set and the precision required were varied systematically using a six-factor, within-subjects design. The primary factor was technique [mixer or GUI]. Order of technique was counterbalanced, with participants randomly assigned to one of the two possible orders. The other five factors consisted of number of sliders [1, 2, 4, or 8], precision [loose or tight ], distance of target value [near () the initial value, far (), or at a backstop (0 or 127)], and slider layout [adjacent or separated]. Post-hoc also value layout [aligned or opposing] could be distinguished among the items. To keep the length of the experimental session manageable, these factors were only varied in a subset of the 192 possible combinations to create the sample targets—i.e. they were not fully-crossed. The resulting pool of 24 targets, listed in Figure 2, was presented in a randomized order for every block for every participant.
| 4 sliders: | |
| Backstops or distance/precision combinations | |
| various combinations of grouped versus | |
| 1 slider: | combined and directions |
| Backstop or distance/precision combinations | 10: [ 0 0 0 0 . . . . ]+/- 1 |
| 1: [ . . . . . . 0 . ]+/- 1 | 11: [ 18 18 18 18 . . . . ]+/- 1 |
| 2: [ . . . . . . 58 . ]+/- 1 | 12: [127 0 127 0 . . . . ]+/- 1 |
| 3: [ . . . . . . 110 . ]+/- 1 | 13: [ 18 110 18 110 . . . . ]+/- 1 |
| 4: [ . . . . . . 110 . ]+/- 7 | 14: [ 18 18 18 18 . . . . ]+/- 7 |
| 2 sliders: | 15: [ 18 110 18 110 . . . . ]+/- 7 |
| 3 distance/precision combinations, | 16: [ . 0 . 0 . 0 . 0 ]+/- 1 |
| and adjacent versus combined | 17: [ . 127 . 0 . 127 . 0 ]+/- 1 |
| 5: [ . . . . . . 70 70]+/- 1 | 18: [ . 18 . 18 . 18 . 18 ]+/- 1 |
| 6: [ . . . . . . 110 110]+/- 1 | 19: [ . 110 . 18 . 110 . 18 ]+/- 1 |
| 7: [ . . . . . . 110 110]+/- 7 | 20: [ . 18 . 18 . 18 . 18 ]+/- 7 |
| 8: [ . 70 . . . 70 . . ]+/- 1 | 21: [ . 110 . 18 . 110 . 18 ]+/- 7 |
| 9: [ . 110 . . . 110 . . ]+/- 7 | 8 sliders: |
| 3 distance/precision combinations | |
| 22: [ 70 70 70 70 70 70 70 70 ]+/- 1 | |
| 23: [110 110 110 110 110 110 110 110 ]+/- 1 | |
| 24: [110 110 110 110 110 110 110 110 ]+/- 7 |
Collected data: During a trial, the software recorded the changes to the digital slider values for either input device (128 discrete levels along 110 mm slider length on the mixer or 75 mm on the screen) as they occurred at a temporal resolution of at least 20 ms per measurement. When sliders are moved using any input device, path data (as in in Figure 3) is collected noting the change in value over time as one proceeds through the trials.
| timestamp (ms) | slider id | value |
|---|---|---|
| 950 | 2 | 65 |
| 1052 | 2 | 64 |
| 1094 | 1 | 63 |
| 1114 | 1 | 62 |
| 1483 | 4 | 63 |
| 1503 | 3 | 63 |
| 1503 | 4 | 62 |
| 1524 | 3 | 62 |
| 1524 | 4 | 61 |
| 1546 | 3 | 61 |
| 1546 | 4 | 60 |
| 1567 | 1 | 61 |
| 1567 | 2 | 63 |
The software recorded the final values of each slider and the trial start and end times, defined as the time the space bar was pressed. Dependent measures were total time (from start of trial to the end of movement of the last slider moved), and simultaneity of slider movement (for trials with multiple targets), and subjective workload, as measured by TLX [Hart and Staveland (1988)].
3.2 Participants
A convenience sample of 12 participants (8 male, 4 female) was recruited from graduate students (5 Ph.D., 7 MSc.) in computer science at Simon Fraser University. Their age ranged from 24 to 37 (Mdn 27). All participants considered themselves to be right-handed. They were paid 20 CAD for their participation.
3.3 Experimental protocol
Our participants did all trials in a single session. They were first introduced to the methods that would be used in the study, then confirmed in writing their informed consent. They next completed a questionnaire asking basic background information (age, gender, education, computer usage, and handedness). After a set of practice trials that was generated for each input device from the same pool of items as the main blocks, the participant performed three blocks of trials for their first technique, and then filled out a TLX questionnaire to estimate the workload for using the technique. They next did three blocks of trials for their second technique, followed by a second TLX workload estimate. Participants concluded the session by answering open-ended questions about the techniques and a question asking which technique they preferred. A typical session lasted about half an hour.
Trial procedure: Separately for each input method, the stimuli were presented in randomized order in three blocks of 24 target vectors of values. During the mixer blocks, the board was placed in front of the screen. Participants were allowed to rest as long as they wished between blocks. Trials within a block were immediately followed by the next, once their completion was confirmed by the participant pressing a mixer button or the space bar. Participants were informed about the varying tolerated accuracy for the required adjustments. They were also told that a fixed set of trials lies ahead of them, indicating that a faster performance will reduce their time spent in the study.
A trial began when the participant pressed the space bar or the confirm button in the lower right of the mixing board. The target values and the tolerated imprecision (accuracy indicator) would be displayed and all sliders were automatically initialized to their middle value (64) using the available motorized control. The participant would then move one or more sliders in whatever order they wished, setting them near their target values. When a slider was within the required precision of its target value, the “current value” in the GUI display would turn green (e.g. two values in the left of Figure 1). The software only allowed to end a trial (using space bar or confirm button) when all targets were correctly specified. While this made error trials impossible, the time spent with superfluous adjustments could still be measured.
4 Activity Interval Analysis and Outlier Detection
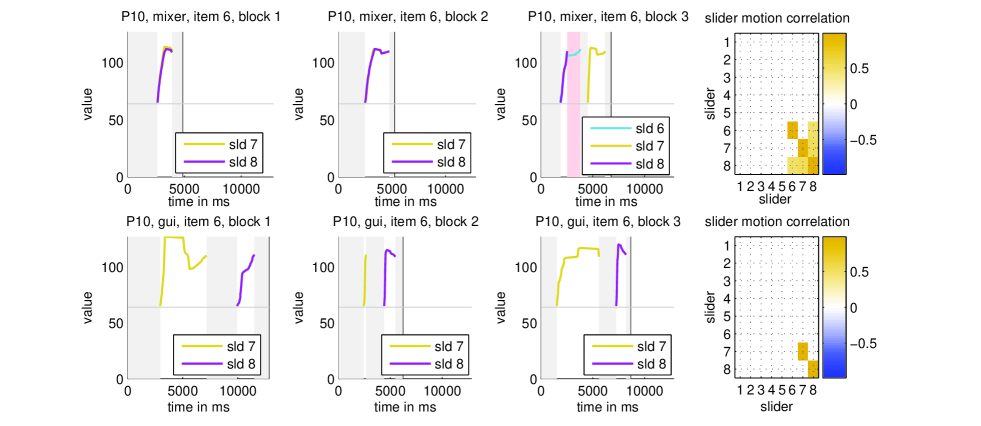
The slider motion path data is collected as a sequence of events of time stamped value updates, shown earlier in Figure 3. It can be graphed as in Figure 4, where also the result of the decomposition of the overall trial time is displayed. The six trials stem from two-slider item 6, recorded in three blocks using the mixing board (top row) and three blocks using mouse/GUI (bottom row). The gray intervals mark idle times when no valid slider was manipulated. The red sectors mark error times spent manipulating irrelevant sliders.
Types of activity intervals: To clarify the detailed mechanics underlying the decomposition shown in Figure 4, movement time was broken down into several distinct subtimes, which were determined algorithmically using custom MATLAB scripts. Acquisition time was computed as the time from the start of the presentation of a trial (end of the previous trial) to the movement of the first slider. For the mouse, it comprised the activities of possibly moving the hand from the space bar to the mouse (if the user ended the previous trial with their mouse hand), moving the mouse to the first slider, and clicking. For the mixer, acquisition time consisted of moving the hand from the trial end button on the right panel of the mixing board to the first slider. Manipulation time was computed as the time any of the the sliders involved in the task were actually moving. Between time was computed as the time spent between slider movements. Total movement time was computed as the time from the start of movement of the first slider to the end of movement of the last slider. For a given trial, the sum of acquisition, manipulation and between time equals the total time, not including the end time between the last slider movement and the pressing of the trial end button (space bar for the mouse, or a dedicated button on the mixer).
We have also determined error time, which is the amount of time between task relevant slider movements when erroneous sliders have been moved. An example of such an event can be observed in the top row of Figure 4 for the third block of the mixer interaction, in which slider 6 was moved in error. Error time is contained in the between time and is also reported separately.
4.1 Outlier detection
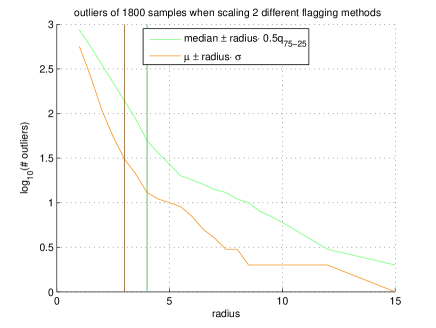
We have grouped the entire set of measurements (150 trials for 12 participants) into 48 groups, 2 input devices per each of the 24 items. Within each group we do a separate outlier analysis. For that we have implemented two methods. One determines mean and standard deviation per group (ignoring the first practice block). Then all measurements that are outside a given radius of standard deviations (z-score) are flagged as outliers. The second method chooses the radius to be times center quartile range around the median. A comparison of the two outlier detection methods is given in Figure 5.
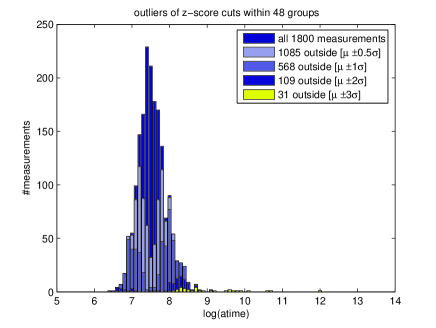
Of the 31 flagged outliers 18 were due to pauses participants took at the beginning of a trial and 9 were due to adjustment of wrong sliders. The remaining ones resulted from interim testing of what effect moving a certain slider would have. Overall, 23 of the outliers were in practice block 1, which was excluded from final timing analyses. Outliers were computed in groups separately for each input device, flagging 24 for mouse/GUI input and 7 for the mixer.
4.2 Motion path velocity correlation
A key feature of the mixer interaction is the possibility of simultaneous movement of sliders as the user may use the same hand or both hands to affect multiple sliders at any given time of the interaction. As a measure of simultaneous movement we have used path velocity correlation. Slider velocities can be determined as the time derivatives of positions and , e.g. . The time correlation of the movement of the sliders is given via an integral over the products of slider velocities over the duration of an entire trial
| (1) |
We omit to compute correlation over different displacements in time as we are only interested in it as a measure of simultaneity. To ease later interpretation of the correlation measure, we normalized all non-zero elements . The off-diagonal elements will be valued in depending on whether two sliders and have been moved into opposite or same direction. A value of with this normalization corresponds to completely identical movement, and is also found on the diagonal for elements of sliders that have been moved.
The resulting correlation matrix contains correlations among pairs of sliders and may be used for analysing slider adjustment strategies for a set of trials. For that we averaged over all trials for an item/input combination as in the right column of Figure 4. In the mixer case (top) the off-diagonal positive correlation (orange squares) indicates simultaneous slider movement as positive correlation between sliders 6, 8, and 7, but not between 6 and 7. In the mouse adjustment row at the bottom no correlation occurs. This is not surprising, since the mouse can only control one slider at a time. The absolute maximum in the upper triangle of the slider-slider correlation matrix is reported as a measure of manipulation simultaneity for the item.
5 Results
5.1 Comparing Mixer vs. Mouse interaction
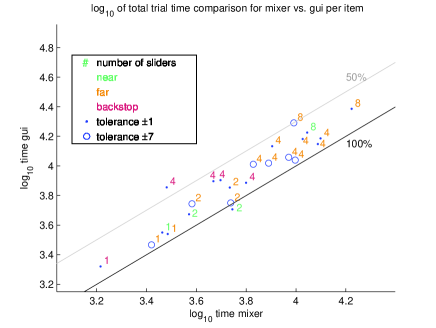
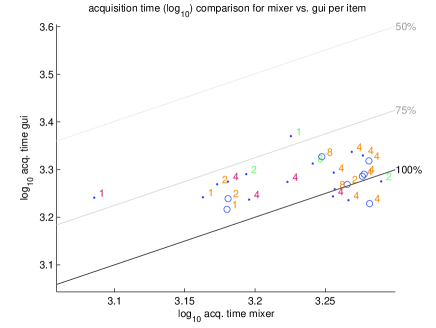
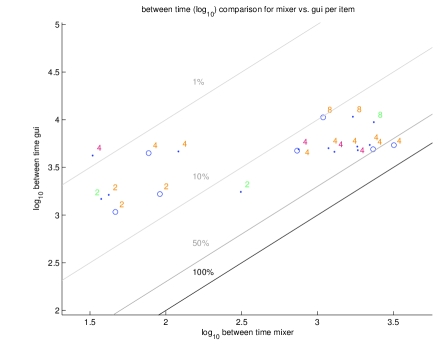
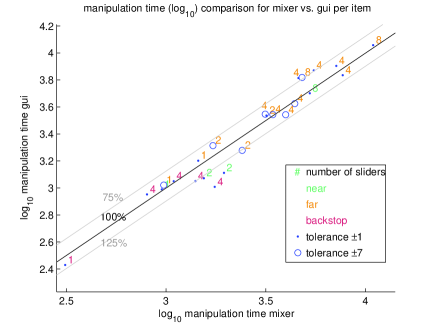
The recorded timing data were distributed log-normally. Consequently, all analysis of variance was performed on the log of the times and effect sizes are reported as percentage changes in geometric mean. Quantitative results are reported using both graphs (Figure 6) and the multivariate form of repeated-measures analysis of variance (ANOVA). All ANOVAs were performed using the means of the log times for each participant, for 11 denominator degrees of freedom.
Timing: The mixer was 24% faster than the mouse for total time (), 10% faster for acquisition time (), not significantly faster for manipulation time, and 81% faster for between time (). Figure 6 shows the length of different activity intervals (total time, between break times, manipulation time) for each of the 24 different items used in the study. The means used here are computed for the trials of one item over all participants for blocks 2 and 3. This illustrates the following differences: For total time, acquisition time, and between time, virtually all points lie above the main diagonal, indicating that the times for the mouse were larger than those for the mixer. The between times for the mixer are virtually all 50% or less than between times for the mouse. Overall, of the non-manipulation time (acquisition time + between time) has been spent adjusting erroneous mixer sliders. Using mouse and GUI sliders this rate is lower at .
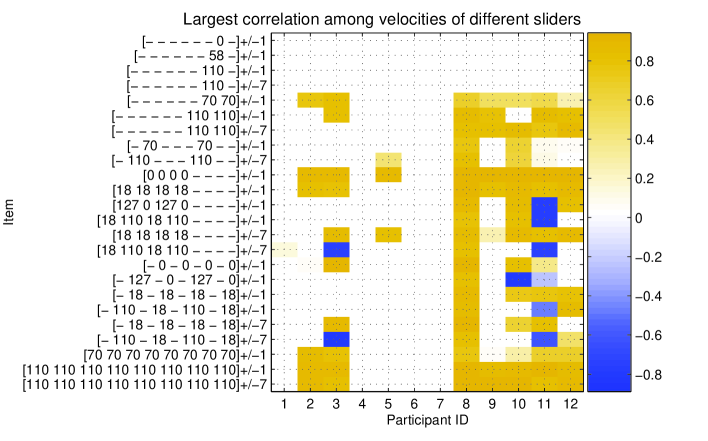
Simultaneity: Our analysis of simultaneous adjustments is summarized in Fig. 7. Here, we consider the maximum magnitude correlation between different sliders (that is off-diagonal elements of only). Each colored pixel in the grid represents a set of mixer trials of a participant for a given item. One can observe the effects of different strategies. Three participants never made use of any simultaneous adjustments. Three others even moved sliders simultaneously into opposite directions, as indicated by the blue cells. Items with target values that required adjustment into the same direction on adjacent sliders caused more simultaneity than items requiring movement of non-adjacent sliders.
5.2 Qualitative Data
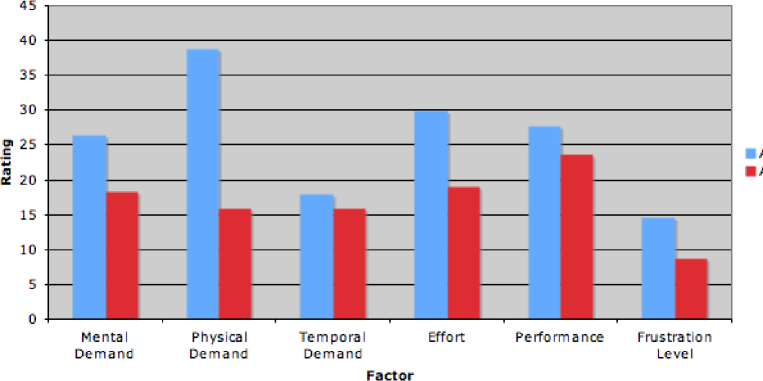
Figure 8 shows the weighted results from the NASA-TLX workload questionnaires employed in our study. Qualitatively, one can see that the mixing board was rated less demanding on all six factors. The most significant difference reported concerns the physical demand of the two interfaces, wherein the graphical controls were rated more than twice as demanding. Several participants reported on two reasons that may describe this conclusion: Holding the mouse over time began to make their hands sore, and they had to extend their arm more with the mouse to make an adjustment.
In the opinion questionnaires, all of the participants stated that they preferred the mixing board to the screen controls, with three participants explicitly stating that the mixer was more enjoyable or the mouse more boring. Most of the participants also used both hands when adjusting physical sliders on some trials and/or reported bimanual input as an advantage particular to the mixing board. Three participants reported that the mixing board was more precise than the graphical controls, and just as many reported that the physical slider knobs were easy to grab. The main disadvantage to the mixing board reported is that users had to frequently move their eyes from the screen to the board to home their hands on to the correct knobs. We address this issue further in our discussion.
6 Discussion and Future Directions
To summarize the main results of the previous section, the overall time to complete a trial with mixer interaction is of mouse/GUI pointer based interaction. For items including extremal values (backstop) the rate can go as low as , corresponding to a gain in speed of close to 40% when using the mixer. The overall distribution is shown in Figure 6a.
Determining activity intervals, as described in Section 4, allowed to distinguish the different periods of non-interaction into initial acquisition time and in-between acquisition time. The latter is significantly () dependent on the input device. Remarkably, the manipulation time showed no significant dependence as can also be seen by inspecting Figure 6d.
A trial task was displayed on the screen while the manipulation devices - mixer and mouse to its right - were placed on the table in front of the screen. Mouse interaction works via an intermediate pointer or cursor representation on the screen, and thus in the same perceptual space the task is presented. The mixing board has its manipulation elements in physical space. These need to be found using the hands and potentially moving the eye gaze over to the board. To deal with this situation several participants adopted the strategy of keeping their gaze on the screen while blindly operating the sliders and occasionally touching a wrong one. Most of these erroneous manipulations were short term mini-manipulations in search of the right one to adjust. As reported in the analysis, the overall amount of erroneous adjustments in the mixer manipulation made only a small difference to the between time and were higher than the mouse/GUI. Overall, the between time (containing the error time) was much shorter for the mixer than for the mouse/GUI based interaction.
Applications: The shortened time of interaction and the ability to make simultaneous adjustements make the mixing board a suitable device for user-guided search over multi-parameter spaces as it occurs in a variety of application settings. For example, the sliders could be used to apply ratings of relevance, influencing an algorithms notion of ’good’ search results [Bergner et al. (2011), Torsney-Weir et al. (2011), Bruckner and Möller (2010)].
Alternatively, parameters may be influenced directly as it would be useful to explore a design space or to configure visualizations. The user may determine a most promising direction of exploration by learning about cross-dependencies among different parameters.
With separate adjustments, such as done via the mouse, the direction of the steps in which one can move through parameter space will always be along parameter axes. With the simultaneous adjustment of the mixer sliders it is also possible to progress along diagonal directions in the planes spanned by any pair of parameter axes. This may be helpful for steering more directly towards optimal configurations.
Another advantage for the mixer in such exploration settings is the fact that it frees up screen real estate. With the separate interaction device, the entire display can be used to show the data in more detail.
In our experiments we have used the motor control of the sliders only to ensure a clearly defined initial state for each task. However, depending on the application setting there is more to be gained from this feature. In particular, parameter dependencies and constraints could be expressed to limit the user’s search of feasible regions, or enable the user to push its boundaries. In a dynamic query range selection [Crider et al. (2007)] we have enforced the constraint that the upper bound slider may always be at a value greater or equal to the lower bound slider.
Further directions: One could also investigate the integration of a separate slider adjustment as provided by the mixing board with more advanced mouse/GUI interactions [van Wijk and van Liere (1993), Tweedie and Spence (1998)]. In [Bergner et al. (2005)] we have devised a 2D slider embedding allowing for single click and drag control of multi-dimensional weights. They were used to determine a mixture of light sources, but an extension to more general application settings is possible [Kilian et al. (2007), Ovsjanikov et al. (2011)].
Another comparison could consider touch screen interfaces, such as TouchOSC111http://hexler.net/software/touchosc, in relation to tactile or haptic ones, like a physical mixing board. In this direction, a first version of this report from 2008 has already inspired follow-up work [Swindells et al. (2009)] that showed a significantly improved visual focus on the task display, when physical sliders are used instead of GUI controls, which did not occur when using touch screen sliders placed in the same prior location of the physical sliders on a table top display. While their study did not obtain the timing improvements documented in this report, the improved eye gaze focus provides further indication and a possible explanation of the reduced cognitive load when using the mixer.
The items used in our current study are all fairly structured and contain several identical values. Further studies could consider more different value combinations, e.g. giving target points that lie in certain specifically shaped neighbourhoods around the origin. Different directions of the required steering could be considered, as well as measures of how exhaustively a user explored the feasible options. A readily available binding in our paraglide system could provide the technical setup for such a study [Bergner et al. (2011)].
In summary, the shown characteristics portrayed mixing boards as a good fit for the purpose of a detailed multi-parameter control. Easy and relatively cheap integration of such a device into an application is possible. Its strengths should particularly hold in settings where screen space is precious, and undivided visual focus is crucial.
7 Conclusion
The comparative study described in this paper revealed a significant advantage of the mixing board input over a mouse/GUI based input reducing the overall time required to complete the multi-parameter adjustment tasks, while also reducing the cognitive load perceived by the participants.
Methodological contributions: Beyond inspecting recorded total time we have conducted an analysis of motion path data. This enabled the decomposition of the overall interaction time into different activity intervals. Aside from providing a more accurate method for data cleaning, this also revealed a crucial effect present in the recorded data. The pure manipuation time was independent of the input device. The significant difference favoring the mixer in overall timing resulted solely from improved timing when reaching for the controls, namely acquisition time and between time. To investigate simultaneity of adjustments we devised a velocity correlation measure.
Implications: Our study highlights the potential for a mixing board to augment mouse control in applications where parameters need to be adjusted. While such applications may not have a graphical slider control, or an analogous widget (such as a knob), the metaphor of adjusting discrete or continuous values can typically be mapped to a slider. In such cases, it is advantageous to assign different parameters to their own sliders, allowing for a spatially-multiplexed interaction. The constrained motions of the mixing board sliders allowed us to identify basic interaction patterns for different types of items. Our findings indicate that in order to stimulate simultaneous slider movements, parameters that require correlated adjustments are best placed next to each other. This could provide a convenient method of exploration in the direction of parameter axes and along the diagonals in low-dimensional subspaces (e.g. the planes spanned by any two axes).
Appendix
Appendix A Setup
All experimental software ran on a hyper-threaded dual-core Apple PowerPC ( GHz) with 8 GB RAM running MacOS 10.5. The graphical interface was displayed in a rectangular area on a 20 inch TFT monitor. The machine was connected to the Internet, but did not have any other applications running—there was no contention for the processor.
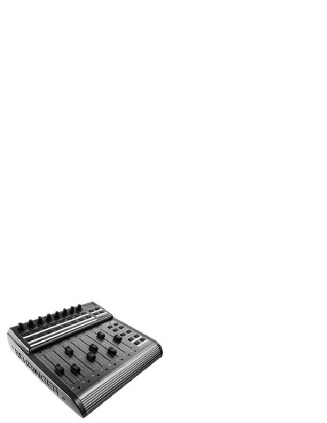
When deciding on which particular mixing board to acquire, our choices came down to two options: The BCF2000 (see Figure 9), and the Evolution UC33e, both are easily connected to a computer through a USB or MIDI port. A key feature of digital MIDI mixing boards is that they are platform independent and communicate with a standard message protocol, which all major operating systems can understand. Our choice of Operating System is arbitrary, and does not effect the software we developed, which has also been run on Windows and Linux Operating Systems.
We opted for the BCF2000 as, in addition to all the features shared between the two mixers it has motorized sliders. This allows to send messages to the mixing board and adjust the physical position of the sliders to synchronize them with their graphical counterparts, and enforce constraints on the sliders by only allowing them to be in certain positions. Further, it allows the board to be used as a type of output device that conveys data values by dynamically updating the positions of the sliders.
Software: To communicate with the mixing board, we used RtMidi [Scavone and Cook (2005)], an open source and multiplatform C++ API for communicating with MIDI devices. On top of this API, using the Qt GUI toolkit, we developed an application that provides a graphical representation of the device’s controls (see Figure 1).
To generate trial values, we used an Experimental Driver program that facilitates the formulation of trial data in an XML file. This allows for a simple means of controlling the order of the trials in the experiment. Further, it enabled us to randomize the trial types that our participants would receive within a set block of experiments. This driver included a mechanism to receive results from our client application and to organize them in logs for further analysis.
References
- Bergner et al. (2005) Bergner, S., Möller, T., Tory, M., and Drew, M. S. 2005. A practical approach to spectral volume rendering. IEEE Trans. on Vis. and Comp. Graphics 11, 2, 207–216.
- Bergner et al. (2011) Bergner, S., Sedlmair, M., Nabi-Abdolyousefi, S., Saad, A., and Möller, T. 2011. Paraglide: Interactive Parameter Space Partitioning for Computer Simulations. Submitted to IEEE Trans. on Vis. and Comp. Graphics, Sep. 2011.
- Bruckner and Möller (2010) Bruckner, S. and Möller, T. 2010. Result-driven exploration of simulation parameter spaces for visual effects design. IEEE Trans. on Vis. and Comp. Graph. (Proc. Vis. / Info. Vis. 2010) 16, 1467–1475.
- Buxton and Myers (1986) Buxton, W. and Myers, B. 1986. A study in two-handed input. In Proc. CHI 1986. ACM Press, Boston, MA, 321–326.
- Chipman et al. (2004) Chipman, L. E., Bederson, B. B., and Golbeck, J. A. 2004. SlideBar: analysis of a linear input device. Behaviour and Information Technology 23, 1, 1–9.
- Crider et al. (2007) Crider, M., Bergner, S., Smyth, T., Kirkpatrick, A., and Möller, T. 2007. A mixing board interface for graphics and visualization applications. In Proc. Graphics Interface 2007. ACM, Montreal, QC, 87–94.
- Faisal et al. (2005) Faisal, S., Cairns, P., and Craft, B. 2005. Infoviz experience enhancement through mediated interaction. In ICMI’05 Workshop on Multimodal Interaction for the Visualisation and Exploration of Scientific Data. ITC/ACM, Trento, IT, 3–9.
- Fitzmaurice and Buxton (1997) Fitzmaurice, G. W. and Buxton, W. 1997. An empirical evaluation of graspable user interfaces: towards specialized, space-multiplexed input. In Proc. CHI 1997. ACM Press, New York, NY, 43–50.
- Hart and Staveland (1988) Hart, S. and Staveland, L. 1988. Development of NASA-TLX (Task Load Index): Results of empirical and theoretical research. Human mental workload 1, 139–183.
- Hinckley et al. (1994) Hinckley, K., Pausch, R., Goble, J. C., and Kassell, N. F. 1994. Passive real-world interface props for neurosurgical visualization. In Proc. CHI 1994. ACM Press, Boston, MA, 452–458.
- Hunt and Kirk (1999) Hunt, A. and Kirk, R. 1999. Radical user interfaces for real-time control. In EUROMICRO. IEEE Computer Society, Milan, IT, 2006–2012.
- Jacob et al. (1994) Jacob, R. J. K., Sibert, L. E., McFarlane, D. C., and M. Preston Mullen, J. 1994. Integrality and separability of input devices. ACM Transactions on Computer-Human Interaction 1, 1, 3–26.
- Kabbash et al. (1994) Kabbash, P., Buxton, W., and Sellen, A. 1994. Two-handed input in a compound task. In Proc. CHI 1994. ACM Press, Boston, Massachusetts, 417–423.
- Kilian et al. (2007) Kilian, M., Mitra, N. J., and Pottmann, H. 2007. Geometric modeling in shape space. ACM Transactions on Graphics 26, 3, 1–8.
- Konieczny et al. (2005) Konieczny, J., Shimizu, C., Meyer, G. W., and Colucci, D. 2005. A handheld flexible display system. In Proc. VIS 2005. IEEE Computer Society Press, Minneapolis, MN, 75.
- McKelvin et al. (2003) McKelvin, M., Nestande, R., Valdez, L., Yee, K.-P., Back, M., and Harrison, S. 2003. Seismospin: a physical instrument for digital data. In CHI 2003: extended abstracts on Human factors in computing systems. ACM Press, Ft. Lauderdale, Florida, 832–833.
- Ovsjanikov et al. (2011) Ovsjanikov, M., Li, W., Guibas, L., and Mitra, N. J. 2011. Exploration of continuous variability in collections of 3d shapes. ACM Trans. on Graphics 30, 4, to appear.
- Rheingans (1992) Rheingans, P. 1992. Color, change, and control for quantitative data display. In Proc. VIS 1992. IEEE Comp. Soc. Press, Boston, MA, 252–259.
- Scavone and Cook (2005) Scavone, G. and Cook, P. 2005. Rtmidi, rtaudio, and a synthesis toolkit (stk) update. In In Proc. of the Intl. Comp. Music Conf. Citeseer, Spain.
- Shahrokni et al. (2006) Shahrokni, A., Jenaro, J., Gustafsson, T., Vinnberg, A., Sandsjo, J., and Fjeld, M. 2006. One-dimensional force feedback slider: Going from an analogue to a digital platform. In Proc. NordiCHI 2006. ACM Press, Oslo, Norway, 453–456.
- Swindells et al. (2009) Swindells, C., Tory, M., and Dreezer, R. 2009. Comparing parameter manipulation with mouse, pen, and slider user interfaces. Computer Graphics Forum (Proc. EuroVis 2009) 28, 3 (June), 919–926.
- Torsney-Weir et al. (2011) Torsney-Weir, T., Saad, A., Möller, T., Weber, B., Hege, H.-C., Verbavatz, J.-M., and Bergner, S. 2011. Tuner: Principled Parameter Finding for Image Segmentation Algorithms Using Visual Response Surface Exploration. IEEE Trans. on Vis. and Comp. Graphics 18, 6, ???–???
- Tweedie and Spence (1998) Tweedie, L. and Spence, R. 1998. The prosection matrix: A tool to support the interactive exploration of statistical models and data. Computational Statistics 13, 1, 65–76.
- van Wijk and van Liere (1993) van Wijk, J. and van Liere, R. 1993. HyperSlice: Visualization of scalar functions of many variables. In Proc. of 4th Conf. on Visualization’93. IEEE Computer Society, San Jose, 119–125.