SF2A 2011
Seismic analysis of two solar-type stars observed by Kepler
Abstract
After more than one year of operation, the Kepler photometer has already provided exquisite data of solar-type stars. During the survey phase, 42 stars have been continuously observed. It appeared that five stars show evidence of oscillations, even though they are rather faint (magnitudes from 10.5 to 12). We will show the results of the seismic analysis of the light curves of two of these stars, which have been observed during more than 8 months. This analysis led to the determination of the acoustic-mode global parameters (mean large separation, mean small separation…), lists of frequencies built by comparing the results of several teams, some parameters of the modes, and the rotation period of the stellar surface.
keywords:
asteroseismology, solar-type stars, data analysis, oscillations1 Introduction
Interferometry, spectroscopy, and spectro-polarimetry are the classical methods to characterize stars, giving us information about mass and radius, the stellar atmosphere, rotation and magnetic activity. Over the past decade, asteroseismology has emerged as a powerful new tool allowing us to directly probe the stellar interior.
A star is a resonant cavity where two types of waves can propagate. Acoustic (p) modes are excited in the convective zone and sustained by pressure. These modes are equally spaced in frequency and we define the mean large frequency separation, , that is the mean root square of the density. The mean small frequency separation, , is very sensitive to the structure of the star, and thus to its age. Gravity (g) modes propagate in the radiative zone and are sustained by buoyancy, rendering them evanescent in the convective zone. As such, g modes in solar-type stars are very difficult to detect, since they reach the stellar surface with very low amplitudes (García et al. 2007; Appourchaux et al. 2010). Finally there are mixed modes, which are sustained by both pressure and buoyancy, making them sensitive to both the core and the envelope of a star. These modes are very precious, as they carry information on the stellar core and reach the stellar surface with larger amplitudes than pure g modes (e.g. Beck et al. 2011; Bedding et al. 2011; Mosser et al. 2011).
The ground-based observing campaigns (e.g. Arentoft et al. 2008) and space-based photometric observations with instruments such as WIRE (Wide-Field Infrared Explorer Bruntt et al. 2007) and MOST (Microvariability and Oscillations of STars Walker et al. 2003) allowed us to study these solar-like oscillations in a few tens of stars. The CoRoT mission (Convection, Rotation, and Transits Baglin et al. 2006) increased the number of main-sequence solar-like pulsators known thanks to longer continuous observations. Depending on the signal-to-noise ratio, it was possible to estimate the global parameters of the p modes (García et al. 2009; Mosser et al. 2009; Mathur et al. 2010a) and even resolve the individual modes (e.g. Ballot et al. 2011).
The Kepler mission (Borucki et al. 2010), launched in March 2009 into an Earth-trailing orbit, was designed to search for Earth-like exoplanets. It is a photometer composed of 42 CCDs (now 38) that will monitor the brightness of more than 150,000 stars in the direction of Cygnus and Lyra for at least 3.5 years. An additional program was introduced to apply asteroseismic methods to the target stars. Around 2000 solar-type stars have been observed for one month during the first year of survey and solar-like oscillations were detected in around 600 stars. With this large number of stars, we can start to do “ensemble” asteroseismology leading to very interesting results (Chaplin et al. 2011), which are important for our understanding of stellar evolution. Among the stars continuously observed during the survey phase, five present solar-like oscillations: two F-type stars (KIC 11234888 and KIC 10273246) and two G-type stars (KIC 11395018 and KIC 10920273). We refer to Mathur et al. (2011a) and Campante et al. (2011) for a detailed analysis of these stars. We present here the results of the analysis of two of these solar-type stars, KIC 11395018 and KIC 11234888, that have been observed for more than eight months.
2 Analysis of the Kepler targets
In each observation quarter (of 3 months), a few hundreds of stars are observed by Kepler in short cadence (58.85 s) (Gilliland et al. 2010). The Kepler Science Office provides light curves that are corrected for instrumental effects and that are optimized for exoplanet transits search (Jenkins et al. 2010). However, it can happen that the low-frequency signals of some stars are filtered out. Thus, within the Kepler Asteroseismic Scientific Consortium (KASC, Kjeldsen et al. 2010), the Working Group # 1 (which focuses on oscillations in main-sequence solar-type stars) developed their own method for the corrections. The raw light curves are corrected for three types of instrumental perturbations: outliers, jumps, and drifts, following the methods described in García et al. (2011). The data of each Kepler quarter are concatenated after equalizing their mean values by fitting a 6th order polynomial to each segment. To remove the low-frequency instrumental trends, a high-pass filter is applied.
Several teams (Huber et al. 2009; Mosser & Appourchaux 2009; Roxburgh 2009; Campante et al. 2010; Hekker et al. 2010; Mathur et al. 2010b) analyzed the light curves to retrieve the global parameters of the p modes. We were able to measure the mean large frequency separation , the frequency of maximum oscillation power , the mean small separation , and the mean linewidth . We obtained = 47.76 0.99 Hz and = 41.74 0.94 Hz for KIC 11395018 and KIC 11234888 respectively. We determined the mean values of the small separation, = 4.12 0.035 Hz and 2.38 0.19 Hz respectively for KIC 11395018 and KIC 11234888, as well as the mean linewidth of the modes, = 0.84 0.02 Hz and 0.86 0.06 Hz respectively.
We also fitted the granulation signal with a Harvey-like function (Harvey 1985; Mathur et al. 2011b), yielding the granulation time scale, of s and s for KIC 11395018 and KIC 11234888 respectively.
To study the low-frequency region of the power spectrum, we used different high-pass filters so that the signal below 1 Hz was conserved. We estimated the surface rotation period to 36 days for KIC 11395918. The data of KIC 11234888 were noisier than the rest of the data. So we only considered the last 7 months of data. Several peaks were present at low frequency suggesting that the surface of that star has a differential rotation (between 19 and 27 days).
In addition, several teams fitted the individual modes using different methods. The most common approach adopted was the maximum likelihood estimator method (e.g. Appourchaux et al. 1998). Another group used Bayesian Markov Chain Monte Carlo algorithms (MCMC; e.g. Handberg & Campante 2011). Finally a smaller group did not fit the individual modes but looked for the highest peaks in the power spectrum (e.g. Bonanno et al. 2008). Applying the method described in Mathur et al. (2011a), we selected the minimal and maximal lists of frequencies that provide very tight constraints to model the stars.
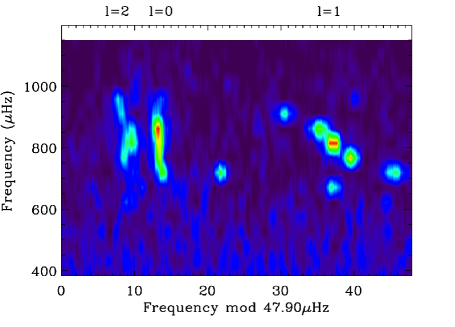
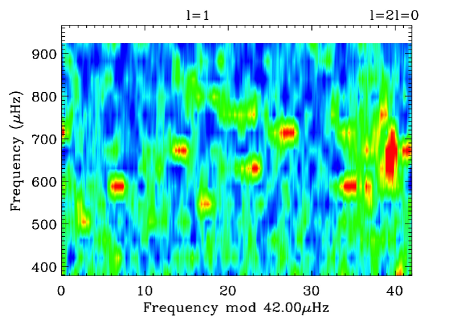
Figure 1 shows the échelle diagrams of the two stars. This diagram is computed as follows: we take segments in the power spectrum of width approximately and stack them one on top of each other. The left panel shows the ridges = 0, 1, and 2 for KIC 1139501. We can also note the presence of an avoided crossing, where an = 1 is “bumped” because of the coupling between acoustic and gravity modes. The right panel shows that KIC 11234888 has several avoided crossings. The presence of the mixed modes is very important to constrain the age of the star (see for example Metcalfe et al. 2010).
Finally, we were able to have a first estimate for the splitting and inclination angle of the star KIC 11395918 using the MCMC approach. It gave an estimation of the projected rotational splitting (where is the splitting) of 0.29 0.06 Hz and an inclination angle , with a confidence level of 68 %.
3 Conclusions
We analyzed the power spectra of two solar-type stars observed by Kepler during approximately eight months. We obtained not only the first estimates of the p-mode global parameters but also the individual frequencies of the p modes. We identified 22 p modes in the range 600 to 1000 Hz for KIC 11395018 and 16 p modes in the range 500 to 900 Hz for KIC 11234888.
Using scaling relations (Kjeldsen & Bedding 2011; Huber et al. 2010; Verner et al. 2011), we can have a first estimate of the mass and radius of the stars. For KIC 11395018, we obtain: = 1.25 0.24 and = 2.15 0.21 , while for KIC 11234888, we have = 1.33 0.26 and = 2.4 0.24 .
These stars will be studied in more details using stellar modeling that combines the individual mode frequencies and the atmospheric parameters to retrieve precise estimates of the stellar parameters (Creevey et al. 2011, Brandão et al., in prep.; Doğan et al., in prep.).
This is the beginning of a new era as we are now able to measure the frequencies of p modes in a few hundreds of solar-type stars. This allow us to start testing and improving the stellar modeling codes with a very large sample of stars for the first time and to better understand stellar evolution.
Acknowledgements.
Funding for this Discovery mission is provided by NASAs Science Mission Directorate. The author wishes to thank the entire Kepler team, without whom these results would not be possible. The author also thanks the members of the KASC Working Group 1, all funding councils and agencies that have supported the activities of KASC Working Group 1, and the International Space Science Institute (ISSI). NCAR is supported by the National Science Foundation.References
- Appourchaux et al. (2010) Appourchaux, T., Belkacem, K., Broomhall, A.-M., et al. 2010, A&A Rev., 18, 197
- Appourchaux et al. (1998) Appourchaux, T., Gizon, L., & Rabello-Soares, M.-C. 1998, A&AS, 132, 107
- Arentoft et al. (2008) Arentoft, T., Kjeldsen, H., Bedding, T. R., et al. 2008, ApJ, 687, 1180
- Baglin et al. (2006) Baglin, A., Auvergne, M., Boisnard, L., et al. 2006, in COSPAR, Plenary Meeting, Vol. 36, 36th COSPAR Scientific Assembly, 3749
- Ballot et al. (2011) Ballot, J., Gizon, L., Samadi, R., et al. 2011, A&A, 530, A97
- Beck et al. (2011) Beck, P. G., Bedding, T. R., Mosser, B., et al. 2011, Science, 332, 205
- Bedding et al. (2011) Bedding, T. R., Mosser, B., Huber, D., et al. 2011, Nature, 471, 608
- Bonanno et al. (2008) Bonanno, A., Benatti, S., Claudi, R., et al. 2008, ApJ, 676, 1248
- Borucki et al. (2010) Borucki, W. J., Koch, D., Basri, G., et al. 2010, Science, 327, 977
- Bruntt et al. (2007) Bruntt, H., Suárez, J. C., Bedding, T. R., et al. 2007, A&A, 461, 619
- Campante et al. (2011) Campante, T. L., Handberg, R., Mathur, S., et al. 2011, ArXiv e-prints 1108.3807
- Campante et al. (2010) Campante, T. L., Karoff, C., Chaplin, W. J., et al. 2010, MNRAS, 408, 542
- Chaplin et al. (2011) Chaplin, W. J., Kjeldsen, H., Christensen-Dalsgaard, J., et al. 2011, Science, 332, 213
- Creevey et al. (2011) Creevey, O. L., Doğan, G., Frasca, A., et al. 2011, ApJ, submitted
- García et al. (2011) García, R. A., Hekker, S., Stello, D., et al. 2011, MNRAS, 414, L6
- García et al. (2009) García, R. A., Régulo, C., Samadi, R., et al. 2009, A&A, 506, 41
- García et al. (2007) García, R. A., Turck-Chièze, S., Jiménez-Reyes, S. J., et al. 2007, Science, 316, 1591
- Gilliland et al. (2010) Gilliland, R. L., Jenkins, J. M., Borucki, W. J., et al. 2010, ApJ, 713, L160
- Handberg & Campante (2011) Handberg, R. & Campante, T. L. 2011, A&A, 527, A56
- Harvey (1985) Harvey, J. 1985, in ESA Special Publication, Vol. 235, Future Missions in Solar, Heliospheric & Space Plasma Physics, ed. E. Rolfe & B. Battrick, 199
- Hekker et al. (2010) Hekker, S., Broomhall, A., Chaplin, W. J., et al. 2010, MNRAS, 402, 2049
- Huber et al. (2010) Huber, D., Bedding, T. R., Stello, D., et al. 2010, ApJ, 723, 1607
- Huber et al. (2009) Huber, D., Stello, D., Bedding, T. R., et al. 2009, Communications in Asteroseismology, 160, 74
- Jenkins et al. (2010) Jenkins, J. M., Caldwell, D. A., Chandrasekaran, H., et al. 2010, ApJ, 713, L87
- Kjeldsen & Bedding (2011) Kjeldsen, H. & Bedding, T. R. 2011, A&A, 529, L8
- Kjeldsen et al. (2010) Kjeldsen, H., Christensen-Dalsgaard, J., Handberg, R., et al. 2010, Astronomische Nachrichten, 331, 966
- Mathur et al. (2010a) Mathur, S., García, R. A., Catala, C., et al. 2010a, A&A, 518, A53
- Mathur et al. (2010b) Mathur, S., García, R. A., Régulo, C., et al. 2010b, A&A, 511, A46
- Mathur et al. (2011a) Mathur, S., Handberg, R., Campante, T. L., et al. 2011a, ApJ, 733, 95
- Mathur et al. (2011b) Mathur, S., Hekker, S., Trampedach, R., et al. 2011b, ArXiv e-prints 1109.1194
- Metcalfe et al. (2010) Metcalfe, T. S., Monteiro, M. J. P. F. G., Thompson, M. J., et al. 2010, ApJ, 723, 1583
- Mosser & Appourchaux (2009) Mosser, B. & Appourchaux, T. 2009, A&A, 508, 877
- Mosser et al. (2011) Mosser, B., Barban, C., Montalbán, J., et al. 2011, A&A, 532, A86
- Mosser et al. (2009) Mosser, B., Michel, E., Appourchaux, T., et al. 2009, A&A, 506, 33
- Roxburgh (2009) Roxburgh, I. W. 2009, A&A, 506, 435
- Verner et al. (2011) Verner, G. A., Elsworth, Y., Chaplin, W. J., et al. 2011, MNRAS, 415, 3539
- Walker et al. (2003) Walker, G., Matthews, J., Kuschnig, R., et al. 2003, PASP, 115, 1023