Effect of an electric field on superfluid helium scintillation produced by -particle sources
Abstract
We report a study of the intensity and time dependence of scintillation produced by weak -particle sources in superfluid helium in the presence of an electric field ( kV/cm) in the temperature range of 0.2 K to 1.1 K at the saturated vapor pressure. Both the prompt and the delayed components of the scintillation exhibit a reduction in intensity with the application of an electric field. The reduction in the intensity of the prompt component is well approximated by a linear dependence on the electric field strength with a reduction of 15% at 45 kV/cm. When analyzed using the Kramers theory of columnar recombination, this electric field dependence leads to the conclusion that roughly 40% of the scintillation results from species formed from atoms originally promoted to excited states and 60% from excimers created by ionization and subsequent recombination with the charges initially having a cylindrical Gaussian distribution about the track of 60 nm radius. The intensity of the delayed component of the scintillation has a stronger dependence on the electric field strength and on temperature. The implications of these data on the mechanisms affecting scintillation in liquid helium are discussed.
pacs:
34.50.Gb, 33.50.-j,82.20.PmI Introduction
The phenomenon of liquid helium (LHe) scintillation due to passage of charged particles was discovered in the late 1950’s THO59 ; FLE59 . Since then rather extensive studies have been conducted, motivated both by its intrinsic interest (including an interest in illuminating the behavior of ions and neutrals in superfluid helium) and by the application of liquid helium as a particle detector BAN96 ; MCK03 . (For a brief review of early work, see Ref. DUN71 . A more recent review can be found in the introduction of Ref. MCK03 .)
The following picture has emerged from these studies as the process for liquid helium scintillation production (see e.g. Refs. MCK03 ; MCK02 ; ADA01 ; GUO09 ): when a charged particle passes through liquid helium, it deposits energy to the medium, part of which goes to ionization, creating electron-ion pairs along its track. The deposited energy also goes to promoting atoms to excited states. The value, the average energy required to produce one electron-ion pair, in liquid helium is eV JES55 . Electrons and ions then thermalize with the liquid helium. The electron subsequently forms a “bubble” in the liquid, pushing away surrounding helium atoms as a consequence of Pauli exclusion. The He+ ion, on the other hand, forms a “helium snowball” attracting surrounding helium atoms. The bubbles and snowballs then recombine quickly ( s) forming excited helium molecules (excimers). The molecules are formed in the triplet and singlet states. The lowest-energy singlet state molecule, He2(A), radiatively decays in less than 10-8 s to the (unbound) ground state, emitting a eV extreme-ultraviolet (EUV) photon, contributing to the prompt component of scintillation. Excited atoms in singlet states also contribute to the prompt scintillation signal. The triplet state molecule, He2(a), on the other hand, has a lifetime of s in liquid helium MCK99 ; KON91 . In a high excitation density environment, however, the triplet state excimers can also be destroyed through the Penning ionization process
| (1) |
or
| (2) |
If a singlet excimer is formed as a result of Penning ionization after the first s, then it makes a contribution to the delayed scintillation component.
The study of liquid helium scintillation has been conducted using radioactive sources, such as , conversion electron, and sources as well as electron beams. There were also experiments that studied liquid helium scintillation induced by the products of the 3He(,)3H reaction MCK03 ; ARC06 . Various characteristics of the scintillation light depend on the type of ionizing particles employed. When a or conversion electron source is used, the scintillation light yield is known not to show a strong temperature dependence, whereas when the scintillation is induced by particles, the scintillation yield does exhibit a temperature dependence. In addition, a difference in time dependence of the scintillation signal has been observed between -induced scintillation and -induced scintillation MCK03 : -induced scintillation light shows a long lived component that decays with a dependence following the prompt pulse. This slow component shows up as a series of single photoelectron (PE) pulses following the prompt pulse in an experiment in which the EUV scintillation is wavelength-shifted and detected using a photomultiplier (PMT). (Thus these single PE pulses are called “afterpulses”.) A typical PMT oscilloscope trace from our experiment described in this paper is shown in Fig. 1.
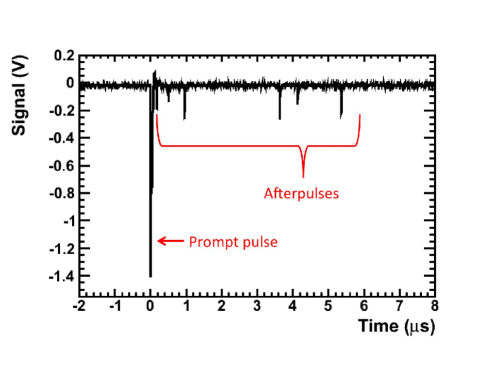
One distinct difference between tracks and electron tracks is the ionization density. For example, a 5.5-MeV particle deposits energy into superfluid liquid helium ( g/cm3) at a rate of eV/m on average along its 0.27 mm long track111The maximum energy deposition rate is eV/m and occurs when the remaining kinetic energy is 0.65 MeV., whereas for a 500 keV electron, the average energy deposition rate is 40 eV/m NISTSTAR . With eV, it follows that ionization events are separated by an average distance of nm and nm in and electron tracks, respectively. With an average separation of several tens of nanometers between the electron and its parent ion TEN63 , ionization events in tracks overlap with each other whereas electron-ion pairs are well separated in electron tracks. As we will discuss later, many of the differences in the characteristics between -induced scintillation and electron-induced scintillation can be attributed to the difference in the ionization density. Although the amount of data on LHe scintillation induced by protons and tritons from the 3He(,)3H reaction is rather limited, it shows qualitatively similar characteristics to -induced scintillation because of the high ionization density of the proton and triton tracks.
In establishing the picture described above, a study of scintillation in the presence of an electric field played an important role. The effect of an electric field on the LHe scintillation was first studied by Hereford and Moss HER66 . In this study, the authors measured both the intensity of -particle-induced scintillation and the ionization current extracted from the tracks in the presence of an electric field (9 to 43 kV/cm) in the temperature range of 1.23 to 4.2 K. The scintillation signal was integrated over s. They observed a decrease in the scintillation intensity and a corresponding increase in the ionization current with an increasing electric field222Hereford and Moss HER66 arrived at a conclusion that recombination luminescence accounts for approximately 60% of the total scintillation intensity with zero electric field. While their experiment clearly established that recombination luminescence accounts for a large fraction of LHe scintillation, their analysis that led to the specific value of 60% for the fraction due recombination luminescence does not appear valid in the light of what is now known about the properties of ions and excimers along the track of an particle..
We have extended their work and have studied the effect of an application of an electric field on both the prompt scintillation and afterpulses in the temperature range of 0.2 K to 1.1 K with an electric field up to kV/cm. We measured the time dependence of the scintillation signal up to 14 s.
The research reported here is directed primarily towards an understanding of the physical processes underlying the electric field dependence of the scintillation yield of liquid helium. It provides information on the dynamics of the charged particles generated by the passage of an alpha particle through helium and the interaction of molecular species produced on recombination. However, the work is motivated by the desire to use helium scintillation in the presence of a high electric field in the nEDM experiment nEDM ; ITO07 .
The nEDM experiment, currently being developed to be mounted at the Spallation Neutron Source at the Oak Ridge National Laboratory, will search for the neutron electric dipole moment (EDM) using a method proposed by Golub and Lamoreaux GOL94 . In this experiment, spin polarized ultra cold neutrons will be produced and stored in a volume filled with superfluid helium, to which spin polarized 3He atoms will be added as cohabiting magnetometer. LHe scintillation produced by the reaction products of the spin-dependent 3He(,)3H reaction will be used to analyze the spin of the neutrons. The signature of a non-zero EDM is a shift in the neutron precession frequency upon application of an electric field. Therefore, the effects of an electric field on LHe scintillation produced by heavy particles such as protons, tritons, and particles are of particular interest. An earlier study performed by part of the nEDM collaboration on LHe scintillation produced by the products of neutron capture on 3He was reported in Ref. ARC06 .
II Experimental apparatus and procedure
II.1 Overview
The experiment was performed using a Leiden Cryogenics model CF-600 cryogen-free dilution refrigerator LEIDEN , which had a measured cooling power of 1.8 mW at 0.2 K. A measurement cell, which housed the electrodes immersed in LHe, was mounted on the mixing chamber of the dilution refrigerator (DR). An 241Am source was electroplated on the ground electrode. particles from the source induced scintillation light in the volume of LHe between the electrodes. The EUV scintillation light was converted to blue light by a wavelength shifter, then was guided through a light guide to the viewport at the bottom of the measurement cell and to a PMT mounted outside the measurement cell in vacuum. A description of each component is given below.
II.2 Measurement cell, the electrodes, and the PMT
A schematic of the measurement cell and the PMT is shown in Fig. 2. The measurement cell was made of a stainless steel cross with 4-5/8” and 4-3/4” conflat flanges attached to its ends. The volume of the LHe inside the cell was approximately 600 ml. At the top of the cell was a heat exchanger made of stack of gold-coated copper plates, which provided cooling from the mixing chamber to the LHe inside the cell.
The electrodes were made of stainless steel. The ground electrode was 19.05 mm in diameter and 6.35 mm in thickness, and had an edge rounded with a radius of 3.175 mm. The high voltage (HV) electrode was 19.05 mm in diameter and 12.7 mm in thickness, and had an edge rounded with a radius of 6.35 mm. The gap between the electrodes was approximately 4 mm.
The HV electrode was mounted on a commercially made HV vacuum feedthrough. The HV was supplied by a Glassman High Voltage Inc. Model EH30R3 power supply. A thin wall stainless steel tubing was used as the HV wire inside the cryostat to reduce the heat load. A HV resistor ( G or M) needed to be inserted in series in the HV cable, in order to reduce the noise on the PMT signal induced by the ripple of the HV power supply for the HV electrode. The capacitance of the HV cable and this resistor formed a low pass filter, which reduced the effect of the ripple to a sufficiently low level.
Approximately 300 Bq of 241Am was electroplated on the ground electrode. The activity had a diameter of 6 mm. Because the range of 5.5 MeV particles in superfluid liquid helium is only mm, the ionization due to particles occurred in a region very close to the surface of the ground electrode. The electric field at the location of the ionization was uniform to 5%. Larger electrodes and a smaller gap would have given a more uniform electric field at the location of the ionization. However, that would have, at the same time, significantly reduced the fraction of EUV photons detected and hence the detection efficiency by limiting the solid angle subtended at the location of the ionization by the wavelength-shifter-coated surface. The size and shape of the electrodes were chosen as a compromise between electric field uniformity and the detection efficiency.
The electrodes were enclosed in a sleeve made of G10. This was to prevent possible HV breakdowns due to the HV electrode seeing structures on the inner walls of the stainless steel measurement cell.
A sapphire viewport with a view diameter of 49.3 mm was mounted at the bottom of the measurement cell. An acrylic light guide with a diameter of 49.3 mm and a length of 30.5 mm was mounted between the viewport and the G10 sleeve. The G10 sleeve had a 48 mm diameter hole on the side to allow the scintillation light to reach the light guide. The top surface of the light guide was coated with polystyrene doped with tetraphenyl butadiene (TPB), which is known to have good EUV-visible conversion properties (see Ref. MCK97 and references therein). A Hamamatsu R7725 PMT, modified for cryogenic use with a Pt underlayer MEY10 , was mounted underneath the viewport in vacuum.
A fraction of the particle induced EUV light emitted from the region between the electrodes was converted to blue light at the top surface of the light guide. The blue light was then guided towards the PMT through the light guide, transmitted through the sapphire viewport and then detected by the PMT. The fraction of the EUV light that reached the TPB coated surface of the light guide was about 5% (determined by the solid angle subtended by the coated surface of the light guide at the location of scintillation events). The overall detection efficiency of the apparatus (= the number of detected PEs per emitted EUV photon) was estimated to be from the solid angle mentioned above (5%), the EUV to visible conversion efficiency (% MCK97 ), the estimated transport efficiency of the visible light (%), and the PMT’s quantum efficiency (18% MEY10 ). The observed number of PEs in the prompt pulse in the absence of an electric field (see Sec. III.1) was consistent with the expectation based on the known scintillation efficiency (= the number of EUV photons in the prompt pulse per energy deposition) ADA95 and the estimated detection efficiency.
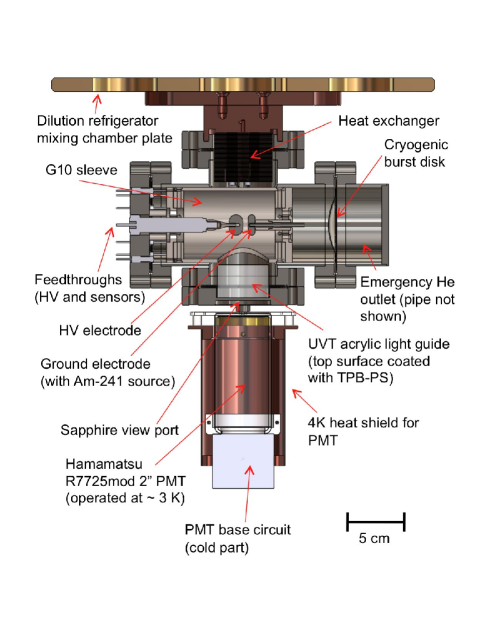
The PMT was thermally anchored to the 3 K plate of the DR, which was cooled by a pulse-tube refrigerator, in order to reduce heat load, both radiative and conductive, to the measurement cell. The base circuit adopted the split design described in Ref. MEY10 with some modifications. The resistor chain was heat-sunk on the 3 K plate. In order to reduce the heat load from the Joule heating of the resistor chain, a resistor value 10 times larger than the manufacturer recommended value was used. Because of the low event rate ( s-1), this did not affect the performance of the PMT. The rest of the base circuit, which consisted mostly of capacitors, was mounted at the back of the PMT. Previously, this PMT model had been demonstrated to function properly at temperatures down to K MEY10 . The present work showed that it functions properly at K.
There were two RuO2 temperature sensors mounted on the G10 sleeve to monitor the temperature of the LHe inside the measurement cell. There were two LHe level sensors inside the measurement cell. They were each made of two concentric cylinders that formed a capacitor. One was mounted in such way that it surrounded the heat exchanger and the other surrounded the light guide, monitoring the LHe level at the top and the bottom of the measurement cell. In addition there was a LHe pressure sensor monitoring the LHe pressure inside the measurement cell. A silicon diode sensor was mounted on the PMT as well as on the PMT heat shield to monitor the temperature of the PMT and the heat shield.
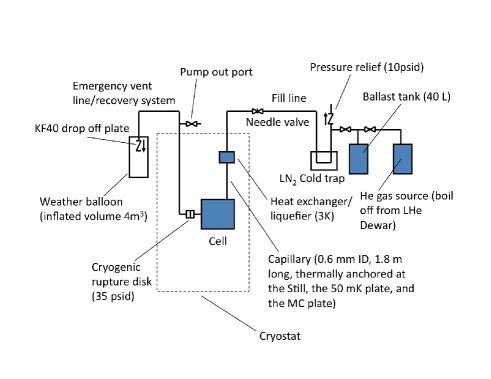
II.3 Helium gas/liquid handling
A schematic of the helium gas/liquid flow in the system is shown in Fig. 3. In filling the system, clean helium gas taken from boiloff from a Dewar was further cleaned by a LN2 cold trap and then was introduced into the system. The helium was first condensed by a liquefier (a box filled with sintered metal) mounted at the 3 K plate, then flowed through a capillary tube with an ID of 0.6 mm and a length of 1.8 m which was thermally anchored at the still, the 50 mK plate, and at the mixing chamber plate to the measurement cell. The cell was filled with the DR running, which kept the cell temperature at K during the fill. It took approximately 24 hours to fill the 600 ml cell in this way.
II.4 Data acquisition system
Data on the PMT signal were collected using a CAMAC and NIM based data acquisition (DAQ) system. The schematic of the DAQ system is shown in Fig. 4. The trigger was generated by a discriminator whose threshold was set to a level corresponding to a fraction of a PE, which allowed us to monitor the PMT gain using single PE events from the dark noise.
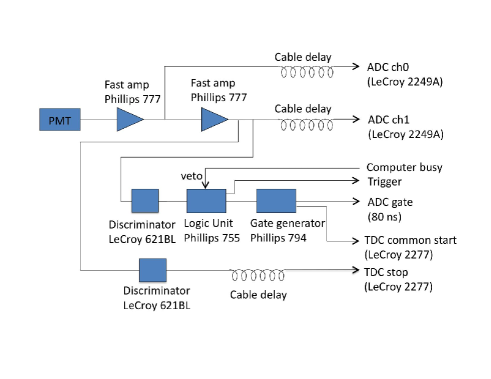
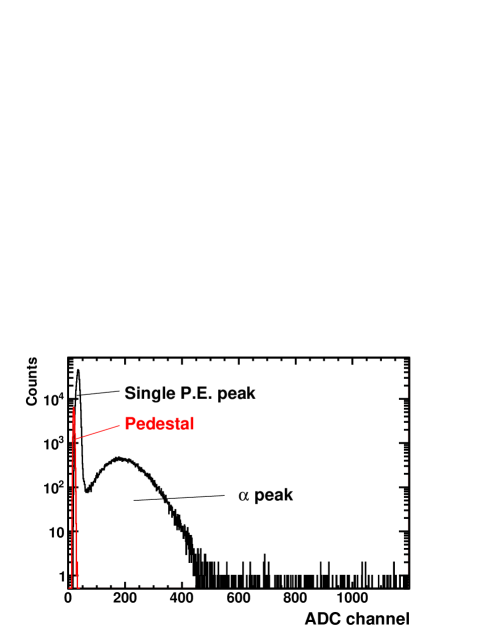
For each event, the size of the prompt signal was recorded using a Lecroy 2249A charge-sensitive analog-to-digital converter (ADC) with a 80 ns-long gate. The length of the gate was chosen to capture all of the prompt part of the signal (see Fig. 1). The PMT signal was amplified and then was split into two, one of which was further amplified with a gain of before being fed to the ADC. The high-gain signal (ADC ch1 in Fig. 4) was used to monitor the PMT gain using the single PE events from the dark noise. The low-gain signal (ADC ch0 in Fig. 4) was used to measure the size of the signal generated by particles. Randomly generated pulses were mixed into the trigger in order to monitor the ADC pedestal. A typical low-gain ADC spectrum is shown in Fig. 5.
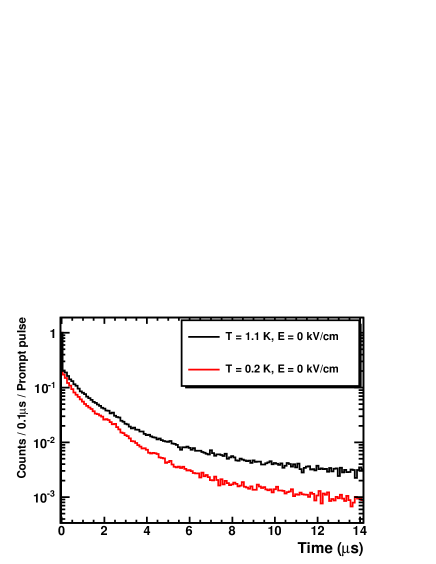
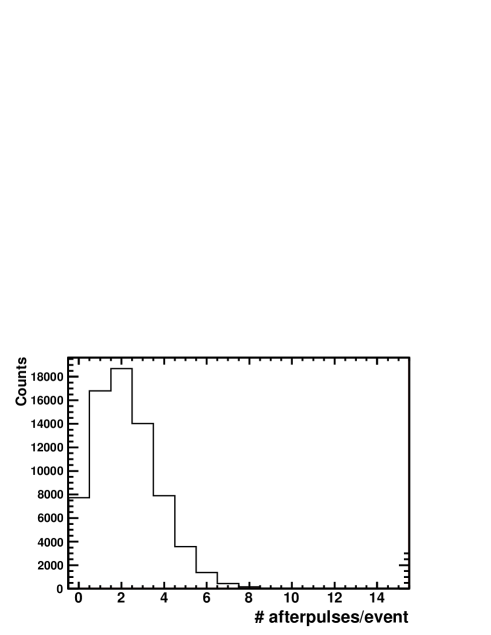
The intensity of the delayed component was measured by recording the timing of each afterpulse (see Fig. 1) with respect to the prompt pulse using a Lecroy 2277 multi-hit TDC. This TDC can record up to 16 hits within a 16 s time window. Typical time spectra thus obtained are shown in Fig. 6 for two temperatures. Also a typical distribution of the number of afterpulses per event is shown in Fig. 7.
II.5 Experiment
The cell was filled with LHe following the procedure described in Sec. II.3. Once the cell was filled and a desirable measurement cell temperature was reached, the prompt scintillation yield and the time spectrum of the afterpulses were measured as the function of the applied HV. When increasing or decreasing the HV, the PMT was kept turned off to protect the PMT from being exposed to bright flashes of light due to HV breakdowns, which occurred occasionally when changing the HV setting; we had found that exposing the PMT to flashes of light from HV breakdowns decreased the PMT gain and the change appeared to be permanent. The HV electrode was biased with a negative voltage. For each HV and temperature setting, data were acquired for approximately 5 minutes, which corresponds to prompt scintillation events. Each of such a continuous data taking period is called a “run”.
Data were taken at five different temperature settings. The average temperature and the 1- variation in temperature for each of these settings were mK, mK, mK, mK, and mK. In the remainder of this paper, for conciseness we refer to these temperatures by their “nominal” values: 0.2 K, 0.3 K, 0.4 K, 1.0 K, and 1.1 K. In addition, data were taken at temperatures up to 2 K with no HV applied. The gap in the data between 0.4 K and 1.0 K was due to a thermal short that developed in the system after the data were taken for 0.4 K, 0.2 K, and 0.3 K. The thermal short did not allow the system to run below 1.0 K.
As mentioned earlier, a HV resistor was inserted in the HV supply line to suppress noise due to the ripple on the HV. Most of the data were taken with a 1 G resistor. The results did not change when a 1 M resistor was used, confirming that the resistance between the two electrodes was significantly larger than 1 G and the voltage across the electrode gap was indeed what was supplied by the HV power supply.
III Data analysis and results
III.1 Analysis of the ADC data
The effect of the electric field on the prompt scintillation yield manifests itself as a shift in the peak in the low-gain ADC spectrum. In order to remove effects due to possible changes in the PMT gain, the horizontal scale of the spectrum needs to be properly calibrated in terms of the number of PEs. As noted earlier, the gain of the PMT was continuously monitored throughout the experiment by the high-gain ADC that recorded single PE events from the dark noise. In order to calibrate the horizontal scale of the low-gain ADC spectrum using the PMT gain information obtained by the high-gain ADC, it is necessary to determine the gain of the amplifier. This was achieved by determining the slope of the correlation between the high-gain and low-gain ADC spectra. Determination of the PMT gain and the amplifier gain was performed for each run.
The resulting low-gain ADC spectrum was fit to determine the location of the peak using the following model function (a Poisson distribution representing the distribution of the number of PEs convoluted with a Gaussian distribution representing the PMT response):
| (3) |
where is the overall normalization, a variable corresponding to the ADC channel, the mean number of photoelectrons, and the gain of the system (the ADC channel corresponding to one PE). is given by
| (4) |
where is the width of the response function of the PMT for single PE events and is the width of the ADC pedestal. and were determined by fitting to the single PE and pedestal peaks respectively, prior to fitting Eq. (3) to the peak. and were varied in the peak fit. The shape of the peak in the low-gain ADC spectrum is well described by the model function in Eq. (3) (see Fig. 8).
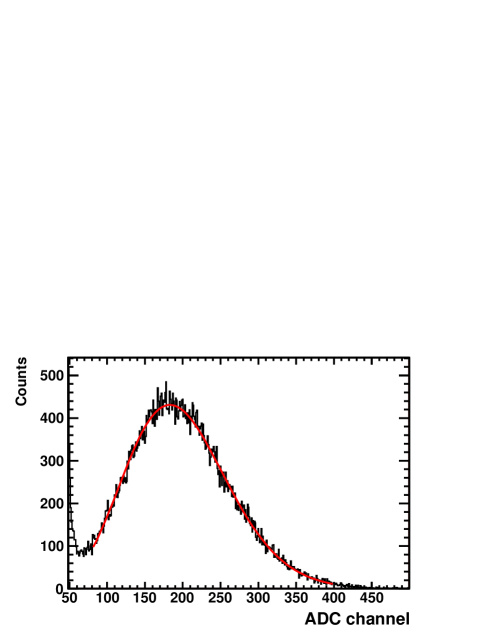
Figure 9 shows the dependence of the mean number of PEs observed in the prompt pulse () on the temperature with no electric field. Shown in Fig. 10 is plotted against the strength of the electric field for different temperatures. The prompt scintillation yield decreases by about 15% with an electric field of 45 kV/cm. The effect of the electric field on the prompt scintillation has little temperature dependence.
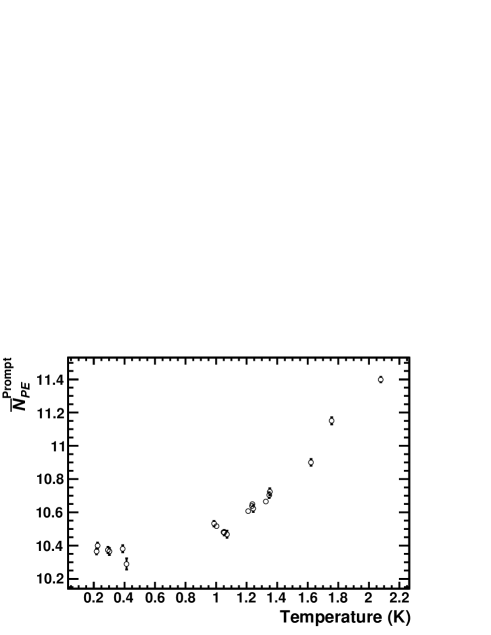
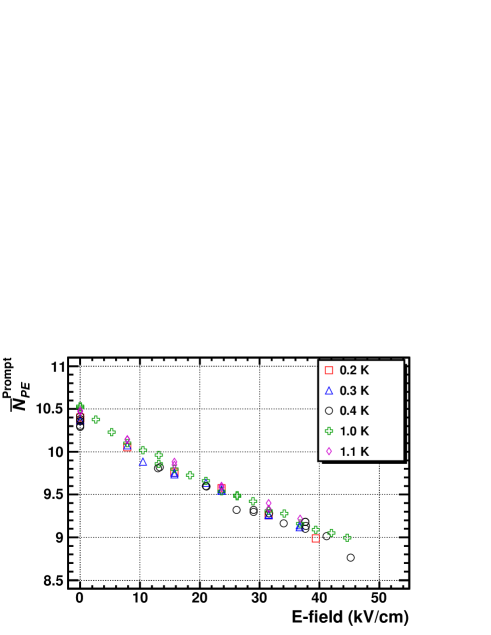
Our data shown in Figs. 9 and 10 are qualitatively consistent with what was observed in the earlier work by Hereford and coworkers HER66 ; ROB73 . (Compare, for example, Fig. 9 of this work with Fig. 2 of Ref. ROB73 and Fig. 10 of this work with Fig. 3 of Ref. HER66 .) Note, however, that a direct comparison between our data and the data in Refs. HER66 and ROB73 cannot be made because of the difference in the integration time for the prompt pulse.
III.2 Analysis of the TDC data
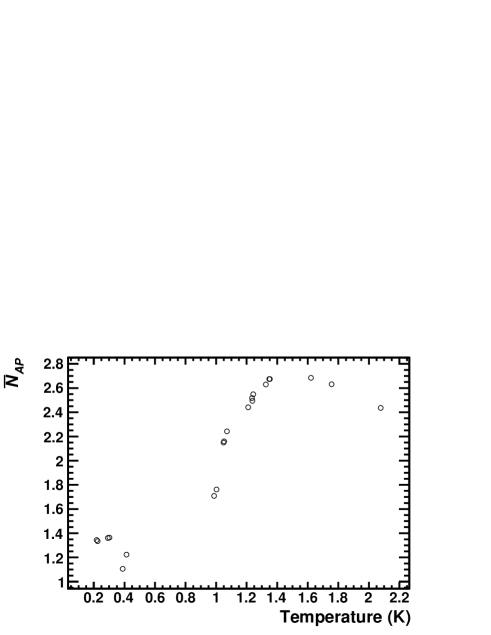
The mean number of afterpulses per prompt pulse observed in the first 14 s was determined by fitting a Poisson distribution to the observed distribution of the number of afterpulses per event (Fig. 7). The mean number of afterpulses per prompt pulse thus obtained () is plotted against the temperature in Fig. 11. Our results, showing a reduction in the afterpulse intensity at lowered temperatures, are consistent with Refs. MCK03 and ROB73 . (Although Ref. ROB73 only shows a plot of the “pulse height” which is the signal integrated for the first 1 s, and the total intensity plotted against the temperature, the temperature dependence of the afterpulse intensity can be inferred from the data.)
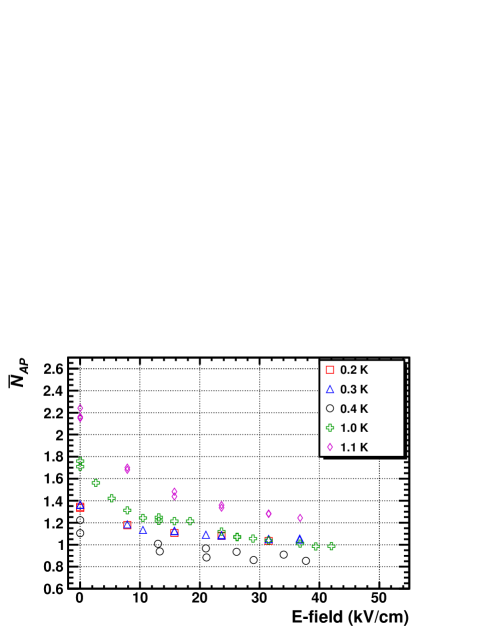
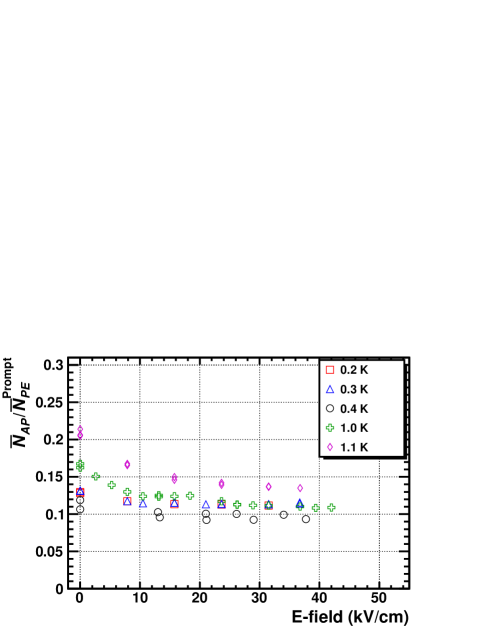
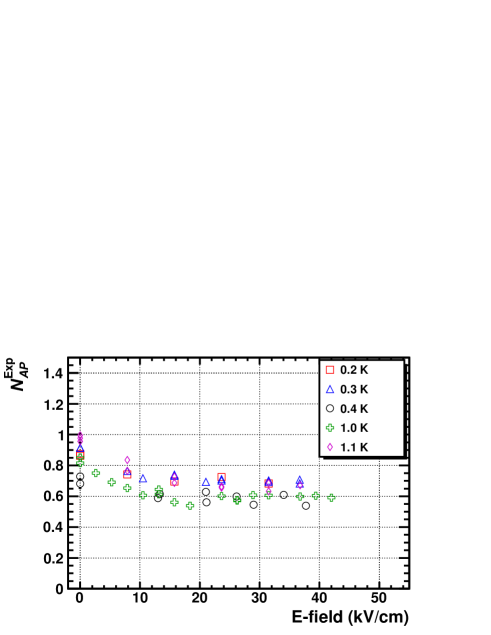
Figures 12 and 13 show the mean number of the afterpulses () and the mean number of the afterpulses normalized to the mean number of PEs observed in the prompt pulse () plotted against the strength of the electric field, respectively. We see from the figures that the afterpulse intensity decreases with an increasing electric field strength (Fig. 12) and that the afterpulse intensity is more strongly affected by the electric field than the prompt scintillation (Fig. 13). Also, in contrast to the prompt scintillation, the effect of the electric field on the afterpulse intensity exhibits some temperature dependence.
IV Discussion
What we have observed from our data can be summarized as follows:
1) The prompt scintillation yield is reduced by 15% at kV/cm.
2) The reduction in the prompt scintillation yield is approximately
linear in the strength of the electric field.
3) The effect of the electric field on the prompt scintillation yield
has a very weak temperature dependence in the temperature range of
0.2 K to 1.1 K.
4) The electric field has a stronger effect on the intensity of the
delayed component than it has on the intensity of the prompt pulse.
5) The observed temperature dependence of the prompt and
afterpulse intensities at zero electric field is in qualitative
agreement with previous work.
Below we discuss the implication of these observations.
IV.1 Effect of an electric field on the prompt scintillation
The prompt scintillation signal is the result of the radiative decay of singlet He∗ atoms in excited states and of He excimers also in singlet states. An particle produces these excimers and atoms either by ionization followed by recombination or by promoting an atom directly to an excited state without ionization. The ratio of the number of direct excitations to ionizations has been predicted in helium to be 0.45:1 SAT74 . (Although this calculation was performed with 100 keV electrons as the primary particle, the expectation is that it holds for particles as well SAT76 .) Among the atoms promoted directly to excited states, the ratio of singlets to triplets was calculated to be 5:1. On the other hand, the ratio of singlets to triplets formed by recombination of ionized atoms is expected to be the statistical value of 1:3 for particles (not the case when electrons are the primary ionizing particle ADA01 ). Scintillation from atoms in excited states that have previously not undergone ionization is not affected by an electric field whereas the number of those that have been ionized is decreased in an electric field because of charge separation. Were there no other complicating factors, the electric field-dependent fraction, , of the prompt scintillation would be . However, a number of phenomena can influence this fraction, most likely increasing its value.
1) The prompt signal for particles is substantially quenched ADA01 by the nonradiative destruction of singlet excimers by the Penning process [Eq. (2)] but by the same mechanism it may be slightly enhanced with the destruction of triplet excimers and the subsequent recombination of the resulting ions into singlet states. Excited state singlet atoms may also nonradiatively decay upon interaction with other species of excitations. (Nonradiative destruction of singlet species is discussed in Sec. IV.4.2.)
2) Singlet helium atoms in excited states with principal quantum number, , of 3 or greater can autoionize by the Hornbeck-Molnar process HOR51
| (5) |
since the binding energy of He is eV, which is greater than the energy to ionize a He() atom. Based on the oscillator strengths for the transitions between the ground state and the various excited states of helium BER97 slightly more than one third of the atoms promoted to excited states will have a principal quantum number of 3 or greater, the other two thirds having . If all atoms with were to undergo autoionization, then the electric field-dependent fraction of the prompt scintillation would be increased to .
Various theoretical models have been developed that describe electron-ion recombination in an ionization track in fluid media: Jaffe’s columnar theory of recombination JAF13 ; KRA52 describes the case in which a dense plasma of positive and negative ions is formed along the ionization tracks while Onsager’s theory ONS38 describes the case where each electron-ion pair is spatially separated and recombination occurs between an electron and its parent ion (geminate recombination). For the highly ionizing track of an particle in LHe, the Jaffe model would appear the more applicable.
In the columnar theory, the rate of recombination is governed by the following equations:
| (6) |
and
| (7) |
where and are the densities of the snowballs and bubbles, and are the mobilities, and are the diffusion coefficients, and is the recombination coefficient. What this model describes are clouds of negative and position ions being pulled away from each other by the electric field while at the same time recombining at a rate proportional to the product of their densities. Also, the clouds expand radially due to the diffusive motion of the charges. Both the reduction in the scintillation yield and the generation of an ionization current result from the suppression of recombination due to the presence of an electric field. The motion and recombination of electrons and ions described by these equations occur on a time scale of s after an particle is stopped in helium. The processes associated with the decay and destruction of excimers created on recombination, processes that are not influenced by the electric field and occur on time scales of to s, are discussed separately in later sections.
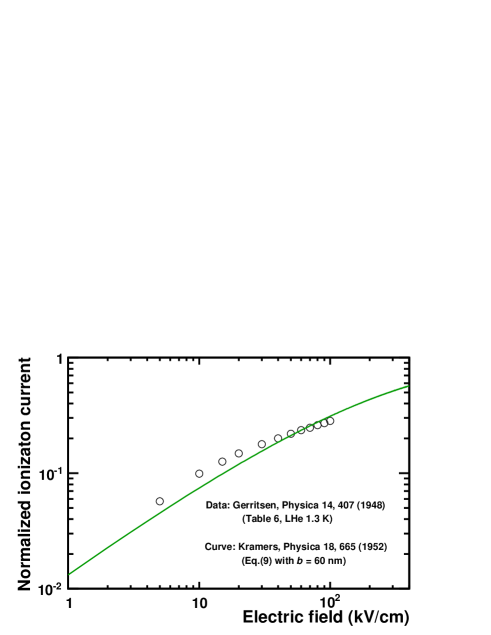
In looking for a solution to these rate equations Jaffe assumed the diffusion terms were larger than those associated with recombination and hence, along with the electric field term, were the principal cause of the change in densities of the charges. This is a valid approach for ionization in gases. On the other hand, Kramers KRA52 , in attempting to explain the electric field dependence of the ionization currents from particles stopped in liquid helium measured by Gerritsen GER48 , pointed out that in a dense fluid the diffusivity of the ions is small and that recombination has a much larger influence on the time dependence of the charge density. Gerritsen’s data for the electric field dependence of the ionization current can be fit approximately by the Kramers theory with a cylindrical Gaussian charge distribution having the same density and spatial distribution for and
| (8) |
where is the initial number of positive ion snowballs or electron bubbles per unit length along the track. The diffusion coefficient was assumed to be zero. The relationship between the recombination coefficient and the mobilities is given by the Langevin relation (see below). The best fit of Kramers’ theory to Gerritsen’s data with the one adjustable parameter, nm, is shown in Fig. 14.
Several comments regarding this result are relevant to understanding the scintillation and ionization currents of LHe.
1) The ionization current data contains contributions that are not included in the Jaffe-Kramers theory, which describes the ionization current due to charge carriers that escaped the initial recombination 333In the literature, the term “initial recombination” is used to mean “geminate recombination” as discussed in Ref. ONS38 . Here we use the term “initial recombination” to mean the recombination that immediately follows the passage of an particle. . However, at electric field strengths below that corresponding to the saturation current, charge carriers that initially recombine can contribute to the ionization current through processes such as Penning ionization [Eqs. (1) and (2)]. A crude estimate indicates that such contributions could be larger than 10%.
2) The Langevin relation between recombination coefficient and mobility is . In the approximation that the mobilities of the two species are the same, the electric field dependence of the current is independent of mobility, as it enters the recombination and electric field terms in the same manner. At the temperature within the track of approximately 2 K (see below), the mobilities of the positive and negative ions are approximately the same DON98 , having the value of m2/(Vs). Hence the recombination coefficient is m3/s.
3) From the Einstein relation , the diffusion coefficient is calculated to be m2/s. Since the initial charge densities along the track are the order of m-3, diffusion plays little role in affecting the density distribution at early times when recombination is dominant. At longer times when the concentrations have decreased substantially, diffusion can influence the charge separation.
4) The assumption that the positive ions and the electron bubbles initially have the same spatial distribution is unlikely to be correct. The ionization events from the particle or from secondary electrons with energy sufficient to create further ionizations occur in a small cylinder about the track of less than 10 nm. He ions do not move appreciably in the time it takes for the electrons to thermalize and form a bubble. However, once the energy of secondary electrons drops below 20 eV, the first excited state of He, the only process by which they can lose energy is elastic scattering from helium atoms. Since the fraction of energy an electron loses in such a collision is very small, being dependent on the ratio of the mass of the electron to that of the atom, the order of collisions are required to decrease an initial energy of 10 eV to below 0.1 eV thought to be necessary for bubble formation. From the cross section for elastic scattering, which varies from cm2 between 1 and 10 eV, and the liquid density, the mean free path is roughly nm and the mean distance for diffusion, proportional to the square root of the number of scatters, is the order of 100 nm BEN99 . But as Muoz et al. MUN86 point out, if the initial positive and negative charge distributions are Gaussian with very different radii, then the radial field arising from the different charge distributions can be large, easily in the range of 100 to 1000 kV/cm for an track in helium assuming 10 nm for the radius of the positive ions and 100 nm for the electrons. The two distinct distributions will therefore rapidly merge to form a more uniform distribution assumed in the Jaffe and Kramers theories. The positive ion snowballs having a mobility comparable to that of the electron bubble at the initial temperature of K along the track (see below), will expand outward and the electrons contract inward.
5) A significant fraction of the secondary electron produced by an particle have energies above the He ionization energy of 24.6 eV and are therefore capable of creating further ionization. At low energies the probability that a secondary electron will have a particular energy decreases relatively slowly with increasing energy, varying as ROS52 . Since the cross section for ionization or excitation by an electron in the range of 25 to several hundred eV is the order of cm2, these ionizations/excitations would occur a considerable distance from the track were it not for elastic scattering. The elastic scattering cross section for an 100 eV electron is cm2 so that energetic electrons will undergo many random scatters, on average remaining in the vicinity of the track. Such electron may have the effect of modifying the charge distribution but not to the extent that a Gaussian distribution is not a reasonable approximation.
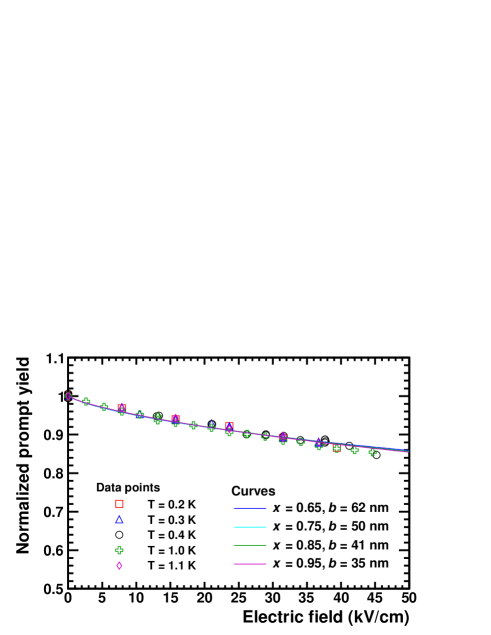
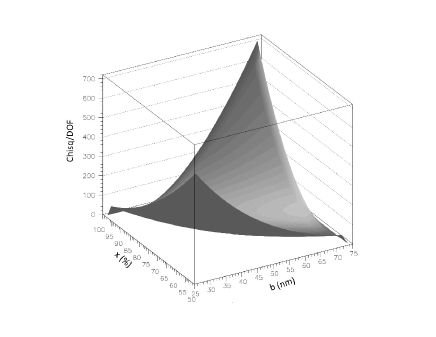
The measured electric field dependence of the prompt scintillation can be fit well using the Kramers theory for a range of different Gaussian widths, . The value of depends on the choice of the fraction, , of scintillation resulting from species created by ionization, which can be affected by the electric field. The results are shown in Fig. 15. Figure 16 shows the per degree of freedom of the fit of Kramers theory to the prompt scintillation data plotted against and . If is taken to be 0.95 then the best fit is for nm, while for , nm. In the Kramers theory KRA52 , the fraction of ions that recombine depends on a single parameter . That is, increasing the radius of the track has the same effect as increasing the electric field . From this it is expected that a smaller would require a larger . Our results (Figs. 15 and 16) are consistent with this expectation.
A few comments about the relationship between ionization current and the effect of an electric field on the prompt scintillation intensity are appropriate. These two types of data reflect two different aspects of the same phenomenon, and as such it should be possible to construct a model that describe both data consistently. However, such an attempt is complicated by a number of factors. 1) As mentioned earlier, the ionization current has a contribution from charge carriers that initially recombine. 2) There is uncertainty in the value of . 3) Even with a short integration time (in our case ns), there is inevitably a contribution to the prompt signal from the delayed component, which has a different electric field dependence (see Sec IV.C). Because of these complications we have not attempted a unified analysis of our data and Gerritsen’s ionization current data. While we note that, as seen in Figs. 15 and 16, there is considerable range in the values of and that fit the data, the choice of and nm is consistent both with our estimate of the fraction and the best fit of Kramers’ theory to Gerritsen’s data.
As seen in Fig. 15, the effect of the electric field on the prompt scintillation has little temperature dependence. This is attributed to three causes: 1) The effect of the electric field on recombination is nearly independent of the mobility of the ions as discussed earlier. 2) The initial temperature of the track is in the vicinity of 2 K, irrespective of the temperature of the bulk liquid (see below), resulting in the same mobility of ions in the track irrespective of the bulk liquid temperature. 3) The characteristic time of recombination , where is the initial ionization density, is shorter than the time it takes the track to thermalize with the bulk liquid , where is the sound velocity ( m/s). Indeed, with nm, which gives m-3, the recombination time is s as compared to the thermalization time s.
IV.2 Temperature dependence of the prompt scintillation
The fraction of energy of an particle that is quickly down converted to excitations of the superfluid, phonons and rotons, is sufficient to heat a column of liquid a few tens of nanometers radius along the track to the vicinity of 2 K irrespective of how low the temperature of the bulk liquid BAN95 . Since the density of liquid helium changes by less that 0.5% below 2 K, the initial environment in which the electrons, ions, excimers and excited state atoms reside, on their creation, is independent of the temperature of the bulk liquid. Therefore, the temperature dependence of the prompt scintillation, illustrated in Fig. 9, must result from the manner in which those entities responsible for the scintillation are influenced by the expansion of the roton/phonon cloud (with velocity of m/s) taking place at times the order of s. Below a temperature of 0.6 K the density of thermal excitations in the bulk liquid is so low that the hot columnar cloud expands into essentially a vacuum. But at higher temperatures the thermal excitations in the bulk become sufficiently dense to scatter and slow the radially expanding cloud.
As discussed below, the component of the afterpulse intensity also decreases with decreasing temperature. The temperature dependence of both the prompt and afterpulse signals is attributed to the more rapid decrease of the triplet excimer density due to expansion, leading to a reduced production of singlets via the Penning process.
Hereford and coworkers ROB73 ; ROB71 , in modeling the temperature dependence of the scintillation they observed, argued that the increased diffusion at low temperatures results increased quenching, that is, the enhanced nonradiative destruction of the singlet species. However, their argument was not informed by the fact that the roton and phonon densities in the vicinity of the track is essentially independent of the temperature of the bulk liquid.
IV.3 Temperature and electric field dependence of the afterpulse scintillation
Following the work of McKinsey et al. MCK03 the time dependence of the afterpulse scintillation for times between 0.4 s and 14 s has been characterized using the function
| (9) |
, , , and were varied in the fit. For convenience, we define , , and to be the contributions to the number of afterpulses from the first, second, and third terms in Eq. 9, respectively, that is
| (10) |
| (11) |
and
| (12) |
, , and are plotted as a function of the electric field for different temperatures in Figs. 17, 18, and 19 respectively. In Figs. 17 and 18, the 1.0 K data points for electric fields between 10 kV/cm and 20 kV/cm seem to show a larger scatter. We are not able to offer an explanation.
The value of that we obtained was s, slightly shorter than the value quoted in Ref. MCK03 . Our results show that it is nearly independent of the temperature and the electric field.
Also in Fig. 20, is plotted as a function of the temperature for zero electric field.
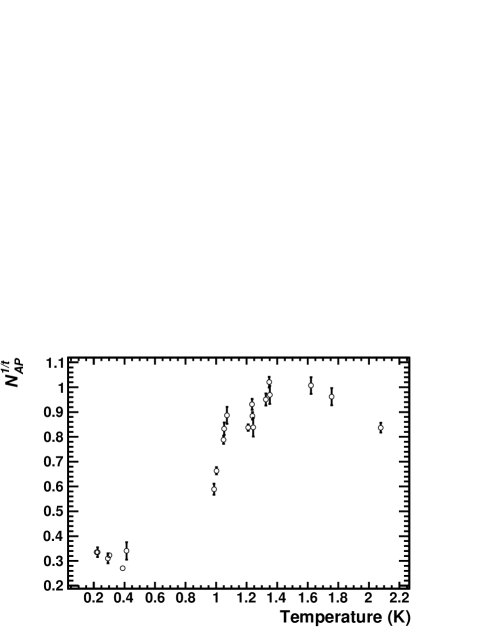
At times longer than s all singlet state excimers and excited atoms (except, perhaps, for the first excited state He(21S), which in vacuum has a lifetime of 19 ms VAN71 ), will have long decayed. Any photons produced at a later time must result from triplet states.
IV.3.1 Component dependent exponentially on time
McKinsey et al. MCK03 hypothesized that the afterpulse term dependent exponentially on time was the result of He(21S) atoms forming excimers in A states from which they radiatively decay to the dissociated ground state of the helium pair. Given that the lifetime of the triplet state He(23S) has been determined in the liquid to be 15 s KET74a , this appears to be a reasonable hypothesis. Furthermore, there appears to be little or no temperature dependence to the exponentially time-dependent term, as expected for such a source. On the other hand, one would not expect that a signal arising from a neutral atom to exhibit a dependence on electric field as we have observed (see Fig. 17), unless it originated through recombination. Since the probability that ions form excimers prior to recombination is high, atomic He(21S) appears more likely to be produced by decay from a higher lying He(n1P) state created de novo by electromagnetic excitation from the ground state than through a cascade from an atom formed by recombination. We are unable to offer an explanation of this exponentially time-dependent component of the afterpulse scintillation.
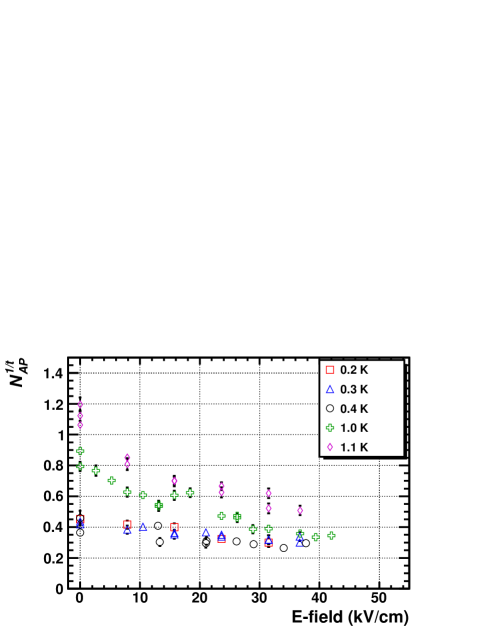
IV.3.2 Component dependent inversely on time
Keto et al. KET74b , using a beam of 160 keV electrons as the primary ionizing source, measured the long-time afterglow in the infrared spectra associated with a number of transitions between excited states of excimers and atoms to have a time dependence that varied as . They ascribed this time dependence to the production of the excited states by the Penning ionization of triplet excimers, since the bimolecular process,
| (13) |
results in proportional to for . A more detailed description of the time dependence of the singlet excimer density is expressed by Eq. (16) in the next Section. A similar relation can be given for the triplet density, the essentials of which for the purposes of this discussion are contained in Eq. (13).
The problem of describing the time dependence of the afterpulse scintillation from an particle differs from that in the work of Keto et al. KET74b since in one case the density of excimers is uniform whereas in the other the excimer cloud is expanding about the track.
King and Voltz KIN66 developed a theoretical model of afterpulses that includes the spatial evolution of the excimer density with time. The description involves the kinetics of the diffusion of the triplets at times well after the prompt scintillation has decayed. If the triplets maintain a Gaussian distribution as they expand by diffusion, then at long times the afterpulsing decreases approximately inversely with time. McKinsey et al. MCK03 cited this model by way of explaining the origin of the component of the afterpulses. At shorter times the King model predicts a time variation that is considerably faster than , but it does not provide an explanation of the exponential dependence on time, as experimentally observed.
The amplitude of the afterpulse component exhibits interesting temperature and electric field dependences. Firstly, the number of afterpulses varies much more with temperature than the number of photons in the prompt scintillation. Secondly, the number of afterpulses decreases more rapidly with increasing electric field than the prompt signal.
As with the slight variation of the prompt signal with temperature below 1 K, the rapid variation of the afterpulse component with temperature can be understood qualitatively as being the result of the change in propagation of the triplet excimers away from the track. While the temperature within the core of the track is not sensitive to the ambient temperature of the liquid, the thermal excitations in the surrounding liquid can affect the rate at which the excimers expand away from the track. At high temperatures, the excimers diffuse slowly because of scattering from phonons and rotons. At low temperatures the excimers propagate ballistically into the cold liquid in the absence of scattering. The excimer density drops much more rapidly at low temperatures and as a consequence the rate of generation of singlet species by the Penning process is strongly temperature dependent.
The strong electric field dependence of the component of the afterpulse results from the two separate ionization steps that are involved in the production of these photons. Firstly, the initial creation of triplet excimers by recombination is affected by the electric field in the same manner as is the production of singlet excimers responsible for the prompt signal. Secondly, the recombination of the electron-ion pair produced by the Penning process involving the triplet excimers is also influenced by the electric field. Those recombinations that result in singlet species are responsible for the component. Since the delayed generation of the electron-ion pair occurs in isolation from other charges, the recombination is geminate.
The Onsager theory of geminate recombination ONS38 is not an appropriate approach to calculating the effect of electric field on the separation of charges created via Penning ionization in liquid helium at low temperature. That theory assumes diffusion to be the dominant process affecting the charge motion in the presence of the field.
At low field and high temperatures where the ion mobilities are low the motion of the charges is governed by viscous drag. In this case the charges move along field lines, and whether two charges recombine or not is dependent only on the magnitude and direction of their initial separation with respect to an applied electric field. If the initial separation and is the angle between and the applied electric field , the charges will recombine if
| (14) |
Geminate recombination in LHe under this condition was studied in Ref. GUO11 using a source at 1.5 K. However, at 1 K where the mobility of ions is the order of m2/Vs The inertial term in the equation of motion becomes important at modest fields. In the limit of high mobility charges will recombine if
| (15) |
independent of orientation of the charges with respect to direction of the field. If this expression were used in conjunction with a Gaussian distribution of charge separations to fit the field dependence of the component of the afterpulse signal, the width of the distribution would be unreasonably small, much less than the 60 nm determined for the distribution of electrons about an alpha track. Since the average energy of electrons created by the Penning process responsible for the afterpulse component is comparable to the average energy of secondary electrons from an alpha, the inclusion of the inertial term in describing the ion motion does not provide a satisfactory explanation to the field dependence.
At low temperatures and at zero pressure both positive ion snowballs and electron bubbles moving in liquid helium create quantized vortex rings RAY64 when their velocities reach the order of 60 m/s. Since ion mobilities are the order of mVs, at 1 K, fields of less than 1 kV/cm are sufficient for vortex creation. At low fields the charges remain attached to the rings that they have produced, but in very high fields, greater than 25 kV/cm at low temperatures, it has been found NAN85 that electrons no longer remain attached to vortices but create and shed vortex rings as they move through the superfluid.
We have not attempted to apply the theory of vortex creation by moving ions MUI84 to explain the field dependence of the component of the afterpulses. The energy a charge acquires in moving in the field is transferred to the vortex, which increases its diameter and decreases its velocity. Qualitatively, the vortices introduce an enormous drag on the motion of the ions, which has the effect of retarding their separation by the applied field. Presumably vortices are the reason the field dependence of the afterpulses produced by Penning ionization is not stronger than observed.
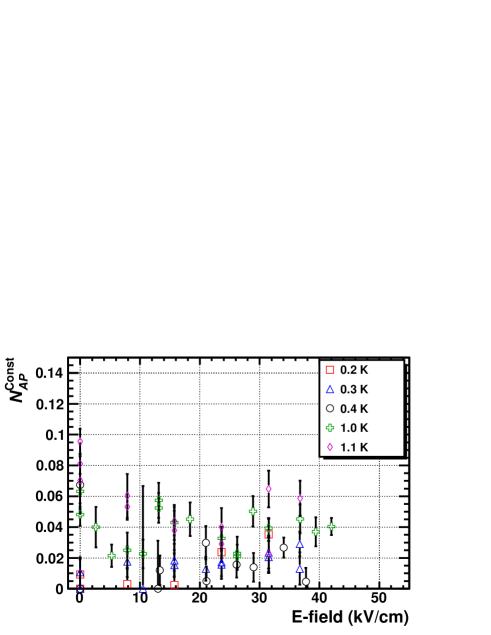
IV.3.3 Component independent of time
The constant component of the afterpulses, independent of time, is most naturally associated with triplet excimers whose density is constant and are uniformly distributed throughout the volume of the cell, the rate of destruction being balanced by the production from the 300 Bq source. Destruction occurs in part by the spontaneous radiative decay of triplet excimers to the dissociated ground state and in part by the Penning process.
The most notable features of the data seen in Fig. 19 are the apparent weak field dependence of this afterpulse component at 1 K and the substantial decrease in intensity as the temperature is lower from 1 K to 0.4 K. These two properties are naturally explained by the scintillation being principally due to the spontaneous radiative decay of the excimers, the state having a lifetime of 13 s in the bulk MCK99 . While the electric field is not expected to affect this process, it does lead to a decreased recombination and density of triplets with increasing field. Below about 0.6 K the mean free path of the excimers becomes long, comparable to the dimensions of the helium cell, so that nonradiative destruction of the excimers on solid surfaces decreases the photon yield at low temperatures.
One observation remains unexplained. Hereford and coworkers ROB73 ; ROB71 noted that the total scintillation below 0.5 K depended on the geometry of their cell, the smaller cell having somewhat greater light output. The scintillation intensity decreased with decreasing temperature to a minimum at 0.4 K and then increased on going from 0.4 K to 0.2 K. We have observed similar behavior of the time-independent component of the afterpulse signal at low temperatures (see Figs. 11 and 20).
IV.4 Prediction of the prompt yield for LHe scintillation produced by the products of neutron capture on 3He
IV.4.1 Differences between scintillation induced by particles and scintillation induced by the products of the 3He(,)3H reaction
As discussed in the introduction, in the nEDM experiment, LHe scintillation produced by the products of the neutron capture reaction on 3He will be used as the neutron spin analyzer. In this reaction, the value of 760 keV is shared between the two reaction products, a proton and a triton; the proton and the triton are emitted with kinetic energies of 570 keV and 190 keV respectively. The range of a 570-keV proton in superfluid helium is 0.06 mm, corresponding to an average energy deposition rate of eV/m NISTSTAR . A 190-keV triton travels 0.018 mm in superfluid helium depositing energy at a rate of eV/m before it comes to rest NISTSTAR . In both cases, the average energy deposition rate and hence the number of ionizations per unit length along the track () are almost exactly half of that for a 5.5-MeV particle ( eV/m).
The radius of the ionization track is expected to be the same for particles and the products of neutron capture reaction on 3He because the track radius is determined by the diffusion of the electrons. Therefore, the ionization density inside the tracks created by the reaction products of the 3He(,)3H reaction is also almost exactly half of that in the track created by a 5.5-MeV particle.
The lower number of ionizations per unit length along the track (and hence the lower ionization density) causes LHe scintillation produced by the products of the 3He(,)3H reaction to differ from -induced LHe scintillation in two aspects: 1) the lower ionization density results in reduced quenching, thereby a larger fraction of the deposited energy being emitted as prompt scintillation compared to -induced scintillation. 2) As noted earlier in Sec. IV.1, in the Kramers theory the fraction of ions that recombine depends on a single parameter . Therefore, the lower number of ionizations per unit length along the track means that the effect of an electric field is larger.
IV.4.2 Model for quenching
The effect of the quenching by the nonradiative destruction of singlet species by the Penning process can be described by the following equation:
| (16) | |||||
where and are the densities of the singlet and triplet species, respectively, is the coefficient for bimolecular decay involving singlet species, is the coefficient for bimolecular decay of the triplet species, is the diffusion coefficient of the singlet species, and is the radiative lifetime of the singlet species. , , and are numerical factors that come from the fact that in the Penning process for every two excimers (or excited atoms) destroyed, a new one is formed, one-quarter of the time in the singlet state and three-quarters of the time in the triplet state.
The diffusion term can be neglected for the conditions we are interested in, namely, the first s of the hot track. Also the term describing the Penning ionization of two triplet states can be neglected since is sufficiently larger than (see below).
Noting that changes with time more slowly than , we solve Eq. (16) for two limiting cases: 1) changes with time keeping the ratio constant, that is , where is a time independent constant. 2) does not vary with time, that is , where is the initial triplet density. Solving Eq. (16) yields an analytical solution of the same form for both cases. Integrating the last term of the right hand side of Eq. (16) over time gives the fraction, , of the singlets that contribute to the prompt scintillation escaping the bimolecular annihilation.
| (17) |
where is the initial singlet density and . For the case in which , and are given by and . For the case where , and are given by and .
For -induced LHe scintillation, the fraction of deposited energy that is emitted as prompt scintillation was found to be 10% ADA95 . On the other hand, following a similar discussion to the one in the beginning of Sec. IV.1, we expect 23% of the deposited energy to be emitted as prompt scintillation in the absence of quenching, giving for -induced LHe scintillation. Solving Eq. (17) for gives for -induced scintillation. The numerical value of thus obtained allows us to make a crude estimate of the coefficient for bimolecular decay of the singlet species. For , with cm-3 and s, gives cm3/s for the singlet excimers. This value for is about an order of magnitude larger than the value measured for the coefficient for bimolecular decay of the triplet excimers KET74a ; ELT98 ; KAF00 . The difference could be attributed to the suppression of this process for the triplets states due to the electron spin flip required for the triplet excimer to go to the dissociated ground state. Similar differences have been observed in the deexcitation rates of singlet and triplet states of helium atoms when encountered by other atoms and compounds YOS91 .
Assuming that the quenching fraction is the same for excimers and excited atoms, setting in Eq. (17) yields for LHe scintillation induced by the 3He(,)3H reaction. It follows that the fraction of deposited energy emitted as prompt scintillation is expected to be 13% for LHe scintillation produced by the products of the 3He(,)3H.
Note that this result is somewhat independent of the details of the model. As long as the differential equation for has the form , Eq. (17) holds and we obtain the same value for for LHe scintillation induced by the 3He(,)3H reaction.
IV.4.3 Prediction on the number of prompt EUV photons due to neutron capture on 3He
With the model for quenching discussed above and Kramers’ theory, we can make a prediction on the number of the prompt EUV photons emitted when a neutron is captured by a 3He atom in superfluid LHe. In Fig. 21 the predicted number of the prompt EUV photons for 3He(,)3H is plotted as a function of the electric field.
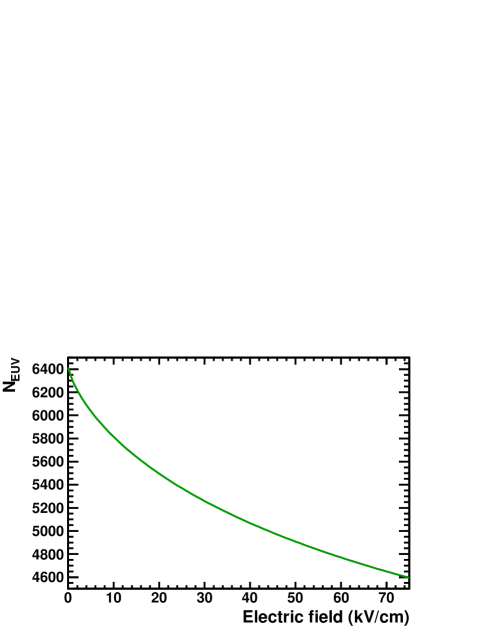
Habicht HAB98 in his thesis reports measurements of the scintillation resulting from a number of different ionization sources including the 3He(,)3H reaction in liquid helium at zero field and 1.8 K. However, it is difficult to make a comparison with his results given the lack of specificity of the experimental parameters such as geometry, solid angle, etc.
V Conclusion
The prompt scintillation signal from particles stopped in helium exhibits a 15% reduction in an electric field of 45 kV/cm. This field dependence is consistent with the current versus field measurements of Gerritsen GER48 and Kramers’ analysis of columnar recombination. We conclude using Kramers’ theory that roughly 40% of the scintillation results from species formed from atoms originally promoted to excited states by the particle and 60% from excimers created by ionization and subsequent recombination, with the electrons initially having a cylindrical Gaussian distribution about the track of 60 nm.
The delayed scintillation signal, the time dependence of which is decomposed in the manner suggested by McKinsey et al. MCK03 , exhibits stronger field and temperature dependences than does the prompt scintillation. The stronger field dependence is the consequence of the fact that the slow component of afterpulses are from triplet excimers undergoing the Penning ionization process followed by recombination forming singlet excimers. As such, it receives the effect of the electric field twice, once at the initial recombination producing triplet excimers, and once at the recombination following the Penning process. The temperature dependence involves the diffusion of the excimers away from the track into the surrounding bulk liquid.
VI Acknowledgments
The authors are grateful for the help and advice provided by the following individuals at various stages of this work: E. Bond, M. Fanning, S. Currie, D. G. Haase, G. Frossati, R. Golub, W. Guo, E. Korobkina, H.-O. Meyer, C. Nelson, J. Self, B. Lozowski, T. Rinckel, P. Childress, D. Baxter, W. M. Snow, and A. Edwards. This work was supported by the US Department of Energy, the National Science Foundation, and the DOE MIE No.71RE.
References
- (1) E. H. Thorndike and W. J. Shlaer, Rev. Sci. Instrum. 30, 838 (1959).
- (2) H. Fleishman, H. Einbinder, and C. S. Wu, Rev. Sci. Instrum. 32, 1173 (1961).
- (3) S. R. Bandler, J. S. Adams, S. M. Brouër, C. Enss, R. E. Lanou, H. J. Maris, T. More, F. S. Porter, and G. M. Seidel, Nucl. Instum. Methods Phys. Res., Sect. A 370, 138 (1996).
- (4) D. N. McKinsey et al., Phys. Rev. A 67, 062716 (2003).
- (5) P. B. Dunscombe, in Liquid Scintillation Counting, Vol. 1, edited by A. Dyer (Heyden and Son Ltd., London, 1971), Chapter 4, pp.37-42.
- (6) D. N. McKinsey, Ph.D. thesis, Harvard University, 2002.
- (7) J. S. Adams, Ph.D. thesis, Brown University, 2001.
- (8) W. Guo, D. Jin, G. M. Seidel, and H. J. Maris, Phys. Rev. B 79, 054515 (2009).
- (9) W. P. Jesse and J. Sadauskis, Phys. Rev. 97, 1668 (1955); N. Ishida, J. Kikuchi and T. Doke, Jpn. J. Appl. Phys. 31, 1465 (1992).
- (10) D. N. McKinsey, et al., Phys. Rev. A 59, 200 (1999).
- (11) A. V. Konovalov and G. V. Shlyapnikov, Soviet Physics JETP 73, 286 (1991).
- (12) G. Archibald, J. Boissevain, R. Golub, C. R. Gould, M. E. Mayden, E. Korobkina, W. S. Wilburn, and J. Zhou, in Proceedings of the 24th International Conference on Low Temperature Physics (LT24), edited by Y. Takano, S. P. Hershfield, S. O. Hill, P. J. Hirschfeld, and A. M. Goldman, AIP Conf. Proc. 850, 143 (2006).
- (13) M. J. Berger, J. S. Coursey, M. A. Zucker, and J. Chang, ESTAR, PSTAR, and ASTAR: Computer Program for Calculating Stopping-Power and Range Tables for Electrons, Protons and Helium Ions, National Institute Of Standards and Technology, Gaithersburg, MD (2005), http://physics.nist.gov/Star [Originally published as: M. J. Berger, NISTIR 4999, National Institute of Standards and Technology, Gaithersburg MD (1993)].
- (14) A. G. Tenner, Nucl. Instrum. Methods 22, 1 (1963).
- (15) F. L. Hereford and F. E. Moss, Phys. Rev. 141, 204 (1966).
-
(16)
The nEDM experiment (M. D. Cooper and B. W. Filippone,
spokespersons),
http:p25ext.lanl.gov/edm/edm.html. - (17) T. M. Ito, J. Phys. Conf. Ser. 69, 012037 (2007).
- (18) R. Golub and S. K. Lamoreaux, Phys. Rep. 237, 1 (1994).
-
(19)
Leiden Cryogenics, B.V.
http://www.leidencryogenics.com - (20) D. N. McKinsey, C. R. Brome, J. S. Butterworth, R. Golub, K. Habicht, P. R. Huffman, S. K. Lamoreaux, C. E. H. Mattoni, and J. M. Doyle, Nucl. Instrum. Methods Phys. Res., Sect. B 132, 351 (1997).
- (21) H.-O. Meyer, Nucl. Intrum. Methods Phys. Res., Sect. A 621, 437 (2010).
- (22) J. S. Adams, S. R. Bandler, S. M. Brouër, R. E. Lou, H. J. Maris, T. N. More, and G. M. Seidel, Phys. Lett. B341, 431 (1995).
- (23) H. A. Roberts and F. L. Hereford, Phys. Rev. A 7, 284 (1973).
- (24) S. Sato, K. Okazaki and S. Ohno, Bull. Chem. Soc. Jpn. 47, 2174 (1974).
- (25) S. Sato, K.Kowari and K. Okazaki, Bull. Chem. Soc. Jpn. 49, 933 (1976).
- (26) J. A. Hornbeck and J. P. Molnar, Phys. Rev. 84, 621 (1951).
- (27) J. Berkowitz, J. Phys. B, 30, 881 (1997).
- (28) G. Jaffe, Ann. Phys. 42, 303 (1913).
- (29) H. A. Kramers, Physica 18, 665 (1952).
- (30) L. Onsager, Phys. Rev. 54, 554 (1938).
- (31) A. N. Gerritsen, Physica 14 407 (1948).
- (32) R. J. Donnelly and C. F. Berenghi, J. Phys. Chem. Ref. Data 27, 1220 (1998).
- (33) A. V. Benderskii, R. Zadoyan, N. Schwentner, and V. A. Apkarian, J. Chem. Phys. 110, 1542 (1999).
- (34) R. C. Muoz, J. B. Cumming and R. A. Holroyd, J. Chem. Phys. 85, 1104 (1986).
- (35) B. Rossi, High Energy Particles, Prentice-Hall, Inc., Englewood Cliffs, NJ, 1952.
- (36) S. R. Bandler, S. M. Brouër, C. Enss, R. E. Lanou, H. J. Maris, T. More, F. S. Porter, and G. M. Seidel, Phys. Rev. Lett. 74, 3169 (1995).
- (37) H. A. Roberts, W. D. Lee and H. L. Hereford, Phys. Rev. A 4, 2380 (1971).
- (38) R. S. Van Dyck, C.E. Johnson and H. A. Shugart, Phys. Rev. A 4, 1327 (1971).
- (39) J. W. Keto, F. J. Soley, M. Stockton and W. A. Fitzsimmonns, Phys. Rev. A 10, 872 (1974).
- (40) J. W. Keto, F. J. Soley, M. Stockton and W. A. Fitzsimmonns, Phys. Rev. A 10, 887 (1974).
- (41) T. A. King and R. Voltz, Proc. R. Soc. A 289, 424 (1966).
- (42) W. Guo, M. Dufault, S. B. Cahn, J. A. Nikkel, Y. Shin, and D. N. McKinsey, JINST 7, P01002 (2012).
- (43) G. W. Rayfield and F. Reif, Phys. Rev. 136, A1194 (1964).
- (44) G. G. Nancolas, T. Ellis, P. V. E McClintock and R. M. Bowley, Nature 316, 797 (1985).
- (45) C. M. Muirhead, W. F. Vinen, and R. J. Donnelly, Phil. Trans. R. Soc. A 311, 433 (1984).
- (46) V. B. El’tsov, S. N. Dzhosyuk, A. Ya. Parshin, and I. A. Todoshchenko, J. Low Temp. Phys. 110, 219 (1998).
- (47) S. G. Kafanov, A. Ya. Parshin, and I.A. Todoshchenko, Zh. Eksp. Teor. Fiz. 118, 1143 (2000) [Sov. Phys. JETP 91, 991 (2000)].
- (48) H. Yoshida, Y. Morishima, M. Ukai, K. Shinkawa, N. Kouchi, and Y. Hatano, Chem. Phys. Lett. 176, 173 (1991).
- (49) K. Habicht, Ph.D. thesis, Technical University of Berlin (1998).