The Angular Coefficients and of Drell-Yan Pairs in the Z Mass Region from Collision at = 1.96 TeV
Abstract
We report on the measurement of angular coefficients and the forward and backward asymmetry () of Drell-Yan dielectron pairs from collisions at = 1.96 TeV. The angular distributions are studied as a function of the transverse momentum of dielectron pair and is measured using the event counting method. The Lam-Tung ( = 0) relation which is only valid for a spin-1 description of the gluon is also tested.
I Introduction
The general expression mirkes2 for angular distribution of the final state electron in the Collins-Soper(CS) frame collins is given by:
| (1) | |||||
Here, and are the polar and azimuthal angles of the electron in the CS frame. The angular coefficients, to , are in general functions of the invariant mass , rapidity , and transverse momentum of the dilepton in the lab frame cdf_coord . When integrated over , the differential cross section reduces to:
| (2) |
When integrated over , the differential cross section reduces to:
| (3) |
Calculations which are based on perturbative QCD (pQCD) make definite predictions for all of the angular coefficients. For , the angular coefficients , and are close to zero mirkes2 , and if we integrate over positive and negative y, the angular coefficients and are small. We can use Eq. 2 to extract and (averaged over ) and Eq. 3 to extract and (averaged over ) under the assumption that and are zero (as is theoretically expected).
The angular distribution of the final state electron in the quark-antiquark () annihilation process (LO) can be written as
| (4) |
Here is the forward-backward asymmetry (which originates from the interference).
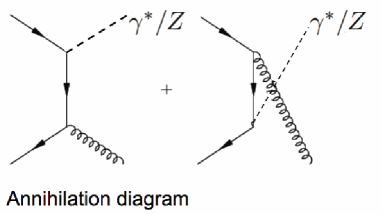
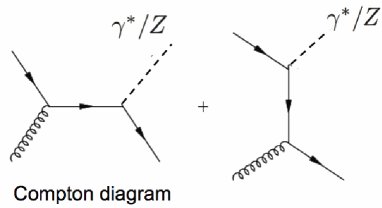
In Quantum Chromodynamics (QCD) at the order of (NLO) this occurs either through the annihilation process with a gluon (g) in the final state (), or via the Compton process with a quark in the final state (), as shown in figure 1. For the annihilation process qq ; bnl ; berger ; bodek , at NLO predicts that the angular coefficients and are equal, independent of Parton Distribution Functions (PDFs), or , and are described by . For the Compton process, and depend on PDFs and . However, at NLO, when averaged over y, and are approximately gq ; dyok described by . The equality is known as the Lam-Tung relation LT . At LO, it is valid for both and processes bnl . Fixed order perturbative QCD calculations mirkes2 at NLO, as well as QCD resummation calculations berger to all orders indicate that violations of the Lam-Tung relation are small. The Lam-Tung relation is only valid for vector (spin 1) gluons. It is badly broken for scalar (spin 0) gluons scalar . Therefore, confirmation of the Lam-Tung relation is a fundamental test of the vector gluon nature of QCD and is equivalent to a measurement of the spin of the gluon. Here, we measure the angular coefficients, , , , and as a function of and the first test of the Lam-Tung relation at large dilepton mass and high transverse momentum. This measurement provides a detailed test of the production mechanism of gauge boson with finite . In addition, we measure () in mass which is sensitive to weak mixing angle, . In the end, we compare the measurement with pythia and various predictions which are QCD resummation calculations and QCD calculations in the fixed order perturbation theories.
II Data Sample and Event Selection
The data sample consists of 2.1 fb-1 collected by CDF II Detector at Fermilab cdfdet during 2004-2007 for the measurement of the angular coefficients. Charged particle directions and momenta are measured by an open-cell drift chamber (COT), a silicon vertex detector (SVX), and an intermediate silicon layer in a 1.4 T magnetic field. Projective-tower-geometry calorimeters and outer muon detectors enclose the magnetic tracking volume. The coverage of COT tracking in pseudorapidity is . The energies and directions of electrons, photons, and jets are measured by two separate calorimeters: central () and plug (). Each calorimeter has an electromagnetic compartment with a shower maximum detector followed by a hadronic compartment.
The events come from the inclusive single high central electron or the dielectron trigger. The electron trigger efficiencies as a function of are measured using the data. The overall trigger efficiencies are measured to be almost . dsdy_public ; dsdy The dielectron data sample consists of three different pair topologies. The CC topology has both electrons in the central calorimeter with . The CP topology has one electron in the central calorimeter with , and another in the plug calorimeter with , a good fiducial region requirement. The PP topology has two electrons in the plug calorimeter with . Events with at least one electron candidate with GeV for CC and PP events, and GeV for CP events, are selected. The second electron candidate is required to have GeV for CC, GeV for PP, and GeV for CP events. The asymmetry cut in CC topology increases the acceptance in high region. For all topologies, the collision vertex along the proton direction (z-axis) is required to be within 60 cm of the center of the detector.
For the CC topology, oppositely charged electron pairs are required. One electron has tight and another has loose central electron ID cuts with COT track requirement idcut . For the CP topology, the central electron passes the tight central electron ID cuts and the plug electron passes the standard plug electron ID cuts with a silicon track requirement idcut . For the PP topology, both electrons pass the standard plug electron ID cuts idcut . In addition, the pseudo-rapidity must have the same sign and both electrons must have a silicon track for the PP topology. The track requirement in both legs of all topologies minimizes the background contamination down to , especially background as well as dijet background. After the selection cuts, we find about 140,000 events for all (CC+CP+PP) topology.
For measurement, we use twice more data, 4.1 fb-1, with the inclusive single high central electron trigger sample only. The event selection is same with the measurement of the angular coefficients except that GeV for both legs of CC topology is required and PP topology is excluded in the measurement. The PP topology has a large charge fake rate, so it is not optimal for the measurement.
III Simulation Sample
The effect of the acceptance on the angular distributions is modeled using the default pythia pythia Monte Carlo (MC) generator combined with a geant geant simulation of the CDF detector cdfdet . The pythia generator used at CDF has additional ad-hoc tuning pythia in order to accurately represent the Z boson transverse momentum distribution measured in data. Further tuning was introduced in order to ensure that the MC correctly describes the rapidity, as well as the correlations between rapidity and transverse momentum that are observed in the data. To reconstruct the simulated events in the same way as data, the calorimetry energy scale and resolution, and event selection efficiencies (electron ID and tracking) are tuned using data.
IV Backgrounds
Due to the two track requirement in the selection, the background level is very small in the sample. The remaning background is measured using data and MC simulations and subtract to get the pure signal. The background from QCD process (mainly, QCD dijet) is measured using data. +jet process is also possible background for Drell-Yan process, but the track requirment on both legs rejects most of +jet background. The QCD background is measured using the isolation extrapolation method and the mass spectrum fitting method from data directly. dsdy The electron is very isolated object, so the isolation energy shape is a good variable to distinguish the electron from the jet object which has a broad and flat isolation energy shape. In the isolation extrapolation method, we fit the isolation distribution for both signal and background contributions and then extrapolate the background from the high isolation tail into the signal region. To measure the background in , the background shape versus is obtained from the background sample (data) and its overall normalization is set using the background rate measured by the isolation extrapolation and mass spectrum fitting method.
The other background source is the background from Electroweak process. The background from Electroweak process is obtained using MC simulations. The Electroweak background processes considered are WW, WZ, inclusive , inclusive W+jets, and Z process. We generate the MC simulations for each process and estimate the background for corresponding integrated luminosity.
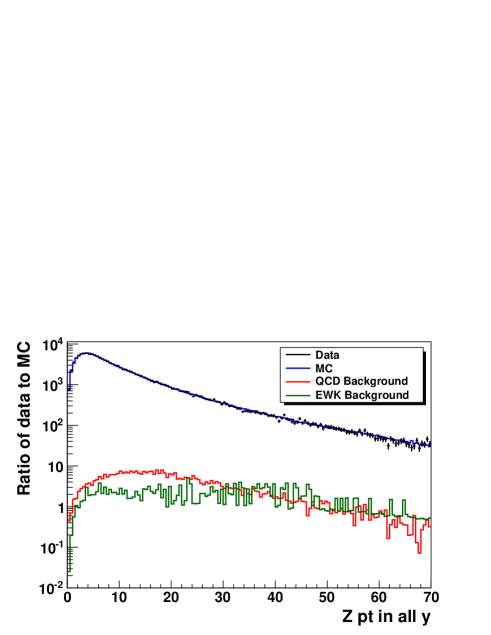
The overall QCD background is and the overall Electroweak background is . The background in for QCD and Electroweak process is shown in Figure 2. All backgrounds are subtracted as a function of the angular distributions, and for the angular coefficients measurement and mass for measurement.
V Extraction of Angular Coefficients in
The Collins-Soper collins CM frame lepton decay angles, and , are defined by:
| (5) |
| (6) |
where is the mass of the dielectron pair, () is the four-momentum of electron (positron), is the transverse momentum of the electron-positron pair, corresponds to , , is a transverse unit vector in the direction of , and is a transverse unit vector in the direction of .
To extract the angular coefficients in , the data and the simulated MC (pythia) are binned in five bins which are (0,10), (10,20), (20,35), (35,55), and (55 and above) using the reconstructed dielectron . For each range, the data and the MC simulated events are binned in and , respectively. The MC events are re-weighted to generate the expected experimental distributions for a range of values of and for , and and for distribution. Eq. 2 and 3 are used to re-weight the event to change the angular distributions in the generated level. A maximum log-likelihood comparison of the data to MC in and is used to extract the best values of the angular coefficients, (,) from and (,) from , that describe the data. To extract the angular coefficients in QED born level (before QED radiation), we reweight the events using the angular coefficients obtained before QED radiation.
V.1 Systematic Uncertainties
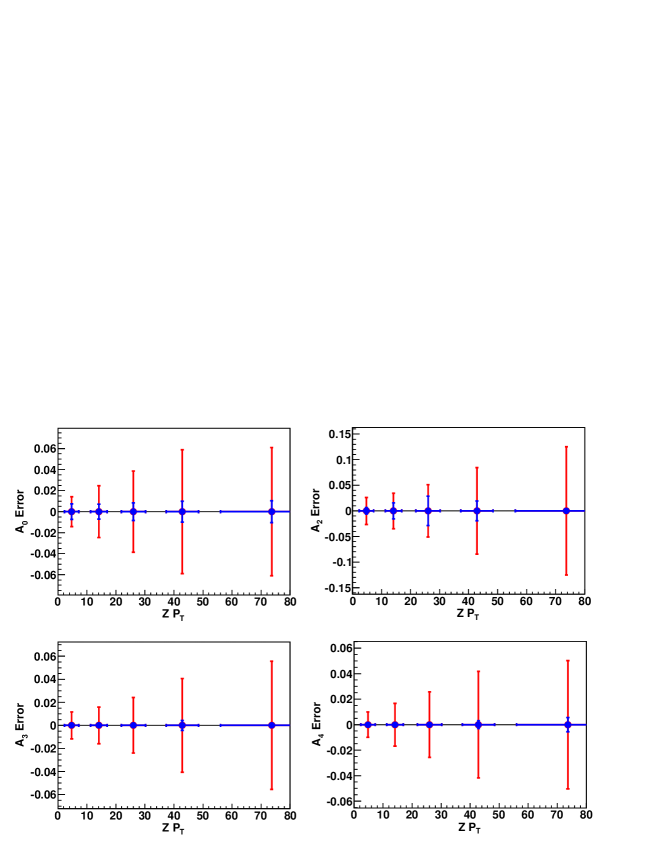
Systematic uncertainties are determined for the background estimation, the energy scale and resolution, the electron identification efficiency, the silicon tracking efficiency, the boson and rapidity modeling, and material modeling. The systematic uncertainties are considered in and distribtuion for bins. An investigation of all of systematic errors listed above shows that the uncertainties on the extracted angular coefficients are dominated by the statistical errors. Figure 3 compares the level of systematic vs. statistical errors for the angular coefficients in . For the total error, the statistical and systematic errors are added in quadrature.
V.2 The Extracted Angular Coefficients in
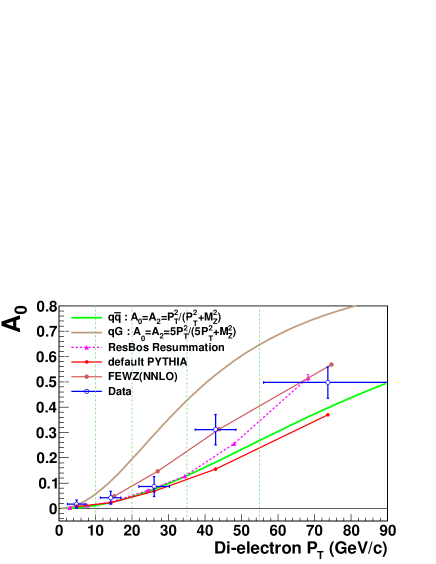
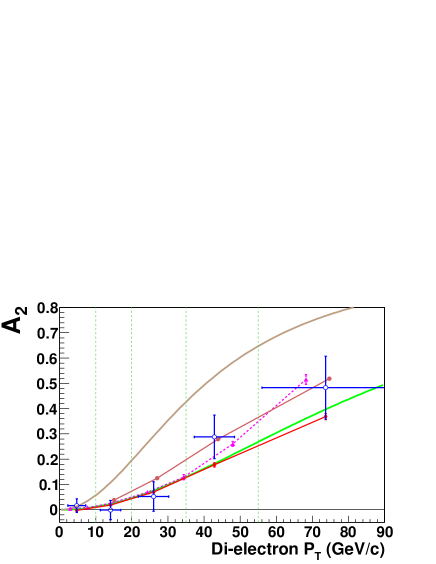
The angular coefficients, , , , and , are extracted from the data in the mass region, GeV/ for bins shown in Figure 4 and 5. The measurement is compared with the various predictions which are pythia pythia , pythia+1jet pythia64 , QCD calculations in the fixed order perturbation theory (dyrad dyrad , madgraph madgraph , powheg powheg , and fewz) FEWZ , and QCD calculations with resummation (resbos resbos and vbp vbp ). The pythia and vbp predictions are close in and follow the approximation of annihilation process, . Other higher order predictions like dyrad, madgraph, powheg, fewz, and pythia+1jet are close and have the higher and values than pythia in high Z region. The resbos prediction follows pythia in low region, but cross over to the high order predictions in GeV.
and have a strong dependence. The measured and follow pythia prediction in low bin (up to ), but prefer the high order predictions (dyrad, madgraph, powheg, fewz, and pythia+1jet ) in . At low , the measured values of and are well discribed by the annihilation function . At high , the larger values show that both the annihilation and Compton process contribute to the cross section. Our results are in agreement with the fixed order perturbation theory calculations including dyrad, madgraph, powheg, fewz, and pythia+1jet. In addition, we confirm the Lam-Tung relation () which is only valid for vector gluon theory. The average of is measured to be , which is consistent with zero within the uncertainty.
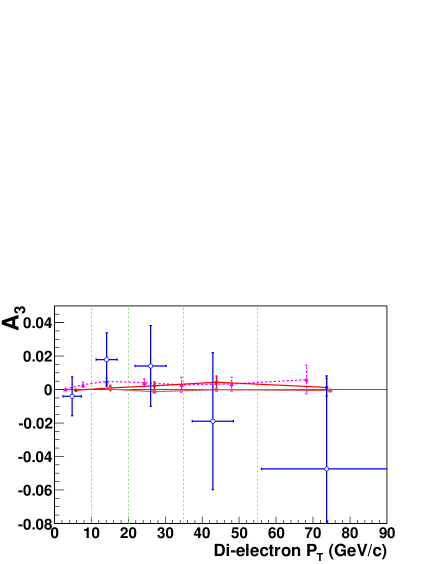
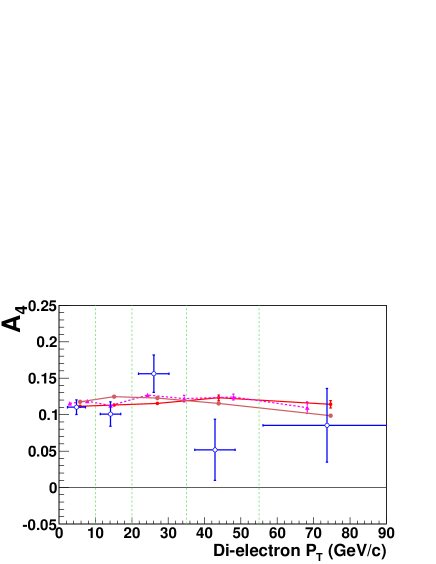
The measured and parameters are relatively flat in Z . The central value of parameter is slightly going down in , but consistent with zero within one deviation of the uncertainty. The parameter determines the forward and backward asymmetry of Drell-Yan process which has a mass dependence. Here, we measure integrating of the mass range, . The dependence of the average value of for the mass range, GeV/, is in agreement with the predictions of all the models. The parameter is sensitive to Weinberg angle, . To compare the measured with the predictions, we generate all predictions setting .
VI Measurement
is measured using the event counting method in mass.
| (7) |
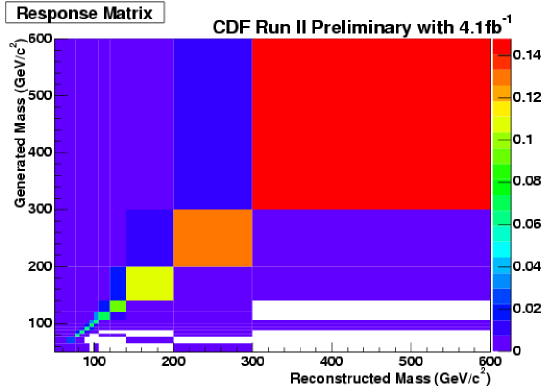
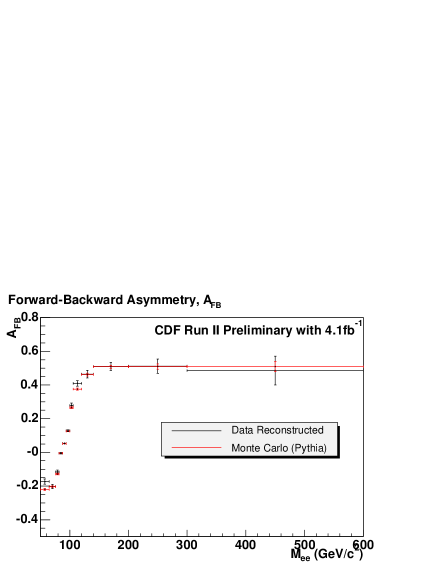
where is the number of the signal events in the mass bin. The measured using 4.1 data is shown in Figure 7 and it is compared with pythia prediction. This measured is unfolded using the response matrix () inversion method to get in the physics level. ( (true value) = (observation) - (background)) The response matrix includes the detector smearing effect, the acceptance and efficiency () effect, and the final state photon radiation (FSR) effect. The response matrix is shown in Figure 6.
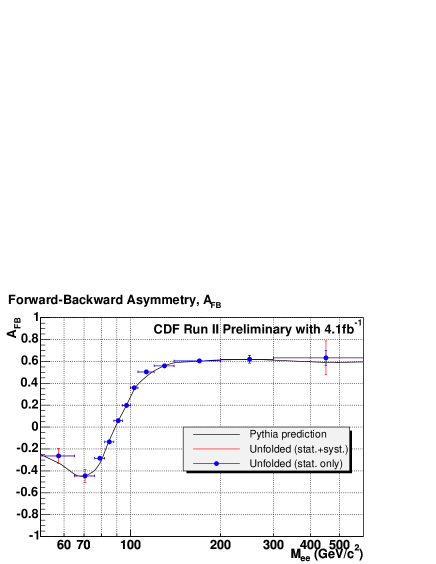
The measured is unfolded using the response matrix inversion and the unfolded is shown in Figure 7. The unfolded is compared to pythia prediction and it has a good agreement with the prediction.
VII Weinberg angle () vs.
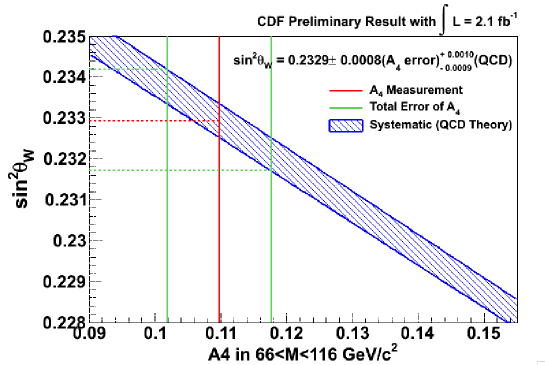
One of the angular coefficients, , is sensitive to the weak mixing angle, . We translate measurement into using the various predictions to extract the weak mixing angle in GeV/. The measured in is integrated over and GeV/. For the predictions, pythia, resbos, vbp, powheg, and fewz are used to extract . Figure 8 shows vs. from various theory predictions. The theory band in Figure 8 includes the order diffdrence of the calculation and also PDF difference (CTEQ vs. MSTW). The variation in the predictions is assigned as the uncertainty of QCD model. The extracted ( error) (QCD).
VIII Conclusion
We present the results of the first measurement of the angular coefficients in the production of bosons at large transverse momenta, and the first test of the Lam-Tung relation at high transverse momentum using 2.1 data. We find a good agreement with the predictions of QCD fixed order perturbation theory, and with the Lam-Tung relation . From measurement, we extract Weinberg angle, , using various theory predictions. We also present measurement in mass using 4.1 data and the measured is compared to pythia prediction. The measured has a good agreement with pythia prediction. We expect that a comparison of these result with the measurement at LHC would provide additional tests of production mechanisms because the contribution of Compton process at LHC is expected to be larger than Tevatron. The angular measurement is published in Ref. angular_pub .
Acknowledgements.
We thank the Fermilab staff and the technical staffs of the participating institutions for their vital contributions. This work was supported by the U.S. Department of Energy and National Science Foundation; the Italian Istituto Nazionale di Fisica Nucleare; the Ministry of Education, Culture, Sports, Science and Technology of Japan; the Natural Sciences and Engineering Research Council of Canada; the National Science Council of the Republic of China; the Swiss National Science Foundation; the A.P. Sloan Foundation; the Bundesministerium für Bildung und Forschung, Germany; the Korean World Class University Program, the National Research Foundation of Korea; the Science and Technology Facilities Council and the Royal Society, UK; the Institut National de Physique Nucleaire et Physique des Particules/CNRS; the Russian Foundation for Basic Research; the Ministerio de Ciencia e Innovación, and Programa Consolider-Ingenio 2010, Spain; the Slovak R&D Agency; the Academy of Finland; and the Australian Research Council (ARC).References
- (1) E. Mirkes , J. Ohnemus, Phys. Rev. D50, 5692(1994); Phys. Rev. D51, 4891(1995).
- (2) John C. Collins and Davison E. Soper, Physical Review D, Volume 16 Number 7, (1977) “Angular distribution of dileptons in h igh-energy hadron collisions”
- (3) CDF coordinates are (,,), where is the polar angle relative to the proton beam (the axis), and the azimuth. The pseudorapidity is . For an pair , , and , where and are the magnitude and z component of the momentum, and E is the energy of the pair.
- (4) J. C. Collins, Phys. Rev. Lett. 42, 291(1979)
- (5) D. Boer and W. Vogelsang, Phys.Rev. D74:014004,2006;
- (6) Edmond L. Berger , Jian-Wei Qiu, Ricardo A. Rodriguez-Pedraza, Phys.Lett. B656, 74(2007).
- (7) A. Bodek, Eur.Phys.J. C67, 321(2010).
- (8) J. Lindfors, Physica Scripta 20, 19(1979).
- (9) L. Y. Zhu et al. Phys. Rev. Lett. 99, 082301(2007).
- (10) C. S. Lam and W. K. Tung, Phys. Lett. B 80, 228 (1979).
- (11) N. Arteaga-Romero, N. Niclaidis and J. Silva, Phys. Rev. Lett. 52, 172 (1984).
- (12) D. Acosta et al. (CDF Collaboration), Phys. Rev. D71, 032001 (2005).
- (13) CDF/PUB/ELECTROWEAK/PUBLIC/9177, http://www-cdf.fnal.gov/physics/ewk/barfcdf9177publicnote.ps
- (14) T. Aaltonen et al. (CDF Collaboration) hep-ex:0908.3914 [hep-ex]; Jiyeon Han, PhD Thesis, University of Rochester, FERMILAB-THESIS-2008-65.
- (15) http://www-cdf.fnal.gov/physics/ewk/2006/dszdy/
- (16) PYTHIA: T. Sjstrand et al., JHEP05(2006)026. We use the default (MSEL=11) LO matrix element ( jet) with CTEQ5L PDFs. The parton showering produces the boson . The CDF EWK/TOP standard tuning parameters are: MSTP(91)=1, PARP(91)=2.10, PARP(93)=15 for the low Gaussian smearing, with PART(62)=1.25 and PARP(62)=0.2 for the evolution in 7-25 region. The underlying event is included as . The QED parton showering uses the same machinery as QCD parton showering aside from coupling differences).
- (17) GEANT: CERN Program Library Long Writeup W5013.
- (18) T. Sjöstrand et al., JHEP 05, 026 (2006). We use PYTHIA 6.4 jet matrix element event generator () without any parton showering ( and ) and CTEQ6M PDFs.
- (19) W.T. Giele, E.W.N. Glover, D. A. Kosower, Nucl. Phys. B403, 633(1993).
- (20) F. Maltoni and T. Stelzer, JHEP 0302:027(2003); We use CTEQ6.6 PDFs for madgraph.
- (21) We have used the most recent version of POWHEG. See Simone Alioli , Paolo Nason, Carlo Oleari, Emanuele Re, arXiv:1009.5594v1 (2010).
- (22) K. Melnikov and F. Petriello, Phys. Rev. Lett. 96 231803 (2006); ibid Phys. Rev. D74 114017(2006)
-
(23)
F. Landry, R. Brock, P.M. Nadolsky, and C.-P. Yuan, Phys. Rev. D67 073016 (2003).
We use CTEQ6.6 PDFs for resboswith
Code: cpy_113009 (;
Grid files: dy__tev2_ct66 w321.00 and yk.00. - (24) R. K. Ellis and S. Veseli, Nucl. Phys. B511, 649 (1998); We use CTEQ6.6 PDFs with vbp.
- (25) T. Aaltonen et al. (CDF Collaboration), Phys. Rev. Lett. 106 241801 (2011).