W and Z Boson Cross Section and W Asymmetry at CMS
Abstract
We report the measurement of the rates and asymmetries of inclusive and differential production of W and Z vector bosons in pp collisions at TeV. The data consists of 36 collected in the Compact Muon Solenoid (CMS) detector at the Large Hadron Collider (LHC). The measured inclusive cross sections are (stat.) (syst.)(th.)(lumi.) nb and (stat.) (syst.)(th.)(lumi.) nb. The measured inclusive cross sections and also its ratio of W to Z or to agree with NNLO QCD cross section calculations and current parton distribution functions (PDFs). The differential production asymmetry of W boson as a function of the lepton pseudorapidity in the final state is also measured and compared with various PDFs.
I Introduction
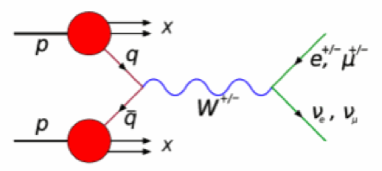
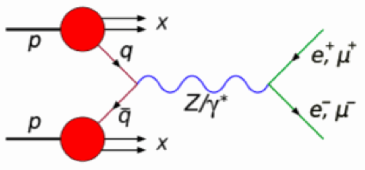
The inclusive cross section of any physics process is determined by Born-cross section () and the parton distribution functions (PDFs). Therefore, the measurement of the inclusive cross section tests calculations based on the higher order perturbative Quantum Chromodynamics (QCD) and also PDFs. Especially, W and Z boson processes shown in Figure 1 are well understood and unique signature with high rate, which give a useful information of QCD and PDFs. Moreover, these processes are a good tool to calibrate the detector in the early stage and the total cross section of these processes can be used as the luminosity candles at LHC. W or Z process mediates for many complex final states like top or new physics, so the measurement of W and Z production process paves the way for understanding top or new physics processes.
In the W production mechanism, it is polarized due to the parity violation at production and it gives a strong asymmetry in the lepton decay. This asymmetry measurement constrains for the ratio of u and d quark, particulary on the sea quark contribution at LHC. Therefore, the asymmetry measurement of W boson production is important input of the global PDFs fit.
Here, we measure the inclusive cross section and its ratio of W and Z production decaying to electrons or muons with the data sample taken from 2010 LHC operation period (36 ).
II The CMS Detector
A detailed description of the CMS detector can be found in Ref. cmsdet . The CMS detector is a superconducting solenoid, of 13 m in length and 6 m in diameter, which provides an axial magnetic field of 3.8 T. The innermost layer is a silicon tracker which covers the pseudorapidity, ( where is the polar angle of the trajectory of the particle with respect to the beam direction. Outside of the silicon tracker, the scintillating crystal electromagnetic calorimeter (ECAL) and the brass/scintillator hadron calorimeter (HCAL) follow. The ECAL provide coverage of in the barrel region and in the endcap region. The muon system is made of three technologies, drift tubes, cathode stript chambers, and resistive plate chambers. The muon detector covers region and has about 2 transverse momentum resolution in the relevant muon range with the silicon track matching.
III Data Set and Event Selection
The data sample consists of 36 collected by CMS detector at LHC during 2010. The analysis is performed for the electron and muon channel for W/Z production. The events from the high electron or the single high muon trigger is used to select the sample. In the muon channel, the muon is selected to have GeV for W boson and GeV for Z boson in . The good track quality selection is required to find a good muon and the impact parameter cut, mm, is also required to reduce the cosmic muon background. The electron is required to have GeV for W and Z boson in a good detector fiducial region, and . The high electron cluster is matched to a high track and also required to pass the electron identification (ID) variables like a shower shape and the conversion reject variables. Both electron and muon are required to be the isolated object. Since the W production has large Drell-Yan background contamination, the Drell-Yan background is reduced by rejecting the event with the second isolated lepton with loose selection.
IV Acceptance and Efficiency
IV.1 Acceptance
The acceptance is calculated using powheg Monte Carlo (MC) powheg1 ; powheg2 ; powheg3 generator interfaced with pythia parton showering. The powheg generator is combined with a geant geant simulation of the CMS detector. The acceptance is the event fraction of the event with kinematic selection ( GeV for W selection, and GeV for Z selection in the detector fiducial region) to the generated events. The acceptance for the Z boson measurement is restricted by the Z mass range, GeV. The total acceptance is 50 for W boson and 40 level for Z boson. Table 1 summarizes the acceptance for each channel.
| Process | () | () |
|---|---|---|
IV.2 Efficiency
The efficiency is determined for the offline reconstruction of the lepton, the lepton selection with the lepton identification (ID) and isolation criteria, and the trigger efficiency. The efficiencies are estimated using the tag and probe method using Z sample. The tagged leg has a tight lepton selection to clean up the sample and the probe leg is used to determine the efficiency. The remaining background in the sample is subtracted using Z mass fitting method. The efficiencies are estimated in the data and the simulation sample (MC) and the efficiency scale factor of data to MC is applied into MC to correct the efficiency in MC. Table 2 shows the total efficiency for W and Z process in the electron and muon channel.
| Lepton channel | W process | Z process |
|---|---|---|
| Electron | ||
| Muon |
V Background Estimation
V.1 Background and Signal Extraction for W Production
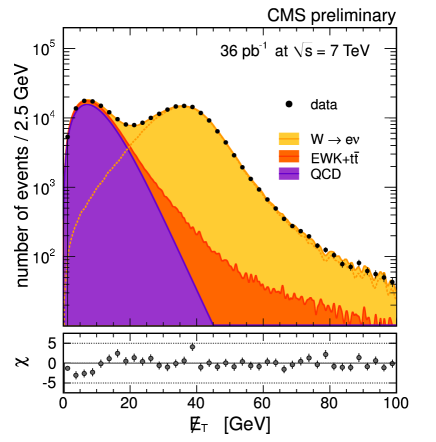
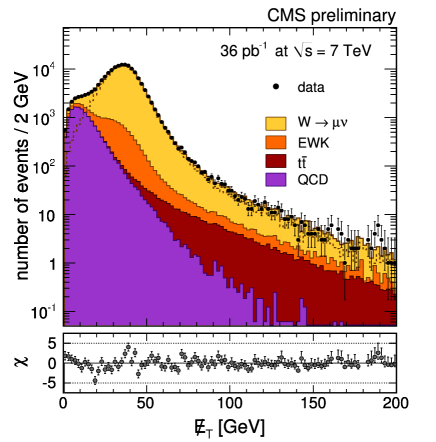
The main background source in W production is QCD multi-jet and Drell-Yan process. QCD background is estimated from the data directly using spectrum fit method. The background shape of is obtained from QCD enriched sample and the signal shape is obtained using MC and data for the hadron recoil tuning. The background estimation from fit is also confirmed by two independent methods, shape fit and Isolation energy vs. method (ABCD method). The QCD background rates estimated from these different methods are consistent each other within the statistical uncertainty. The background from the electroweak process is determined using the simulation. Drell-Yan, , Diboson (WW/WZ/ZZ), and processes are considered for the electroweak background. All backgrounds are estimated for , , and , respectively. Figure 2 shows the signal and background distribution in for and and Table 3 describes the background rate of each physics process for W boson production. After background subtraction, we get of W events in the electron channel (the signal yield of = and = ) and of W events in the muon channel (the signal yield of = and = ).
| Background [] | ||
|---|---|---|
| Drell-Yan | 7.6 | 4.6 |
| 3.0 | 3.0 | |
| Diboson (WW/WZ/ZZ) | 0.1 | 0.1 |
| 0.4 | 0.4 | |
| Cosmic | ||
| QCD | From fit | 5.1 |
V.2 Background and Signal Extraction for Z Production
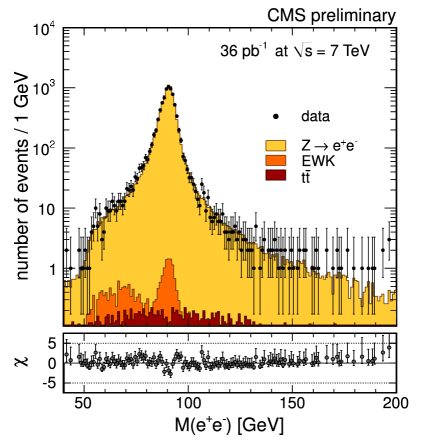
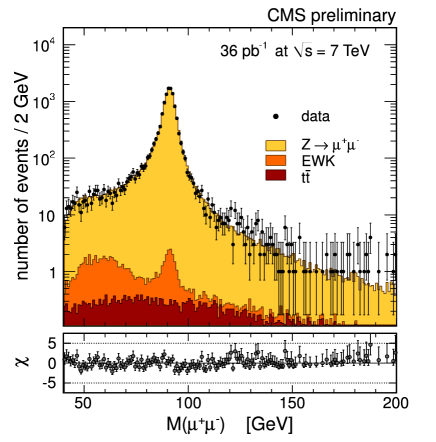
The background source of Z boson production is QCD multi-jet and also the electroweak process like Diboson, W inclusive, , and process. The QCD background is estimated using the isolation fitting method for and the QCD simulation sample is used for because of the low background rate. The QCD background rate for sample estimated by QCD MC is confirmed by the same and opposite charge method in the data and both methods give the consistent background rate. The electroweak background is estimated using the simulation samples for each physics process and the background rates are summarized in Table 4. The total background is 0.4 level for both and . After all background subtraction, we get events for and events for process. Figure 3 shows the dilepton mass distribution with the background contribution.
| Background [] | ||
|---|---|---|
| Diboson (WW/WZ/ZZ) | ||
| W+jets | ||
| QCD | ||
| Total background |
VI Systematic Uncertainty
We consider the systematic uncertainty from the luminosity, efficiencies (reconstruction, ID, and trigger), the energy/momentum scale and resolution, scale and resolution, the background estimation, PDFs uncertainty for the acceptance, and theoritical uncertainties. The largest systematic uncertainty in the measurement is the uncertainty from the integrated luminosity measurement cmslum which is 4 . Table 5 summarizes the systematic uncertainty from each systematic source in the measurement. The total experimental systematic error is comparable with the total theoretical uncertainty.
| Source | ||||
|---|---|---|---|---|
| Lepton reconstruction identification | 1.4 | 0.9 | 1.8 | n/a |
| Trigger prefiring | n/a | 0.5 | n/a | 0.5 |
| Energy/momentum scale resolution | 0.5 | 0.22 | 0.12 | 0.35 |
| scale resolution | 0.3 | 0.2 | n/a | n/a |
| Background subtraction / modeling | 0.35 | 0.4 | 0.14 | 0.28 |
| Trigger changes throughout 2010 | n/a | n/a | n/a | 0.1 |
| Total experimental | 1.6 | 1.1 | 1.8 | 0.7 |
| PDF uncertainty for acceptance | 0.6 | 0.8 | 0.9 | 1.1 |
| Other theoretical uncertainties | 0.7 | 0.8 | 1.4 | 1.6 |
| Total theoretical uncertainties | 0.9 | 1.1 | 1.6 | 1.9 |
| Total (excluding luminosity) | 1.8 | 1.6 | 2.4 | 2.0 |
VII W and Z Boson Cross Section Result
The inclusive cross section of W and Z boson is calculated by:
| (1) |
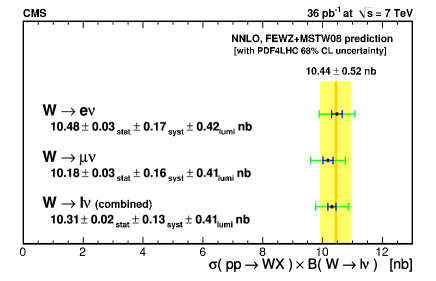
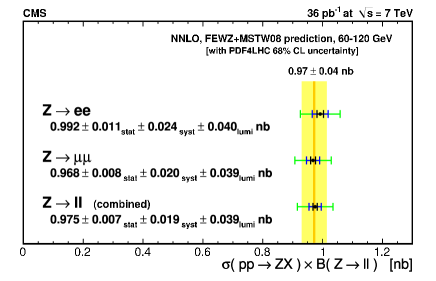
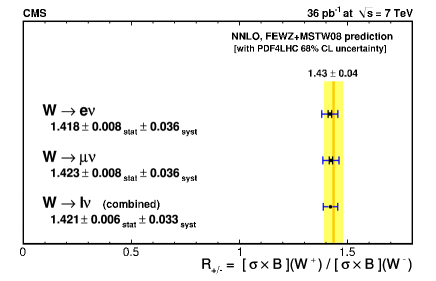
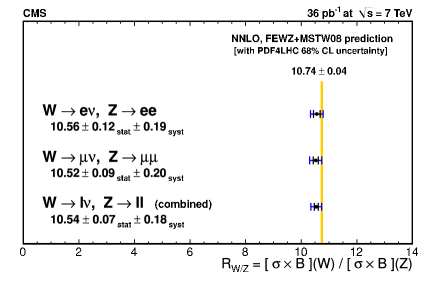
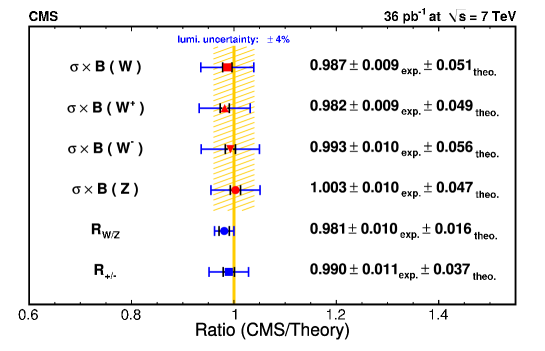
where is the selected number of events, is the number of the background events, is the acceptance times the efficiencies, and is the integrated luminosity. The inclusive cross section is measured for the electron and muon channel, respectively, and then these cross sections are combined at the end. For the ratio of the cross section, we consider the ratio of to cross section and also the ratio of W to Z cross section. The luminosity uncertainty cancels in the ratio of the cross sections. Table 6 summarizes the inclusive cross section of each channel for W and Z boson and also the ratio of to and W to Z cross section. The measurements are compared to NNLO theory calculation, fewz fewz1 ; fewz2 with mstw08 PDFs, which is shown in Figure 4. The inclusive cross sections and its ratios agree with the prediction within 1 of total error. Figure 5 shows the ratio of the measurement to the theory prediction (NNLO fewz).
| Process | Cross Section |
|---|---|
| nb | |
| nb | |
| nb | |
| nb | |
| nb | |
| nb |
| Process | Cross Section Ratio |
|---|---|
VIII Lepton Charge Asymmetry of W Production
In W production, it is hard to measure the asymmetry of W production directly because the momentum of in the longitudinal direction is unknown. Therefore, the asymmetry is measured using the final state lepton, which is the lepton charge asymmetry. The lepton charge asymmetry of W production () is defined as:
| (2) |
where is the pseudorapidity of the lepton in the final state. The lepton charge asymmetry has a strong dependence, so it is important to understand dependence of efficiencies and background. In the measurement, the efficiencies (reconstruction, ID, and trigger) are estimated as a function of muon and . The background is also estimated in using the shape fitting method ( fit for the electron channel and the isolation energy fitting for the muon channel) from the data directly. For the electroweak background, we use the simulation samples. All other methods of the measurement are same as used for the inclusive cross section measurement.
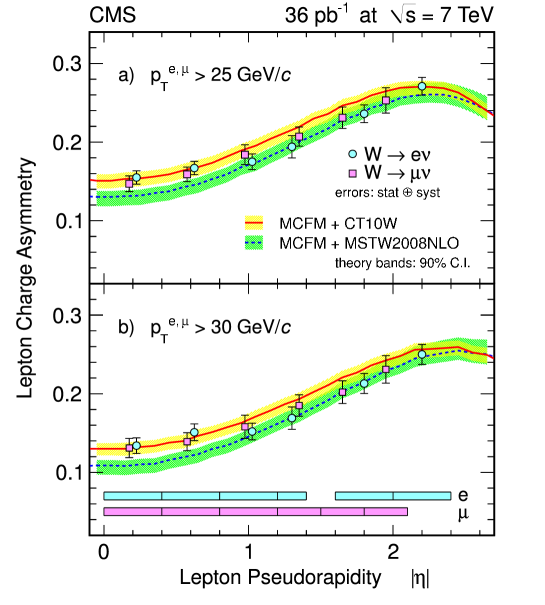
The lepton charge asymmetry has dependence, so it is measured in two muon bins, and GeV. The asymmetry is measured in the electron and muon channel, respectively, and shows a good agreement between these two channels. Figure 6 shows the lepton charge asymmetry in and compared to the theory predictions, mcfm mcfm with CTEQ10W cteq and NLO MSTW2008 mstw PDFs. The precision of the measurement is less than 1.1 for the statistical uncertainty and 1.5 for the total uncertainty in all bins. This measurement is new input to PDF global fit which constrains to the u and d quark ratio.
IX Conclusion
We measure the inclusive cross section of W and Z boson production and its ratio using 36 data at CMS. The inclusive cross section measurements show a good agreement with NNLO QCD theory prediction. The lepton charge asymmetry of W production is also measured and compared with various PDFs set, CTEQ10W and NLO MSTW2008. More analysis detail is in Ref. cmspas1 for the inclusive cross section measurement and Ref. cmspas2 for the lepton charge asymmetry measurement.
Acknowledgements.
We thank the technical and administrative staff at CERN and other CMS institutes, and acknowledge support from: FMSR (Austria); FNRS and FWO (Belgium); CNPq, CAPES, FAPERJ, and FAPESP (Brazil); MES (Bulgaria); CERN; CAS, MoST, and NSFC (China); COLCIENCIAS (Colombia); MSES (Croatia); RPF (Cyprus); Academy of Sciences and NICPB (Estonia); Academy of Finland, ME, and HIP (Finland); CEA and CNRS/IN2P3 (France); BMBF, DFG, and HGF (Germany); GSRT (Greece); OTKA and NKTH (Hungary); DAE and DST (India); IPM (Iran); SFI (Ireland); INFN (Italy); NRF and WCU (Korea); LAS (Lithuania); CINVESTAV, CONACYT, SEP, and UASLP-FAI (Mexico); PAEC (Pakistan); SCSR (Poland); FCT (Portugal); JINR (Armenia, Belarus, Georgia, Ukraine, Uzbekistan); MST and MAE (Russia); MSTD (Serbia); MICINN and CPAN (Spain); Swiss Funding Agencies (Switzerland); NSC (Taipei); UBITAK and TAEK (Turkey); STFC (United Kingdom); DOE and NSF (USA).References
- (1) CMS Collaboration, “The CMS experiment at the CERN LHC”, 0803:S08004 (2008).
- (2) S. Alioli, P. Nason, C. Oleari et al., “NLO vector-boson production matched with shower in POWHEG”, 07 (2008) 060, arXiv:0805.4802. doi:10.1088/1126-6708/2008/07/060.
- (3) P. Nason, “A new method for combining NLO QCD with shower Monte Carlo algorithms”, 11 (2004) 040, arXiv:hep-ph/0409146. doi:10.1088/1126-6708/2004/11/040.
- (4) S. Frixione, P. Nason, and C. Oleari, “Matching NLO QCD computations with Parton Shower simulations: the POWHEG method”, 11 (2007) 070, arXiv:0709.2092. doi:10.1088/1126-6708/2007/11/070.
- (5) GEANT: CERN Program Library Long Writeup W5013.
- (6) CMS Collaboration, “Measurement of CMS luminosity”, CMS PAS EWK-2010-004 (2010).
- (7) K. Melnikov and F. Petriello, “Electroweak gauge boson production at hadron colliders through O(alpha(s)**2)”, D74 (2006) 114017, arXiv:hep-ph/0609070. doi:10.1103/PhysRevD.74.114017.
- (8) K. Melnikov and F. Petriello, “The W boson production cross section at the LHC through O()”, 96 (2006) 231803, arXiv:hep-ph/0603182. doi:10.1103/PhysRevLett.96.231803.
- (9) J. M. Campbell and R. K. Ellis, “Radiative corrections to Z b anti-b production”, D62 (2000) 114012, arXiv:hep-ph/0006304. doi:10.1103/PhysRevD.62.114012.
- (10) H.-L. Lai et al., “New parton distributions for collider physics”, D82 (2010) 074024, arXiv:1007.2241. doi:10.1103/PhysRevD.82.074024.
- (11) A. D. Martin, W. J. Stirling, R. S. Thorne et al., “Parton distributions for the LHC”, C63 (2009) 189-285, arXiv:0901.0002. doi:10.1140/epjc/s10052-009-1072-5.
- (12) CMS Collaboration, “Measurement of Inclusive W and Z Cross Sections in pp Collisions at = 7 TeV”, CMS PAS EWK-2010-005 (2010), arXiv:1107.4789.
- (13) CMS Collaboration, “Measurement of the lepton charge asymmetry in inclusive W production in pp Collisions at = 7 TeV”, CMS PAS EWK-2010-006 (2010), 1104 (2011) 050, arXiv:1103.3470, doi:10.1007/JHEP04(2011)050.