Status of the Upsilon Polarization Measurement at CDF
Abstract
The angular distributions of decays are analyzed using a sample of mesons in of data collected at . The results of the one-dimensional angular analysis suggest that may be longitudinal polarized at high transverse momentum. This observation is largely inconsistent with NRQCD prediction that predicts transverse polarization at high .
I Introduction
The discrepancies between experimental results and theoretical predictions in the field of heavy quarkonium production continue to intrigue our community. The production cross section and polarization of heavy quarkonia are important observables that are predicted by the models used to describe heavy vector meson production. It is essential to measure these observables in order to test the theoretical models.
The Color Singlet Model (CSM) based on QCD was the first model that was used to describe the production mechanism of heavy quarkonia bib-csm1 ; bib-csm2 . The CDF Run-I measurements of prompt and (2S) production cross section showed a significant excess compared to the predictions of the CSM bib-jpsi . This lead to the development of the Color Octet Model (COM) based on NRQCD, which includes Feynman diagrams for color octet states in addition to the color singlet states, prior to formation of a quarkonium state. Although the measurement of production cross section bib-com1 seemed to agree well with the predictions of the octet model, it is important to note that the parameters in COM were tuned to match the normalization in data. Hence, in order to validate the COM it was important to measure the polarization of heavy vector mesons, which is independent of the cross section measurement. The COM predicts that heavy vector mesons should be transverse polarized at high momentum bib-com2 . However, CDF Run-I bib-jpsi-run1 and Run-II bib-jpsi-run2 measurements of polarization showed a trend towards longitudinal polarization at high momentum in contrast to the predictions of the COM. This observation lead to the question that perhaps the charm quark is too light in order to make reliable predictions using NRQCD. Thus it is essential to measure polarization of the bottomonium states that are bound states of the heavier bottom quark and compare the result with NRQCD predictions.
In these proceedings, we present the results of the measurement of (1S) polarization using decays in of CDF data. The analysis technique is essentially similar to the technique used in the CDF Run-I measurement bib-upsilon-run1 .
II Measurement of Spin Alignment or Polarization
Although the nomenclature used for the measured parameter is polarization, we essentially measure the spin alignment of the vector mesons with respect to a reference axis. Conventionally, the S-channel helicity frame is used for the polarization measurement at hadron colliders, in which the reference axis is defined by the momentum in the lab frame. The angular distribution of the decay products is given by:
| (1) |
where is the angle between the momentum of in the rest frame and the boost direction. The parameter is defined as, where and are the production cross sections for purely transverse and purely longitudinal polarized vector mesons respectively. The mesons are said to be transverse polarized if , longitudinal polarized if and unpolarized if is measured to be zero.
III Data Sample
The data sample used for the measurement corresponds to an integrated luminosity of of collisions at a center of mass energy of . The candidates are selected using the dimuon trigger that requires a pair of oppositely charged muons with transverse momentum of . The trigger algorithm basically requires loose matching between charged particle tracks in the Central Outer Tracker (drift chamber) and muon hit segments in the central muon detectors that have pseudorapidity coverage of bib-cdf . In addition to the trigger criteria, one of the muon is required to have transverse momentum of at least in the offline selection process. Additional track quality, trigger acceptance, dimuon vertex probability and decay length () cuts are imposed offline in the analysis. Furthermore, the candidates are required to have transverse momentum in the range and rapidity in the region .
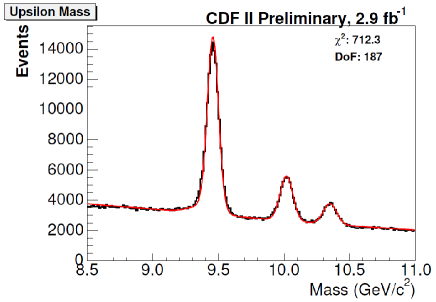
The invariant mass distribution of the selected dimuon candidates is shown in Figure 1. Although the figure includes the (1S) along with the higher (nS) states, we focus here on measuring polarization of the (1S) state. The signal region is defined within from the mean of the (1S) mass peak.
IV Measurement of Polarization Parameter
The polarization parameter can be determined experimentally by measuring the distribution of cos in data. The sample is divided in eight bins of transverse momentum and the distribution of is measured within each bin. Since the angular distribution has a quadratic dependence on cos as shown in Equation 1, the distribution is symmetric about zero and consequently, the measurement can be performed as a function of cos. Within each bin, the angular distribution is obtained by measuring the yield in tens bins of cos.
The signal component in the cos distribution is described by the weighted sum of two templates, one for purely transverse () and one corresponding to purely longitudinal () polarized vector mesons. The templates obtained from Monte Carlo simulations are corrected for detector acceptance and trigger efficiency effects. The angular distribution of the background component is obtained from the mass sideband regions. A fit is performed in which the signal component is described using the function:
| (2) |
where is related to the polarization parameter :
| (3) |
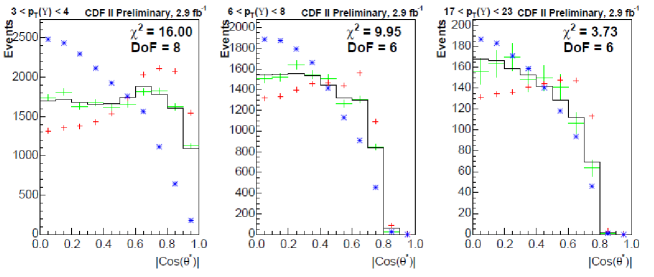
The shapes of the two Monte Carlo templates are fixed in the fit. The parameters describing the shape of the background component are set free in the fit but are constrained by simultaneously fitting the invariant mass sideband regions. Using this fitting procedure, we obtain the value of by measuring within each bin. Figure 2 shows the result of the fit for three of the eight bins defined in the analysis.
We investigate several potential sources of systematic effects such as the trigger efficiency parameterization used in Monte Carlo, the re-weighting technique use on Monte Carlo samples, the invariant mass parameterization, the width of the signal range, minimum requirement, cos bin width, and number of cos bins. The uncertainty on the trigger efficiency function measured on data introduces a very small systematic uncertainty of on the polarization parameter. Systematic uncertainties due to the remaining sources are found to be negligible. The total uncertainty on the measurement of is thought to be dominated by statistical errors.
V Results
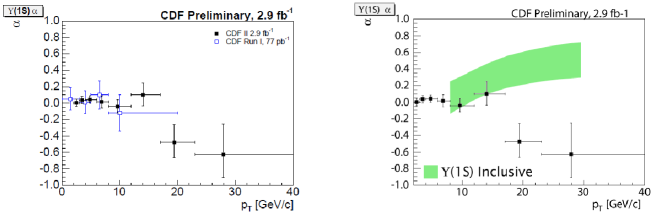
The distribution of measured polarization parameter as a function of for the (1S) state is shown in Figure 3. We measure almost zero polarization at low momentum, which is consistent with the previous Run-I measurement. The measurement shows a trend towards longitudinal polarization at high momentum that disfavors the NRQCD prediction bib-com2 of transverse polarization at high .
VI Analyzing the Complete Angular Distribution
In the future, we plan to perform the analysis of the complete three-dimensional angular distribution for a heavy vector meson decaying to fermions that can be written as:
| (4) |
In the polarization analyses conducted so far, only the (equivalent to ) parameter has been measured in the S-channel helicity frame. Recently it has been emphasized bib-3d that in order to fully understand polarization, all the three coefficient in the angular distribution, , and should be measured simultaneously. Furthermore, it is suggested that the Collins-Soper frame is a more natural choice for comparison with theoretical predictions. As a consistency check, we intend to measure a frame-invariant quantity derived from the parameterization of the angular distribution measured in each reference frame used in the analysis.
VII Summary
We presented the latest measurement of (1S) polarization using of data. The analysis was conducted using the conventional technique that involves measuring only one of the three parameters in the angular distribution of (1S) decays, namely or . The results of the measurement suggested that the (1S) are longitudinal polarized at high , which is inconsistent with NRQCD prediction. In the future polarization measurements at CDF, we plan to conduct a more comprehensive study of the full three-dimensional angular distribution. The new technique involves measuring all the three coefficients in the angular distribution of all three (nS) states.
Acknowledgements.
We are grateful to the Fermilab staff and the technical staffs of the participating institutions for their vital contributions. The work presented in these proceedings was supported by the U.S. Department of Energy and National Science Foundation; the Italian Istituto Nazionale di Fisica Nucleare; the Ministry of Education, Culture, Sports, Science and Technology of Japan; the Natural Sciences and Engineering Research Council of Canada; the National Science Council of the Republic of China; the Swiss National Science Foundation; the A.P. Sloan Foundation; the Bundesministerium fr Bildung und Forschung, Germany; the Korean World Class University Program, the National Research Foundation of Korea; the Science and Technology Facilities Council and the Royal Society, UK; the Institut National de Physique Nucleaire et Physique des Particules/CNRS; the Russian Foundation for Basic Research; the Ministerio de Ciencia e Innovación, and Programa Consolider-Ingenio 2010, Spain; the Slovak RD Agency; the Academy of Finland; and the Australian Research Council(ARC).References
- (1) C. H. Chang, Nucl. Phys. B 172, 425 (1980).
- (2) R. Baier and R. Rckl, Phys. Lett. B 102, 364 (1981).
- (3) F. Abe et al [CDF Collaboration], Phys. Rev. Lett. 79, 572 (1997),
- (4) M. Krmer, Prog. Part. Nucl. Phys. 47, 141 (2001).
- (5) E. Braaten and J. Lee, Phys. Rev D 63, 071501 (2000).
- (6) A. Affolder et al [CDF Collaboration], Phys. Rev. Lett. 85, 2886 (2000).
- (7) A. Abulencia et al [CDFCollaboration], Phys. Rev. Lett. 99, 132001 (2007).
- (8) D. Acosta et al [CDF Collaboration] Phys. Rev. Lett. 88, 161802 (2002).
- (9) CDF collaboration, The CDF II Detector, FERMILAB-Pub-96/390-E.
- (10) P. Faccioli, C. Lourenco and J. Seixas, Phys. Rev. D 81, 111502(R) (2010).