An Occultation Event in Centaurus A and the Clumpy Torus Model
Abstract
We have analyzed 16 months of sustained monitoring observations of Cen A from the Rossi X-ray Timing Explorer to search for changes in the absorbing column in the line of sight to the central nucleus. We present time-resolved spectroscopy which indicates that a discrete clump of material transited the line of sight to the central illuminating source over the course of 170 days between 2010 August and 2011 February with a maximum increase in the column density of about 8.4 cm-2. This is the best quality data of such an event that has ever been analyzed with the shape of the ingress and egress clearly seen. Modeling the clump of material as roughly spherical with a linearly decreasing density profile and assuming a distance from the central nucleus commensurate with the dusty torus we found that the clump would have a diameter of 1.4–2.4 cm with a central number density of nH = 1.8–3.0 cm-3. This is consistent with previous results for a similar (though possibly much longer) occultation event inferred in this source in 2003–2004 and supports models of the molecular torus as a clumpy medium.
Subject headings:
galaxies: active – X-rays: galaxies –1. Introduction
Centaurus A (Cen A hereafter) is one of the closest and consequently one of the brightest active galactic nuclei (AGN) in our sky. High resolution data from infrared and X-ray observatories (such as Spitzer and Chandra) have revealed many details about the structure of its prominent jets as well as the core of the nucleus. Cen A has proved to be an excellent laboratory for studying the properties of blazar jets, however it also displays certain X-ray properties characteristic of a Seyfert galaxy, likely due to its orientation. For example, X-ray spectroscopy shows a prominent Fe line at 6.4 keV originating in cool material far from the central nucleus (Evans et al. 2004) and strong absorption in the line of sight. Broad optical emission lines have never been detected in this source, marking it as a Seyfert 2. A search for hidden broad lines through polarized scattered light by Alexander et al. (1999) ruled out the existence of a hidden broad line region (BLR).
Between the launch of the Rossi X-ray Timing Explorer (RXTE) in 1996 and 2009 February, Cen A was observed 13 times, each an extended exposure of 10–100 ks. Rivers et al. (2011) performed spectral analysis on these data in the 3–100 keV band to measure longterm average spectral properties of Cen A, such as the photon index ( = 1.83) and the equivalent H column density ( = 16.9 cm-2), and also confirming the lack of a Compton reflection hump in this source. Rothschild et al. (2011) analyzed the individual Cen A observations, examining both spectral and temporal characteristics of this source. From these analyses it was discovered that for three observations between 2003 March and 2004 February, the column density of cold material along the line of sight to the nucleus increased by 60%, from 16 cm-2 to 26 cm-2. From this it was inferred that a clump of material may have passed through the line of sight at a distance commensurate with the molecular torus. Such an event is consistent with clumpy torus models such as that developed by Nenkova et al. (2008a; 2008b). However there were only three data points in this interval and therefore the physical parameters of the inferred clump such as size, number density, and shape, were loosely constrained at best.
Similar short-term increases and decreases in have been seen previously in a number of AGN, notably NGC 3227 (Lamer et al. 2003), NGC 1365 (Risaliti et al. 2009), NGC 4051 (Guainazzi et al. 1998), and H0557–385 (Longinotti et al. 2009). Most of these did not have the advantage of continuous monitoring over timescales of days to months. The only exception to this is Lamer et al. (2003), who attempted to fit a density profile to explain the smooth increase and decrease in for NGC 3227 over about 300 days as seen with RXTE monitoring. Risaliti et al. (2009) analyzed a 60 ks XMM-Newton observation of NGC 1365, finding very rapid changes in on the order of only a few hours. From the short duration of these events they inferred that the material must be quite close to the central nucleus. Further analysis performed by Maiolino et al. (2010) with a 300 ks Suzaku observation confirmed these rapid variations and attributed them to comet-shaped BLR clouds transiting the line of sight on timescales of 50–100 ks.
A sustained monitoring campaign of Cen A with RXTE began on 2010 January 1, with 1 ks snapshots every 2 days. One goal of this observing campaign was to better quantify variation in the column density in this source and to search for additional evidence of transits by discrete clumps of material, with the ability to place better constraints on their physical characteristics. To that end we have analyzed the RXTE observations of Cen A from the monitoring campaign, beginning 2010 January 1 up through 2011 April 20. In this paper we present the results of this analysis with data reduction and analysis methods in presented in Section 2 and a discussion of our results in Section 3.
2. Data Reduction and Analysis
We analyzed 228 1 ks snapshots of Cen A with RXTE’s Proportional Counter Array (PCA; Jahoda et al. 2006). For all PCA data extraction and analysis we used HEASOFT version 6.7 software. Using standard extraction procedures (e.g. Rothschild et al. 2011) we extracted PCA STANDARD-2 data from PCU 2 only, using events from the top Xe layer only in order to maximize signal-to-noise. We applied standard screening criteria: 10 from Earth’s limb, 20 min since passage through the peak of the South Atlantic Anomaly, satellite pointing 0.01, and ELECTRON2 (particle flux) 0.1. The background was estimated from the L7-240 background models for low source count rates ( 40 counts s-1 PCU-1) and from the Sky-VLE background model for higher count rates.
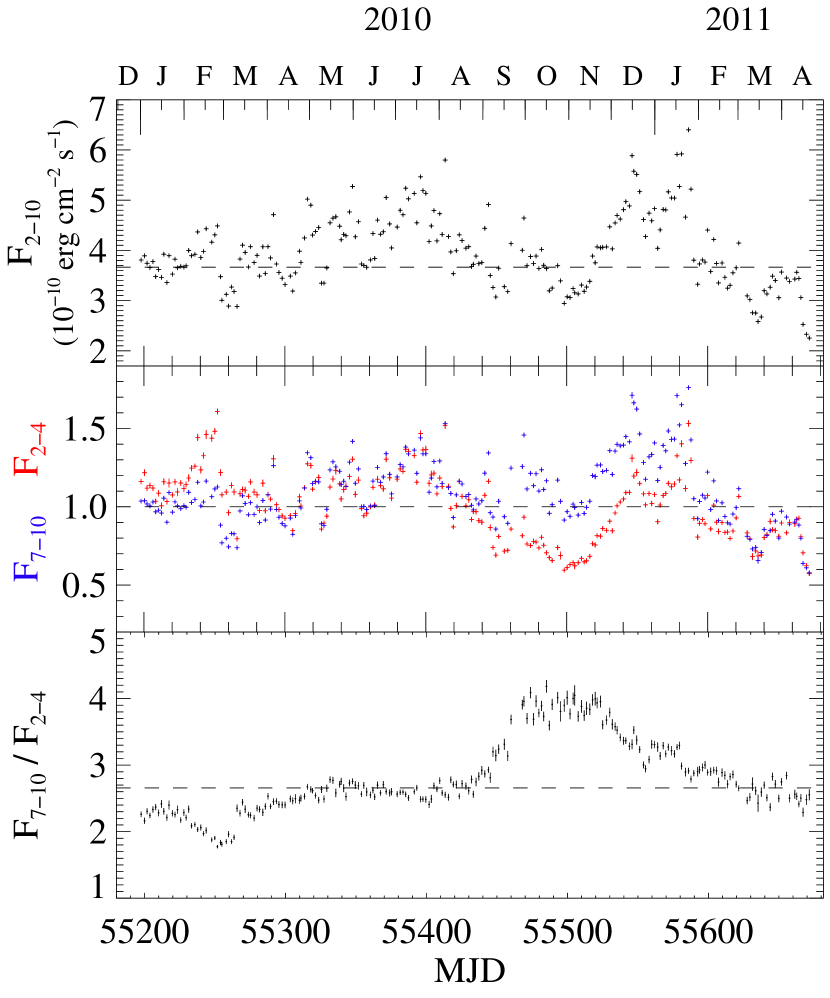
The 2–10 keV flux light curve is shown in Figure 1 along with fluxes in the 2–4 and 7–10 keV ranges. The ratio F7-10/F2-4 can indicate variations in for Compton-thin sources which are independent of variations in the shape of the power-law continuum. There was a clear temporary increase in this ratio between MJD 55440 and 55600 that can be inferred to be a temporary increase in caused by a cloud or clump of material passing through the line of sight to the nucleus. To confirm this we performed time-resolved spectral fitting.
All spectral fitting for this analysis was done using xspec version 12.5.1k with cross-sections from Verner et al. (1996) and solar abundances from Wilms et al. (2000). Fitting clump geometries to the time resolved values was performed in IDL version 6.3. Uncertainties on spectral fit parameters were calculated using a point-to-point variance method (Vaghan & Edelson 2001; Markowitz et al. 2003) at the 1 level for all parameters. This method was appropriate for our analysis since the normal method tends to overestimate errors due to the background modeling for short observations such as ours.
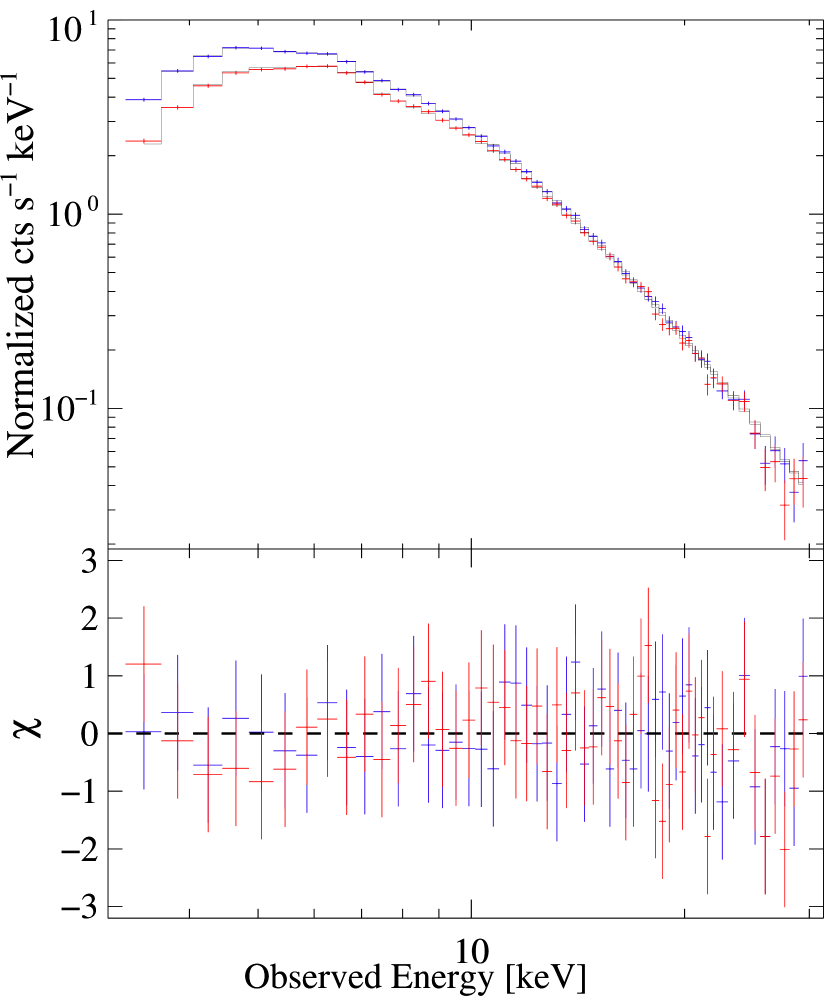
We analyzed PCA spectra in 10 day intervals with total exposures of 3–6 ks. We included data from 3–30 keV in all time bins. Our base model consisted of a power law with a fixed Galactic absorption column of 8.09 cm-2 (Kalberla et al. 2005), an additional cold absorber with a free column density, and an Fe line modeled with a Gaussian. Results from this fitting are shown in Figure 2 and example spectra with models and best-fit residuals are shown in Figure 3. Reduced values were close to 1 in all cases.

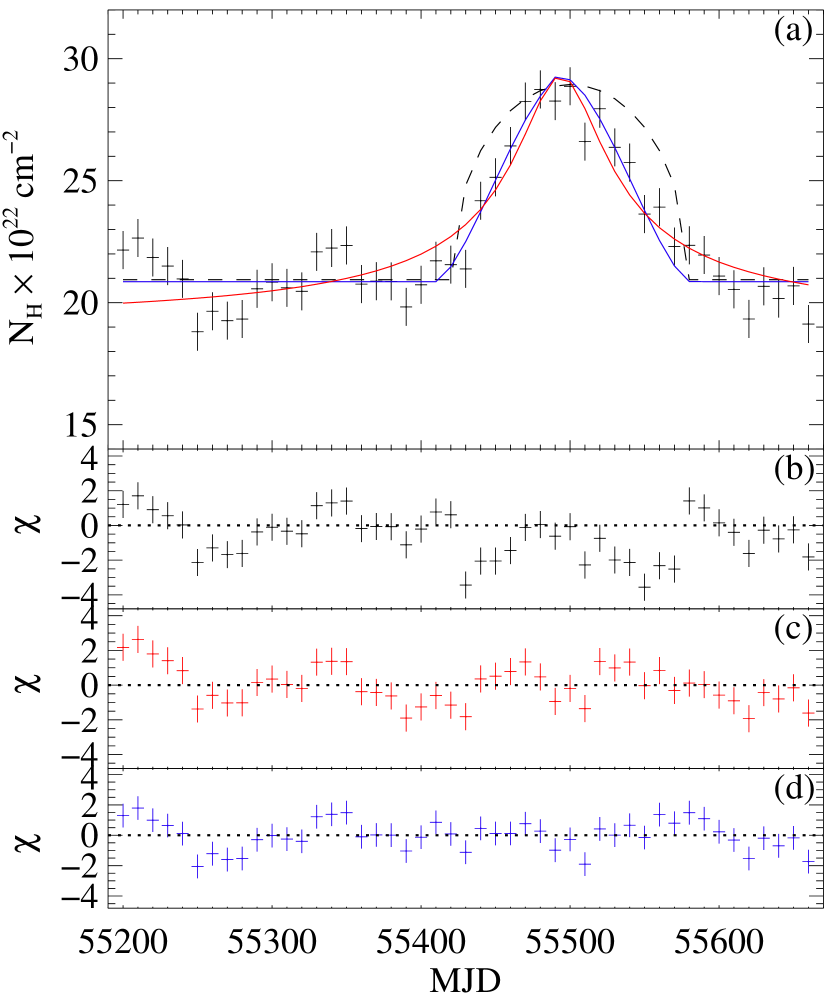
It is clear that increased significantly for 6 months between 2010 August and 2011 February, rising from 20 cm-2 to a maximum of 27 cm-2. The average column density in the 7 months preceding this event was 20.9 cm-2. The photon index values were consistent with a constant through this 16 month period. Fe line parameters (which are not shown here) were poorly constrained but showed no evidence for strong variability. We tried applying the cabs model to test whether the slight fluctuations in the unabsorbed 2–10 keV flux were due to extra scattering by the increased amount of material in the line of sight. This model is more commonly used for Compton-thick sources to model the attenuation of the power law by scattering, however since the changes in were less than cm-2, including this model did not affect the relative magnitude of the fluctuations and we did not use it in our final analysis.
We tested three density profiles for the increase in above a constant baseline which was left free: a sphere of uniform density; a profile as used by Lamer et al. (2003) to fit a similar occultation observed in NGC 3227 given by the equation,
| (1) |
where R is the core radius (Dapp & Basu 2009); and a linear-density sphere with a maximum central density and a density profile described by the equation,
| (2) |
where R is the outer radius of the spherical clump. Figure 4 shows the data, models and fit residuals for all three models. The linear-density sphere gave the best fit with /dof = 73/43. The model gave /dof = 96/43 and the uniform sphere gave an unacceptable fit with /dof = 160/43. For the linear-density sphere we found that the occultation lasted a total of 170 days with a maximum column density of 8.4 cm-2 above a baseline of 20.9 cm-2. The core radius crossing time (FWHM) for the model was 60 days with a maximum column density of 10.3 cm-2 above a constant baseline level of absorption of 19.0 cm-2. For analysis of the physical attributes of the clump based on these models see Section 3.
We also tested for cometary tails as seen by Maiolino et al. (2010), testing for asymmetry in the ingress and egress durations, however these did not improve the fit. From visual inspection it is clear that the Cen A occultation is fairly symmetrical with a smooth, gradual increase and decrease in the column density whereas a comet-like shape would be appropriate for a rapid increase and slow decrease. Consequently, this model is inappropriate for this source.

3. Discussion
Of the other AGN with similar short term increases or decreases in , many have posited that these clouds are part of the BLR rather than constituents of the torus. The low density of the clumps observed in Cen A combined with the lack of detected broad lines in this source (Alexander et al. 1999) make this a very unlikely scenario. Therefore we conclude that the transiting clump(s) that have been seen in this source must arise from the dusty torus.
The clumpy torus model of Nenkova (Nenkova et al. 2008a; Nenkova et al. 2008b) predicts a small number of clumps along the line of sight to the nucleus making up the total observed column density. This is borne out in our observation. The ratio of the baseline column density to the average increase caused by the clump is 5. We can therefore assume that the number of clouds along the line of sight is 5 since some of the baseline absorption column may be dust free and reside inside the inner radius of the dusty torus. For example, the very short transits seen by Risaliti et al. (2009) must come from inside the dust sublimation radius. Assuming a viewing angle to the equatorial plane of 62.6 and an angular distribution of clouds of 60 (Ramos Almeida et al. 2009) we calculate that the average number of clouds along an equatorial ray is 14. This is consistent with Rothschild et al. (2011) as well as the predicted number of clumps from Nenkova et al. (2008b) which is no more than 10–15 clumps along an equatorial ray.
Assuming that all of these clouds have an average column density of 4 cm-2 this would imply a total column density along the equator of 6 cm-2 which is just on the verge of being Compton-thick. This is reasonable given that no Compton reflection signal has ever been detected in this source.
The distance of the dusty torus in Cen A from the central illuminating source derived from infrared measurements by Meisenheimer et al. (2007) was 0.1–0.3 pc. Nenkova et al. (2008b) calculated an inner dust sublimation radius of 0.04 pc. We can place limits on the radius of the torus by following the calculations of Lamer et al. (2003) which use the information that the obscuring material is completely cold with an ionization parameter 1 and assuming Keplerian motion. Their equation (3) gives a relationship between the radius of the material and the ionizing luminosity () of the source:
| (3) |
Where is the mass of the black hole which has been measured at M (Cappellari et al. 2009; Neumayer et al. 2010), where erg s-1 is the ionizing radiation at 13.6 keV, is the crossing time of the event, and is the maximum column density of the clump. Assuming =1 erg cm s-1 gives a minimum distance to the torus of 0.1 pc, consistent with the values found from infrared measurements. We adopt an inner radius of 0.1 pc and an outer radius of 0.3 pc.
Using parameters determined by the linear-density sphere model (this model gives a better fit to the data than the other models, though it is a purely empirical model) we can calculate the size of the clump and quantify the density profile. To begin we adopted the assumptions made in Rothschild et al. (2011) for Keplerian motion at 0.1–0.3 pc around the 6 MBH black hole and calculated a clump velocity of 930–1600 km/s. Combining this with the measured 170 day transit we found a linear-density sphere with a diameter of 1.4–2.4 cm with a central number density of nH = 1.8–3.0 cm-3. The total mass of this clump can be approximated as 2–5 g or about 3–10 times the mass of the Earth.
For comparison, the occultation (if indeed it was a single absorption event) inferred by Rothschild et al. (2011) lasted between 1 and 4 years with an increase in column density of 6 cm-2. Assuming a single uniform sphere it was found that the clump would have an inferred length of 3–12 cm and a number density of 1–3 cm-3.
Fitting this occultation event with a single linear-density sphere model we found a length of 7 cm and a central density of 8 cm-3. The best fit model with residuals is shown in Figure 5; notice that with only three data points we needed to assume the baseline column density rather than leave it as a free parameter as we did with the more recent event. For this baseline we have chosen the longterm average value given in Rivers et al. (2011) of 16.9 cm-2. This is somewhat larger and more diffuse than the more recent clump by a factor of 2–3, however this can easily be explained by inherent variation in clump sizes within the torus. Alternatively two or three much smaller, more dense clumps could adequately fit these three data points with similar characteristics to the more recent event, however with so few data points it is impossible to place constraints on such a scenario.
In conclusion, we have taken advantage of sustained monitoring by RXTE to observe an occultation event in Cen A in detail from ingress to egress. A discrete clump of material likely associated with a clumpy torus transited the line of sight to the central illuminating source for 170 days between 2010 August and 2011 February with a maximum increase in of 8.4 cm-2. Assuming the clump of material was roughly spherical with a linear density profile and assuming a distance from the central nucleus of 0.1–0.3 pc we found that the clump had a linear dimension of 1.4–2.4 cm with a central number density of nH = 1.8–3.0 cm-3, in good agreement with previous results. Two occultation events seen in 10 years confirm that clumps of material are indeed transiting our line of sight and evidence suggests that they are part of a clumpy, Compton-thin torus, the characteristics of which are consistent with the model proposed by Nenkova et al. (2008a; 2008b).
References
- (1)
- (2) Alexander, D.M., Hough, J.H., Young, S., Bailey, J.A., Heisier, C.A., Lumsden, S.L., & Robinson, A., 1999, MNRAS, 303,17
- (3)
- (4) Cappellari, M., Neumayer, N., Reunanen, J., van der Werf, P. P., de Zeeuw, P. T., & Rix, H.-W. 2009, MNRAS, 394, 660
- (5)
- (6) Evans, D.A., Kraft, R.P., Worrall, D.M., Hardcastle, M.J., Jones, C., Forman, W.R., & Murray, S.S. 2004, ApJ, 612, 786
- (7)
- (8) Dapp, W.B. & Basu, S., 2009, MNRAS, 395, 1092
- (9)
- (10) Guainazzi et al. 1998, MNRAS, 301, 1
- (11)
- (12) Kalberla, P.M.W., Burton, W.B., Hartmann, Dap, Arnal, E.M., Bajaja, E., Morras, R., & Pöppel, W.G.L., 2005, A&A, 440, 775
- (13)
- (14) Lamer, G., Uttley, P., & McHardy, I. M. 2003, MNRAS, 342, L41
- (15)
- (16) Longinotti, A. L., Bianchi, S., Ballo, L., de La Calle, I., & Guainazzi, M., 2009, MNRAS, 394, 1
- (17)
- (18) Maiolino, R., Risaliti, G., Salvati, M., Pietrini, P., Torricelli-Ciamponi, G., Elvis, M., Fabbiano, G., Braito, V., & Reeves, J., 2010, A&A, 517, 47
- (19)
- (20) Meisenheimer, K. et al. 2007, A&A, 471, 453
- (21)
- (22) Nandra, K. & Pounds, K. A., 1994, MNRAS, 268, 405
- (23)
- (24) Neumayer, N., Cappellari, M., van der Wert, P., Reunanen, J., Rix, H.-W., de Zeeuw, T., & Davies, R. 2010, The Messenger, 139, 36
- (25)
- (26) Nenkova, M., Sirocky, M. M., Ivezić, Z̆, & Elitzur, M. 2008a, ApJ, 685, 147
- (27) Nenkova, M., Sirocky, M., Nikutta, R., Ivezić, Z̆., & Elitzur, M. 2008b, ApJ, 685, 160
- (28)
- (29) Risaliti, G. et al. 2009, MNRAS, 393, L1
- (30)
- (31) Rivers, E., Markowitz, A., & Rothschild, R. E. 2011, ApJS, 193, 3
- (32)
- (33) Rothschild, R. E., Markowitz, A., Rivers, E., Suchy, S., Pottschmidt, K., Kadler, M., Müller, C., & Wilms, J., 2011, ApJ, 733, 23
- (34)
- (35) Verner, D. A., Ferland, G. J., Korista, K. T., & Yakovlev, D. G. 1996, ApJS, 465, 487
- (36)
- (37) Wilms, J., Allen, A., & McCray, M. 2000, ApJ 542, 914
- (38)
- (39) Zdziarski, A.A., Poutanen, J. & Johnson, W.N. 2000, ApJ, 542, 703
- (40)