X-ray activity phased with planet motion in HD 189733?
Abstract
We report on the follow-up XMM-Newton observation of the planet-hosting star HD 189733 we obtained in April 2011. We observe a flare just after the secondary transit of the hot Jupiter. This event shares the same phase and many of the characteristics of the flare we observed in 2009. We suggest that a systematic interaction between planet and stellar magnetic fields when the planet passes close to active regions on the star can lead to periodic variability phased with planetary motion. By mean of high resolution X-ray spectroscopy with RGS we determine that the corona of this star is unusually dense.
1 Introduction
The evidence of star-planet interaction (SPI) in the X-ray band is a lively matter of debate. To first order, close-in giant planets (also known as “hot Jupiters”) should affect their host stars through both tidal and magneto-hydrodynamical effects (cf. Cuntz et al. 2000 and Ip et al. 2004). Both effects should scale as the power distance between the bodies (Saar et al. 2004). Kashyap et al. (2008) showed that stars with hot Jupiters are statistically brighter in X-rays than stars without hot Jupiters. On average Kashyap et al. (2008) observed an excess of X-ray emission by a factor of 4 in the hot Jupiter sample. Interplay between the magnetic fields of the hot Jupiter and the star may be the source of this difference. This could be due to interacting winds and magnetic fields or indirectly by enhancing the stellar dynamo. On the other hand, Poppenhaeger et al. (2010) (and Poppenhaeger & Schmitt 2011) have found no statistical evidence of X-ray SPI as claimed by Kashyap et al. (2008).
The system of HD 189733 offers a unique environment to study SPI effects in X-rays and disentangle them from proper coronal activity. It is composed of a K1.5V type star (at only 19.3 pc from Sun), and a M4 companion at 3200 AU from the primary, orbiting on a plane perpendicular to the line of sight. It hosts a hot Jupiter class planet (HD 189733 b) at a distance of only 0.031 AU with a orbital period of d (Bouchy et al. 2005).
In 2009 we observed the eclipse of the planetary companion to HD 189733 with the goal of studying star planet interactions (SPI) in the case of a hot Jupiter (Pillitteri et al. 2010, hereafter Paper I). We observed a softening of the spectrum in strict correspondence of the planetary eclipse, and a flare which occurred 3 ks after the end of the eclipse of the planet. The non-detection of the M type companion is a strong constraint on the age of the system at Gyr.
The high age of the secondary is interesting because it is inconsistent with age of the system as derived from stellar activity which is of order 600 Myr (Melo et al. 2006). Recently, Schröter et al. (2011) reported on Chandra observations of an planetary transit of Corot 2A finding a similar case. While they do not detect the transit in X-rays they find that the primary is X-ray bright with a luminosity erg s-1, indicating an age 300 Myr. Meanwhile, a potential stellar companion was undetected down to a limit of ergs s-1 which is inconsistent with the 300 Myr age and the distance of 270 pc.
The beginning of the flare observed in 2009 in HD 189733 is at phase , which coincides with a location 77o forward of the sub-planetary point and emerging to the day side of the star. This is almost exactly the location of the magnetic sub-planetary point as calculated by Lanza (2008). The flare could be associated with the emergence of the foot-point of the magnetic column to the earth facing side or a complex active region induced by magnetic SPI. Overall, the flare is associated with a change of the mean plasma temperature from keV to keV. The O VII triplet is in excess with respect to the best fit model. In the RGS spectra we observed that during the flare the inter-combination line seems to disappear, and the forbidden line is less luminous.
2 Observation and data analysis
The observational setup mimics our previous observation made on May 18th 2009. We obtained a X-ray observation with XMM-Newton around the eclipse of the planet of HD 189733 on April 30th 2011, starting at 23:14.20 (Obs Id: 0672390201), and for a total duration of 39.1 ks. As in the previous observation, we used the Medium filter. The time between observations of HD 189733 was almost 2 years or exactly 61530.1 ks (mid-eclipse to mid-eclipse). The period of the star is 11.9530.009 days (Henry & Winn 2008), hence the star had rotated through 59.57950.045 periods, while the planet had orbited it 321 times.
For the reduction of the data we followed the same procedure as in Paper I, by using SAS ver. 11.0 to extract events, light curves and spectra of HD 189733 recorded with EPIC camera and RGS. For fitting the spectra, we used 2-T VAPEC models for the pre-flare phases (see description of light curve in Sect. 3.1) with different temperatures but coupled to have the same abundances. Abundances of Fe, Ne, and O were left free to vary while all other abundances were kept fixed at the solar values. For flare and post-flare phases we added a third VAPEC component keeping frozen the parameters of the first two VAPEC components. The abundances of the third component were linked and fixed. We obtained estimates of the temperature and emission measure of the flaring plasma, also following its fading after the flare. We applied the same procedure of best fit to the spectra obtained in 2007 (for the whole observation), and 2009 (split in pre-flare, flare and post-flare phases) in order to compare the results.
We merged the RGS spectra in the non-flare and in the flare state of all observations. Flare and non-flare state were fitted independently using Gaussian lines with a narrow intrinsic line width in the SHERPA fitting tool (Refsdal et al. 2011), so that the total line width is dominated by instrumental broadening. Lines are adjusted in wavelength to account for possible errors in the zero-point of the wavelength calibration, but the wavelength difference in multiplets is hold constant. Within the errors, all wavelength are compatible with the theoretical values. Instrumental background and source continuum are assumed to be constant over a small wavelength region around the fitted lines. The fits are done using a Cash statistic, which takes into account the Poisson distribution of counts, but the estimates of errors might be uncertain for very low count numbers.
| Phase | kT1 | kT2 | kT3 | E.M.1 | E.M.2 | E.M.3 | log | log |
|---|---|---|---|---|---|---|---|---|
| (keV) | (keV) | (keV) | (cm-3) | (cm-3) | (cm-3) | (erg s-1 cm-2) | (erg s-1) | |
| 2011 Pre | 0.24 | 0.73 | – | 5.8 | 3.6 | – | -12.5 | 28.17 |
| Flare | (0.24) | (0.73) | 0.9 | (5.8) | (3.6) | 3.0 | -12.36 | 28.29 |
| Post | (0.24) | (0.73) | 0.62 | (5.8) | (3.6) | 1.35 | -12.41 | 28.24 |
| 2009 Pre | 0.18 | 0.47 | – | 4.1 | 5.6 | – | -12.50 | 28.15 |
| Flare | (0.18) | (0.47) | 0.99 | (4.1) | (5.6) | 3.2 | -12.37 | 28.29 |
| Post | (0.18) | (0.47) | 0.75 | (4.1) | (5.6) | 1.3 | -12.4 | 28.22 |
| 2007 | 0.24 | 0.71 | – | 4.7 | 2.8 | – | -12.60 | 28.05 |
3 Results
3.1 PN light curve and spectra
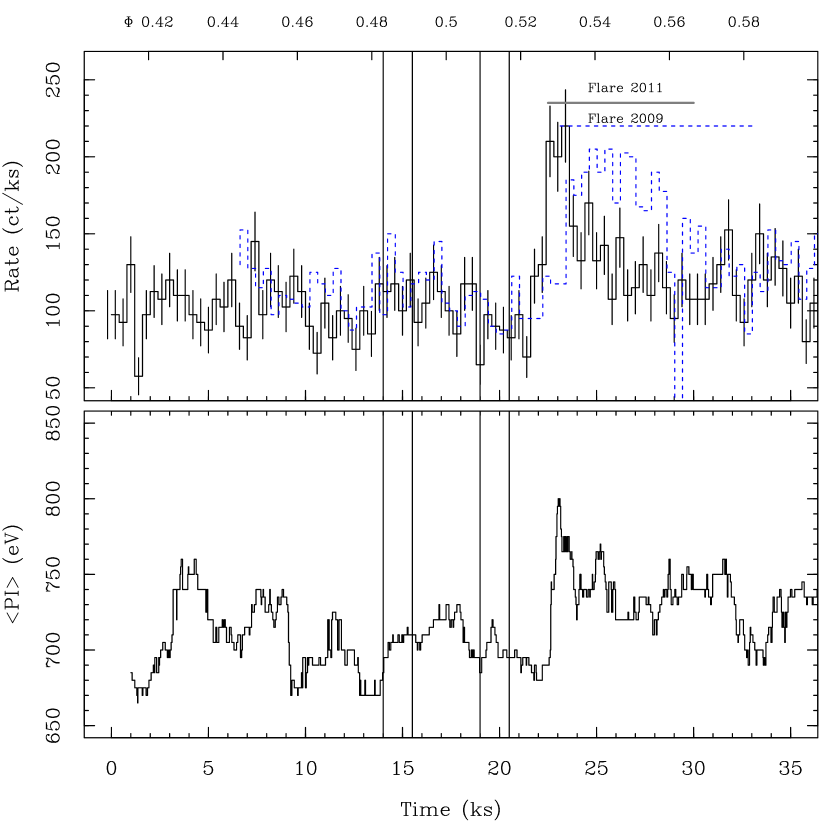
Fig. 1 shows the light curve of EPIC PN in 0.3–1.5 keV
111Ephemerides in http://var2.astro.cz/ETD/etd.php?STARNAME=
HD189733&PLANET=b
(Poddaný et al. 2010).
The overall rate in 2011 is similar to the PN rate recorded in 2009 and
about twice the PN rate in 2007 observation (quiescent rate in 2009 and 2011
ct ks-1, quiescent rate in 2007: ct ks-1).
The average energy of the spectrum in 2011 before and during the eclipse is eV,
it has been eV in 2009 before the eclipse and eV during the eclipse.
During the planetary eclipse we do not see the softening as in 2009.
The most striking feature is the flare after the end of the planetary eclipse, which is analogous to the main flare seen in the 2009 observation. In 2011, the flare starts at phase 0.52, while it starts at 0.54 in 2009. The duration of the flare ( ks, evaluated by eye), the peak rate ( ct ks-1 vs. ks-1 in 2009) and the presence of secondary impulses during the decay are quite similar to those observed in 2009 as well. The detection of two flares within 120 ks (i.e. the sum of exposure times in 2007, 2009 and 2011 observations) is interesting on its own, given that for active stars the typical rate of occurrence of bright flares is one every 500 ks (Wolk et al. 2005, and Caramazza et al. 2007).
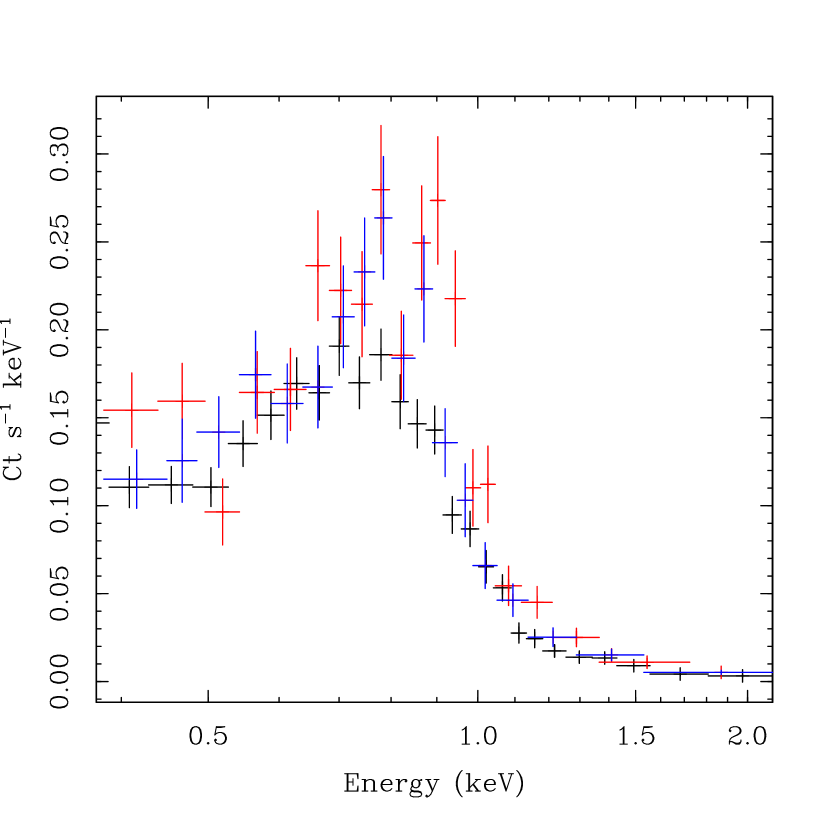
Table 1 reports the best fit values of the spectra before, during and after this flare. For comparison, we report also the values obtained with the same scheme of best fit for 2007 and 2009 observations. Fig. 2 shows the PN spectra accumulated before, during, and after the bright flare observed in 2011.
The pre-flare phase has a best fit with two thermal components, at 0.24 keV and 0.73 keV, respectively. In 2009 the values are lower (0.18 keV and 0.47 keV, respectively) and thus the corona appears colder than in 2011.
During the flare the plasma has a marginally higher temperature, around 0.9 keV (flare temperature in 2009 was keV). In facts, the flare spectrum shows an excess around 0.9 keV (Fig. 2).
In the post-flare phase the plasma cools essentially to the pre-flare temperature. The third component has a temperature similar to the hot component of the pre-flare and it is almost indistinguishable from the latter. It is worth noting that the luminosity of the star remains slightly higher after the flare. This is observed in both 2011 and 2009.
As suggested in Paper I, this flare could arise from an active region which sits in a well defined location on the stellar surface. It is plausible that in this region a strong magnetic field is present given its configuration. The periodic passage of the planet could trigger magnetic reconnections and thus strong flares that could not arise elsewhere on the stellar surface. Fares et al. (2010) have published maps of the configuration of the magnetic field of HD 189733 in 2006, 2007 and 2008. The field has a complex configuration with a toroidal component up to 40G in 2008 (the closest to the 2009 observation and the present one) and it changed configuration between 2006 and 2008. The dipolar component is strongly non-axisymmetric in 2008. Cohen et al. (2011) have shown through MHD simulations based on these maps that magnetic SPI is possible whenever the planetary and stellar alfvènic surfaces intersect each other. Given the non-symmetric shape of the stellar magnetic field, the interaction of planetary and stellar fields are not occurring continuously but at some phase determined by the planetary motion and the stellar rotation.
The emission levels in X-rays in 2009 and 2011 are quite similar. On the other hand, these are greater than in 2007. The observations suggests a cyclic activity which is in agreement with the changes in the magnetic field derived by Fares et al. (2010). We have no information on the topology of the magnetic field during last X-ray observation. The hypothesis that periodic occurrence of strong variability is triggered by the planetary motion needs further observations to be assessed.
3.2 RGS spectroscopy
Merging the RGS spectra of two observations of XMM-Newton at the secondary eclipse and the one at the planetary transit (2007, PI: Wheatley), we have obtained the first high resolution spectroscopy in X-rays of HD 189733. Table 2 shows line strengths of Fe XVII and the He-like Ne IX, O VII and the H-like O VIII. This latter is the only line which is significantly detected by both RGS detectors, the line fluxes are compatible within the statistical errors. Due to CCD failures, O VII is visible only in RGS 1, while Ne IX is visible only in RGS 2.
| line | RGS1 | RGS1-flare | RGS2 | RGS2-flare | |
| [Å] | erg s-1 cm-2 | ||||
| Ne X Ly | 12.13 | … | … | ||
| Ne IX r | 13.45 | … | … | ||
| Ne IX i | 13.55 | … | … | ||
| Ne IX f | 13.7 | … | … | ||
| Fe XVII | 16.78 | … | … | ||
| O VIII Ly | 18.97 | ||||
| O VII r | 21.6 | … | … | ||
| O VII i | 21.81 | … | … | ||
| O VII f | 22.1 | … | … | ||
3.2.1 Temperature
In the flares, the Ne X emission increases by about a factor of three in agreement with the increased temperature seen in the light curve of median energy and spectra of PN. The total emission of the He-like triplets is similar in flare and non-flare intervals.
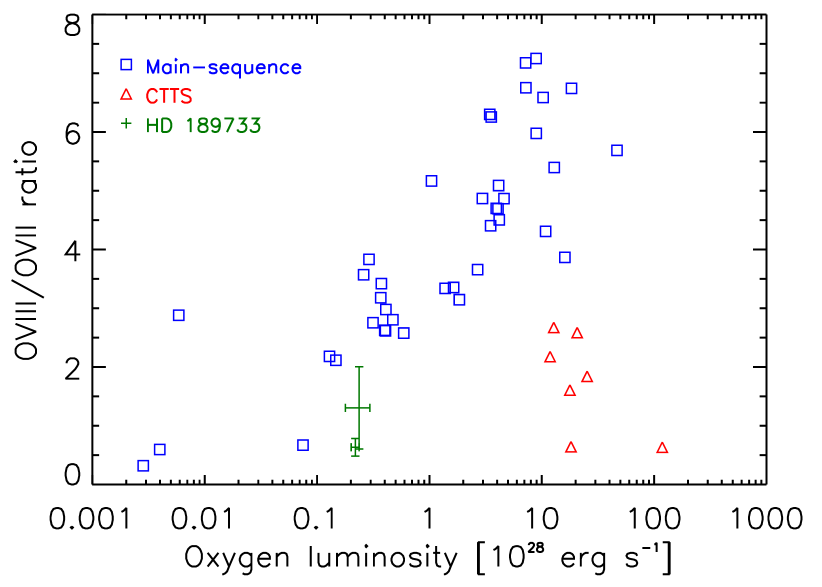
The ratio of lines from different ionization stages can be used as a temperature diagnostic (Mewe 1991). Figure 3 shows the ratio of O VIII/O VII emission compared to the total luminosity in these lines. Blues squares show main-sequence (MS) stars from the sample of Ness et al. (2004), red triangles are classical T Tauri stars (CTTs), which are accreting pre-main sequence stars (Robrade & Schmitt 2007; Günther 2011). CTTs show an excess of cool emission, which is likely powered by accretion shocks. HD 189733 is among the stars in the sample with the lowest X-ray luminosity and O VIII/O VII ratio. Thus, it is marginally cooler than MS stars of comparable luminosity, but its corona is over-dense like PMS accreting stars. All CTTs in Fig. 3 are significantly brighter than HD 189773, but this is a selection bias because only the brightest CTTs can be observed with X-ray gratings.
3.2.2 Density
The ratio of the forbidden line and the inter-combination line in the He-like triplets is density sensitive (Mewe 1991; Porquet & Dubau 2000). In the low-density, limit is 3.5 for O VII () and 3.2 for Ne IX () according to the CHIANTI database (Dere et al. 1997, 2009). We performed Monte-Carlo simulations to account for the non-gaussian errors in the distribution (Günther & Schmitt 2009, appendix A). The Ne IX lines are compatible with the low to moderate density limit in the non-flare state (95% confidence limit , i.e. ), in the flare spectrum the error is too large to constrain the density. The non-detection of the O VII line in the flare is consistent with moderate densities, the 95% confidence lower limit is (). In the non-flare state, the 95% confidence upper and lower boundaries on the ratio are 1.8 () and 0.6 (). Generally, the coronal emission in MS stars is in the low-density limit (Ness et al. 2004), only in a few bright flares higher densities have been seen (e.g. on Proxima Cen, Güdel et al. 2002, 2004).
The total luminosity in the He-like triplets changes little between the flare and the non-flare state. This could indicate that they originate in a dense region which is not affected by flare heating. However, the tentative change in the ratio can be interpreted as a change in density, where the hotter plasma seen in the flare state has a lower density than in the non-flare state.
4 Conclusions
We have analyzed a XMM-Newton observation of HD 189733 at the secondary transit of the planet. We observed a flare with characteristics very similar to that observed in the previous observation at the same phase. The recurrence of such flares is explained by the following scenario: an active region is present at the same location on the stellar surface in both observations. The magnetic interaction with the planet is inducing a flaring activity in this region. The occurrence depends on the configuration of the stellar magnetic field and its strength. Further observations at the same phase can prove or reject this hypothesis.
High resolution spectroscopy in quiescent and flaring state shows that the corona of HD 189733 is marginally cooler than MS stars with same oxygen line luminosity. We find a marginal change in ratio of O VII lines in the flare state, implying a lower density during flares with respect to quiescent state. In summary, the corona of HD 189733 stands apart with respect to other coronae of Main Sequence stars without hot Jupiters. It is cold like the solar corona but it is dense and ten times more luminous and active. This could be related to SPI effects but more observations are needed to clarify the influence of its hot Jupiter on the corona.
References
- Bouchy et al. (2005) Bouchy, F., Udry, S., Mayor, M., et al. 2005, A&A, 444, L15
- Caramazza et al. (2007) Caramazza, M., Flaccomio, E., Micela, G., et al. 2007, A&A, 471, 645
- Cohen et al. (2011) Cohen, O., Kashyap, V. L., Drake, J. J., et al. 2011, ApJ, 733, 67
- Cuntz et al. (2000) Cuntz, M., Saar, S. H., & Musielak, Z. E. 2000, ApJ, 533, L151
- Dere et al. (1997) Dere, K. P., Landi, E., Mason, H. E., Monsignori Fossi, B. C., & Young, P. R. 1997, A&AS, 125, 149
- Dere et al. (2009) Dere, K. P., Landi, E., Young, P. R., et al. 2009, A&A, 498, 915
- Fares et al. (2010) Fares, R., Donati, J.-F., Moutou, C., et al. 2010, MNRAS, 406, 409
- Güdel et al. (2004) Güdel, M., Audard, M., Reale, F., Skinner, S. L., & Linsky, J. L. 2004, A&A, 416, 713
- Güdel et al. (2002) Güdel, M., Audard, M., Skinner, S. L., & Horvath, M. I. 2002, ApJ, 580, L73
- Günther (2011) Günther, H. M. 2011, Astronomische Nachrichten, 332, 448
- Günther & Schmitt (2009) Günther, H. M. & Schmitt, J. H. M. M. 2009, A&A, 494, 1041
- Henry & Winn (2008) Henry, G. W. & Winn, J. N. 2008, AJ, 135, 68
- Ip et al. (2004) Ip, W.-H., Kopp, A., & Hu, J.-H. 2004, ApJ, 602, L53
- Kashyap et al. (2008) Kashyap, V. L., Drake, J. J., & Saar, S. H. 2008, ApJ, 687, 1339
- Lanza (2008) Lanza, A. F. 2008, A&A, 487, 1163
- Melo et al. (2006) Melo, C., Santos, N. C., Pont, F., et al. 2006, A&A, 460, 251
- Mewe (1991) Mewe, R. 1991, A&A Rev., 3, 127
- Ness et al. (2004) Ness, J.-U., Güdel, M., Schmitt, J. H. M. M., Audard, M., & Telleschi, A. 2004, A&A, 427, 667
- Pillitteri et al. (2010) Pillitteri, I., Wolk, S. J., Cohen, O., et al. 2010, ApJ, 722, 1216
- Poddaný et al. (2010) Poddaný, S., Brát, L., & Pejcha, O. 2010, New A, 15, 297
- Poppenhaeger et al. (2010) Poppenhaeger, K., Robrade, J., & Schmitt, J. H. M. M. 2010, A&A, 515, A98+
- Poppenhaeger & Schmitt (2011) Poppenhaeger, K. & Schmitt, J. H. M. M. 2011, ApJ, 735, 59
- Porquet & Dubau (2000) Porquet, D. & Dubau, J. 2000, A&AS, 143, 495
- Refsdal et al. (2011) Refsdal, R., Doe, S., Nguyen, D., et al. 2011, in Astronomical Society of the Pacific Conference Series, Vol. 442, Astronomical Society of the Pacific Conference Series, ed. I. N. Evans, A. Accomazzi, D. J. Mink, & A. H. Rots, 687–+
- Robrade & Schmitt (2007) Robrade, J. & Schmitt, J. H. M. M. 2007, A&A, 473, 229
- Saar et al. (2004) Saar, S. H., Cuntz, M., & Shkolnik, E. 2004, in IAU Symposium, Vol. 219, Stars as Suns : Activity, Evolution and Planets, ed. A. K. Dupree & A. O. Benz, 355–+
- Schröter et al. (2011) Schröter, S., Czesla, S., Wolter, U., et al. 2011, A&A, 532, A3+
- Wolk et al. (2005) Wolk, S. J., Harnden, Jr., F. R., Flaccomio, E., et al. 2005, ApJS, 160, 423