Phase-resolved energy spectra of the Crab pulsar in the range of - measured with the MAGIC telescopes
We use of stereoscopic data taken with the MAGIC telescopes to investigate the very high-energy (VHE) gamma-ray emission of the Crab pulsar. Our data show a highly significant pulsed signal in the energy range from to in both the main pulse (P1) and the interpulse (P2) phase regions. We provide the widest spectra to date of the VHE components of both peaks, and these spectra extend to the energy range of satellite-borne observatories. The good resolution and background rejection of the stereoscopic MAGIC system allows us to cross-check the correctness of each spectral point of the pulsar by comparison with the corresponding (strong and well-known) Crab nebula flux. The spectra of both P1 and P2 are compatible with power laws with photon indices of (P1) and (P2), respectively, and the ratio P1/P2 between the photon counts of the two pulses is . The VHE emission can be understood as an additional component produced by the inverse Compton scattering of secondary and tertiary pairs on IR-UV photons.
Key Words.:
gamma rays: stars – pulsars: individual: Crab pulsar1 Introduction
The Crab pulsar is a young neutron star that is the central remnant of the supernova SN 1054 (Mitton 1978). It is one of the few pulsars that have been detected in almost all energies, ranging from radio (e.g., Lyne et al. 1993) to VHE gamma rays. In the highest-energy regime, it was detected up to a few tens of GeV by Fermi-LAT (Abdo et al. 2010a), between approximately by MAGIC (Aliu et al. 2008; Saito 2010; Aleksić et al. 2011) and above by VERITAS (Aliu et al. 2011). The light curves and the spectra obtained by these observations suggest that gamma-ray pulsars have high-altitude emission zones that avoid a super-exponential spectral cutoff, which would be caused by magnetic pair production. Consequently, the favored models to explain the production of gamma rays to at least a few GeV are those in which fan-like beams of high-energy electrons scan over a large fraction of the outer magnetosphere, either very close to the light cylinder (outer gap model, Cheng et al. 1986; Romani 1996) or all along the last open field lines (slot gap model, Arons 1983; Muslimov & Harding 2004).
For other rotation-powered gamma-ray pulsars beside the Crab pulsar, Fermi-LAT observations have shown that their energy spectra exhibit exponential cutoffs at around a few GeV (Abdo et al. 2010b). This mild cutoff has been widely accepted as a result of the curvature process by migrating along curved paths. In this scenario, the cutoff energy corresponds to the highest characteristic curvature-radiation energy of the particles accelerated in the magnetosphere (e.g., Romani 1996). However, the spectrum of the Crab pulsar strongly disfavors an exponential cutoff (Aleksić et al. 2011; Aliu et al. 2011), making this pulsar a counterexample of the general property. Thus, to develop pulsar emission theories beyond the widely accepted curvature-radiation models, it is essential to examine the detailed phase-resolved spectrum of this youngest pulsar in the HE to VHE regimes.
2 Data set and analysis techniques
The two MAGIC telescopes (Aleksić et al. 2012; Zanin et al. 2011) situated on the island of La Palma (28.8° N, 17.8° W, ), use the imaging atmospheric Cherenkov technique to detect gamma rays above a few tens of GeV111The nominal threshold in standard trigger mode, defined as the peak of the simulated energy distribution for a Crab-nebula-like spectrum after all cuts and at low zenith angles, is .. Since summer 2009, when the system started operating in stereoscopic mode, its background suppression was substantially improved, and a sensitivity222Defined as the source strength needed to achieve in effective on-time. of Crab nebula units above has been achieved (Aleksić et al. 2012).
In the analysis presented here, we used of good quality stereoscopic data from the winter seasons in 2009/2010 and 2010/2011. Of these data, were taken in the wobble observation mode (Fomin et al. 1994), and another in on-source observation mode. The data were taken at zenith angles below to ensure a low threshold.
For the data analysis, we used the standard MAGIC analysis package MARS (Moralejo et al. 2009; Aleksić et al. 2012), applying the so-called sum cleaning (Lombardi et al. 2011) to achieve the lowest possible threshold. For the gamma/hadron separation and gamma direction estimation we apply the random forest (RF) technique (Albert et al. 2008). Because our background is dominated by Crab nebula gamma rays instead of hadrons already above , we opted for loose and conservative selection cuts. The phase of each event with respect to the main radio pulse was calculated using the TEMPO2 package (Hobbs et al. 2006) and the monthly ephemerides publicly provided by the Jodrell Bank Observatory333http://www.jb.man.ac.uk/research/pulsar/crab.html (Lyne et al. 1993).
For the spectra, we applied the unfolding algorithms described in Albert et al. (2007). This procedure corrects the migrations and the energy biases expected in the threshold regime. During unfolding iterations, the simulated events are reweighted each time with the appropriate spectrum derived in the previous iteration.
3 Results
3.1 Folded light curves
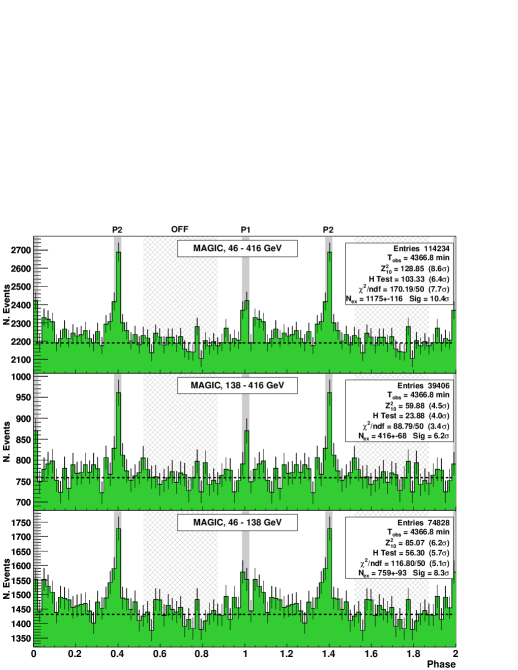
We obtained three folded light curves using all data with estimated energies between and for two sub-ranges and (Fig.1). The median true energies of these samples were estimated from simulations to be approximately , and , respectively. The significance of the pulsation was tested with the test, the H test (de Jager et al. 1989), and a simple -test. None of these tests makes an a priori assumption concerning the position and the shape of the pulsed emission, and they yield significances of , and , respectively. The folded light curve clearly shows two distinct peaks, the well-known P1 and P2.
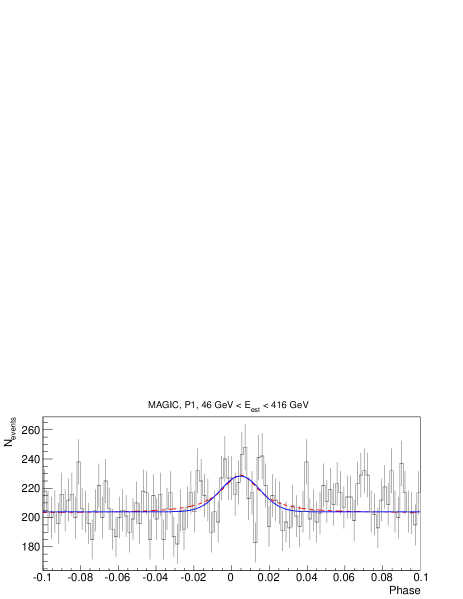
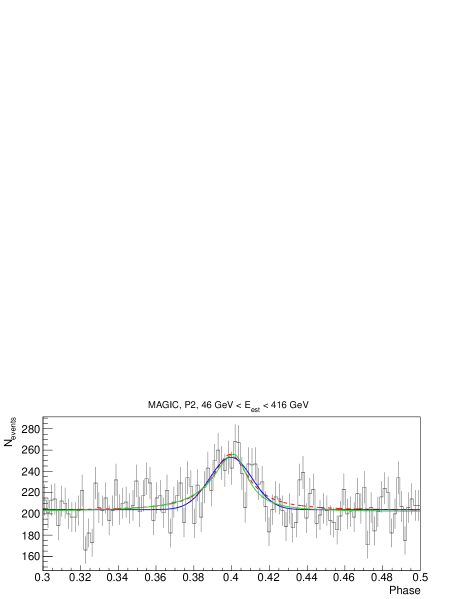
We fitted a very fine-binned all-energy folded light curve, maximizing a Poissonian likelihood function that includes two Gaussians or Lorentzians over a constant background. The fitted Gaussian (Lorentzian) positions of P1 and P2 are () and (), respectively, with corresponding pulse widths (FWHM) of () and (). The signal in P2 is strong enough to also be fitted with an asymmetric Lorentzian, which involves more parameters. The results are displayed in Fig. 2. All fits to our data yield very similar likelihoods, which neither supports nor excludes the presence of the tails implied by a Lorentzian function. Furthermore, the asymmetric fit does not yield a significant difference in the leading and the trailing wings of P2. Hence, we conclude that the conservative approach of using a Gaussian parameterization is sufficient to describe our peaks.
Notably, there is a positive excess throughout the region between the two peaks. Most prominently, the trailing wing TW1 has an excess corresponding to in the lower-energy bin (), which may allow for a significant detection once more data is collected. A bridge emission between the peaks in our lowest-energy light curve is also expected if one considers that in the Fermi-LAT data presented in Abdo et al. (2010a), the bridge emission is evident up to at least , and it is denoted as being spectrally harder than the peak emission. However, our current significance in the bridge region is too low for a spectral analysis and will not be considered in more detail.
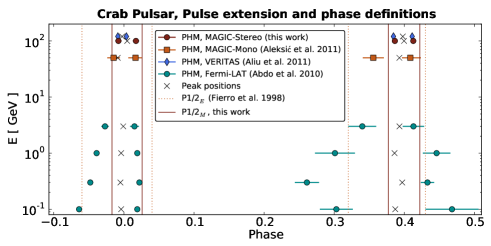
The peaks we found are significantly narrower than those in the GeV regime, and along with MAGIC-Mono and VERITAS data, a consistent trend from GeV to beyond can be established (Fig. 3)444A correction to the absolute phase values in Abdo et al. (2010a) was announced on the Fermi-LAT websites (http://fermi.gsfc.nasa.gov/ssc/data/access/lat/ephems/) and is incorporated in this plot.. Consequently, the excess we found is much more concentrated than the wide peak ranges defined in Fierro et al. (1998) (P1 and P2, where E stands for EGRET, in contrast to the MAGIC and VERITAS definitions below). Because with too-large phase intervals one integrates an unnecessarily large number of noise events, we decided to investigate the signal both in the EGRET intervals and in narrower, a posteriori defined phase intervals, using the Gaussian peak positions , as was done in Aliu et al. (2011). We obtained P1 and P2, the excess of which corresponds to after Li & Ma (1983, Eq. 17, see also Table 1). The low-/high-energy Li &Ma significances for P1M (P2M) are 4.4/3.3 (7.9/5.9). A listing of the all-energy significances can be found in Table 1.
It is important to note that the two phase interval definitions are equally valid. The difference between them is mainly that the wide intervals lead to a higher noise contribution but are free of any possible selection bias, whereas the narrow intervals have much lower noise, but are affected by a minor selection bias. The VERITAS results shown in Aliu et al. (2011) were calculated using P1 and P2, which is still a bit narrower than our definitions.
For the emission ratio between the two peaks, we found for P1M/P2M and for P1E/P2E. We also looked for the differences in the pulse shape parameters between the two energy intervals of Fig. 1, but we found no significant changes in the pulse width, the position, or the relative intensity (for either phase range definition). This invariance might be related to the fact that although our energy range is almost an order of magnitude, the mean energies of the two energy bins ( vs. ) are comparably close to each other; thus, the lever arm is small compared to the energy-dependent trend in Fig. 3.
3.2 Energy spectra
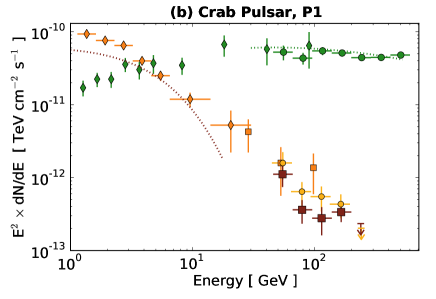
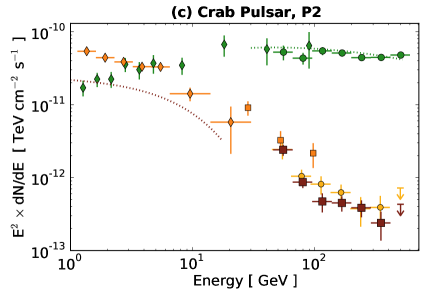
We calculated the energy spectra for (P1+P2)M, P1M and P2M, which are shown as the red squares in Fig. 4, and for comparison, we also calculated the spectra for the unbiased EGRET intervals (see above), which are shown as the yellow circles. The latter can be compared directly to previous studies, including the monoscopic MAGIC observations. Given that the EGRET intervals cover 21 of the whole phase, they cause a higher background noise than the MAGIC phase ranges, which cover only 8.8. The VERITAS phase intervals cover 6.8 of the whole phase, which is three times less than the EGRET definitions. Although most of their narrow pulse may indeed be contained in this interval, one may expect a certain discrepancy in flux related to this difference in selection.
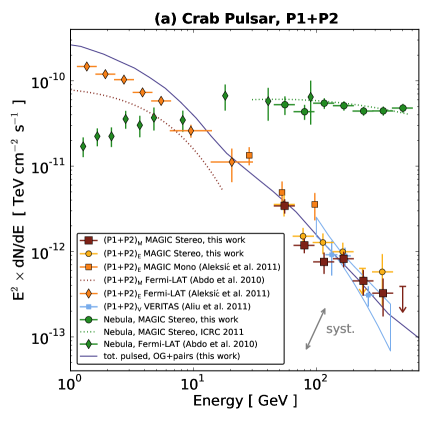
The spectra we obtain for the EGRET intervals are compatible with the monoscopic measurements from Aleksić et al. (2011), considering that the statistical deviations are at most and many of the systematic errors of the two measurements are independent. Our stereoscopic measurements, however, support the possibility that the gamma-ray energy of MAGIC-mono data may have been over-estimated, as already discussed in Saito (2010).
The EGRET and MAGIC phase definitions do not result in significantly different P1 and P2 spectra, although the points of the latter are systematically somewhat below the former. This is self-consistent, because the EGRET intervals enclose the MAGIC intervals and shows that the selection bias that affects the latter is probably very small.
To determine the spectral parameters and values, we applied a forward unfolding (Albert et al. 2007), which is the most robust method to parameterize the data. The spectra could be described by power laws as shown in Table 1. It should be noted that the values that we found are not optimal, especially for the spectrum of P1M. However, the significance of this inconsistency ( pre-trial) is too low to claim a feature with the data we present here, especially if the systematic uncertainties are considered.
The ratio of the normalization constants between P1 and P2 at is , which is consistent with the values directly derived from the light curves. We cross-checked the (P1+P2)M spectrum by comparing the 2009/10 data to 2010/11 data, on- to wobble-mode data, two zenith angle ranges, two quality cut levels and four unfolding algorithms, and found that the spectrum was stable within the errors.
To ensure a good understanding of all possible systematic effects, we furthermore determined the Crab nebula spectrum from the data taken in wobble mode, analyzing the same energy range with the same energy binning. The nebula spectrum that we obtained with our cuts (see Fig. 4) agrees with both the recent Crab nebula analysis in Zanin et al. (2011) and the Fermi-LAT data in Abdo et al. (2010a), which confirms the good performance of our spectral analysis down to . Notably, also the Crab nebula flux of the lowest-energy point, which is at approximately , agrees within errors with the function derived with a combined Fermi-LAT/MAGIC fit in Zanin et al. (2011). This fit function is basically independent of the lowest-energy MAGIC point because it is determined by the statistically much more precise points at higher and lower energies. From these results, we find no indication that the total systematic flux uncertainty is beyond the standard low-energy numbers given in Aleksić et al. (2012)555This argument may be regarded as a calibration of the pulsar spectra on the nebula spectrum, a method that is not applicable on the nebula spectrum itself, but holds for any other source.. These systematic uncertainties are on the energy scale and on the flux normalization, which is displayed in the upper panel of Fig. 4. Assuming a photon index of 3.6, the total flux uncertainty including a possible energy bias is therefore at low energies. The uncertainty of the spectral index of such a soft spectrum is approximately . All MAGIC spectra shown in Fig. 4 are unfolded; thus, the statistical errors are correlated by , reflecting our energy resolution and bias, which vary from , depending on the energy (see Aleksić et al. 2012).
Figure 4 also shows the Fermi-LAT spectra in the EGRET intervals as determined in Aleksić et al. (2011). They extrapolate consistently to the monoscopic and stereoscopic spectra within systematic and statistical uncertainties. To estimate a Fermi-LAT spectrum for the MAGIC phase range definition, we summed up the matching phase-resolved fit functions provided in Abdo et al. (2010a). Because their flux constants are differential in phase, the emission from the partly covered phase intervals could also be approximated. We find that our narrower intervals lead to substantially lower GeV equivalent flux spectra.
In general, when comparing our energy spectra to those extracted from Fermi-LAT, VERITAS or MAGIC-Mono data, it is important to bear in mind that in addition to the different phase interval definitions, all of these experiments suffer different and energy-dependent systematic uncertainties that may lead to discrepancies on the order of in energy.
| Phase | a𝑎aa𝑎aDetection significance after Li & Ma (1983, Eq. 17) | b𝑏bb𝑏bFlux at in units of | Phot. index | c𝑐cc𝑐cNumber of degrees of freedom taken from the distribution of estimated energies, which may deviate from the number of unfolded points in Fig. 4. | prob.d𝑑dd𝑑dThe fit probabilities calculated from the values do not include systematic effects. |
|---|---|---|---|---|---|
| (P1+P2)M | 10.4 | ||||
| P1M | 5.5 | ||||
| P2M | 9.9 | ||||
| (P1+P2)E | 7.7 | ||||
| P1E | 3.9 | ||||
| P2E | 8.0 |
4 Discussion and conclusions
We found a pulsed VHE gamma-ray signal from the Crab pulsar that allows us to present spectra with an unprecedentedly broad energy range and phase resolution. For completeness and comparison, we provide analyses for both the previously used phase intervals in Fierro et al. (1998), and the narrower peaks that we find in our folded light curves. The range of our spectra is about one order of magnitude, and, along with the MAGIC-Mono (Aleksić et al. 2011) and the Fermi-LAT data (Abdo et al. 2010a), comprise the first gamma-ray spectrum of the Crab pulsar from to without any gap. On the high-energy end, this result agrees with the recently published VERITAS spectrum of P1+P2 above , including also the positions and the remarkably narrow widths of the two pulses.
To interpret the observed pulsed spectrum in the context of the outer-gap (OG) model, we follow the same method as described in Sect. 8.2 of Aleksić et al. (2011). In this framework, the VHE compontent of the spectrum is the inverse Compton radiation of secondary and tertiary electron pairs on magnetospheric IR-UV photons. To derive the expected gamma-ray flux of this scenario, we solve the set of Poisson equations for the non-corotational potential (Eq. [9] in Aleksić et al. (2011)) with the Boltzmann equations for the created electrons and positrons and the radiative transfer equation of the emitted photons.
We present our theoretical calculation of the total pulsed spectrum as a violet solid curve in the upper plot of Fig. 4. In this calculation, the angle between the rotational and the magnetic axes is assumed to be , and the observer’s viewing angle is .
In Aleksić et al. (2011), the calculations of both (the electric field component projected along the local magnetic field line, which accelerates ) and the resultant primary gamma-ray emissions (curvature+IC) were carried out within from the rotation axis, where is the radius of the light cylinder. In our new calculation, to take account the strong primary IC emission that becomes important near the light cylinder, we extend the calculation region up to for and up to for primary gamma-ray emissions, after confirming that the emission above is negligible. Here, is a safe upper boundary for the calculation, because is anyway diminished at owing to the curving-up field-line geometry towards the rotation axis near the light cylinder.
A remarkable consequence of this extended calculation is an increased inward flux of primary gamma rays originating from the upper side of the gap, which leads to a higher abundance of pair-produced at lower altitudes (). This screens the original and hence reduces the curvature-radiation component in the primary spectrum. This reduction makes our new calculation more compatible with the Fermi-LAT data at GeV energies but does not significantly affect the secondary and tertiary components at energies beyond a few tens of GeV. Hence, we conclude that our revised model can reproduce the total pulsed spectrum between and well (see also Lyutikov et al. (2011) for an analytical argument of this process).
However, a remaining caveat of our new calculation is that it still includes the bridge emission that is not contained in the spectra of only P1+P2. Therefore, it is still above the Fermi-LAT flux points in Fig. 4. A phase-resolved modeling is ongoing and will be presented in the future. In general, it is however difficult to compute the spectral shape above 100 GeV with high precision in the present OG model for the Crab pulsar. This is because the photon-photon cross section, and therefore the gamma-ray absorption, depends on the square of the collision angle, which is typically a few degrees. Hence a small variation in the geometry can have a large impact on the flux that escapes the pulsar. Thus, our model should not be interpreted as a hard quantatative prediction; instead, it is meant to show that the hard component we see in the experiment can quantitatively be met within the present understanding of the OG model. Similarly, the slight modulations of the power law component are not to be interpreted as a significantly predicted feature.
Other possible Ansätze to explain the VHE emission include the production of inverse Compton radiation in the unshocked pulsar wind outside the light cylinder by pulsed photons (Aharonian et al. 2012; Aharonian & Bogovalov 2003), a striped pulsar wind (Pétri 2011), or the annular gap model presented in Du et al. (2012). The two crucial spectral features to establish to test these models are the expected spectral upward-kink in the transition region between the curvature and the hard component, and the detection or exclusion of a terminal cutoff at a few hundred GeV.
Another topic that we will be able to address with a times larger dataset is the energy dependence of the pulse shape parameters. The narrowness of the pulses and its evolution with energy are a stringent requirement that the theoretical modeling must fulfill because the folded light curve is almost stable against systematic uncertainties. Moreover, the indication of pulsed emission in the trailing wing of P1 may indicate that a VHE signal between the two peaks might be within reach for low-threshold IACT systems. The MAGIC telescopes, which are being upgraded in 2011/12, can address these topics in the coming years when more data will improve the statistical precision of the measurements.
Acknowledgements.
We would like to thank the Instituto de Astrofísica de Canarias for the excellent working conditions at the Observatorio del Roque de los Muchachos in La Palma. The support of the German BMBF and MPG, the Italian INFN, the Swiss National Fund SNF, and the Spanish MICINN is gratefully acknowledged. This work was also supported by the Marie Curie programme, the CPAN CSD2007-00042 and MultiDark CSD2009-00064 projects of the Spanish Consolider-Ingenio 2010 programme, grant DO02-353 of the Bulgarian NSF, grant 127740 of the Academy of Finland, the YIP of the Helmholtz Gemeinschaft, the DFG Cluster of Excellence “Origin and Structure of the Universe”, the DFG Collaborative Research Centers SFB823/C4 and SFB876/C3, the Polish MNiSzW grant 745/N-HESS-MAGIC/2010/0 and the Formosa Program between the National Science Council in Taiwan and the Consejo Superior de Investigaciones Cientificas in Spain administered through the grant number NSC100-2923-M-007-001-MY3.References
- Abdo et al. (2010a) Abdo, A. A., Ackermann, M., Ajello, M., et al. 2010a, ApJ, 708, 1254
- Abdo et al. (2010b) Abdo, A. A., Ackermann, M., Ajello, M., et al. 2010b, ApJS, 187, 460
- Aharonian & Bogovalov (2003) Aharonian, F. A. & Bogovalov, S. V. 2003, New Astronomy, 8, 85
- Aharonian et al. (2012) Aharonian, F. A., Bogovalov, S. V., & Khangulyan, D. 2012, Nature (advanced online publication: http://dx.doi.org/10.1038/nature1079)
- Albert et al. (2007) Albert, J., Aliu, E., Anderhub, H., et al. 2007, NIM, 494
- Albert et al. (2008) Albert, J., Aliu, E., Anderhub, H., et al. 2008, NIM, 424
- Aleksić et al. (2011) Aleksić, J., Alvarez, E. A., Antonelli, L. A., et al. 2011, ApJ, 742, 43
- Aleksić et al. (2012) Aleksić, J., Alvarez, E. A., Antonelli, L. A., et al. 2012, Astropart. Phys., 35, 435
- Aliu et al. (2008) Aliu, E., Anderhub, H., Antonelli, L. A., et al. 2008, Science, 322, 1221
- Aliu et al. (2011) Aliu, E., Arlen, T., Aune, T., et al. 2011, Science, 334, 69
- Arons (1983) Arons, J. 1983, ApJ, 266, 215
- Cheng et al. (1986) Cheng, K. S., Ho, C., & Ruderman, M. 1986, ApJ, 300, 500
- de Jager et al. (1989) de Jager, O. C., Raubenheimer, B. C., & Swanepoel, J. W. H. 1989, A&A, 221, 180
- Du et al. (2012) Du, Y., Qiao, G., & Wang, W. 2012, ApJ, in press, ArXiv e-prints 1202.1096
- Fierro et al. (1998) Fierro, J. M., Michelson, P. F., Nolan, P. L., & Thompson, D. J. 1998, ApJ, 494, 734
- Fomin et al. (1994) Fomin, V. P., Stepanian, A. A., Lamb, R. C., et al. 1994, Astropart. Phys., 2, 137
- Hobbs et al. (2006) Hobbs, G. B., Edwards, R. T., & Manchester, R. N. 2006, MNRAS, 369, 655
- Li & Ma (1983) Li, T.-P. & Ma, Y.-Q. 1983, ApJ, 272, 317
- Lombardi et al. (2011) Lombardi, S., Berger, K., Colin, P., et al. 2011, in Proc. ICRC 2011, ArXiv e-prints 1109.6195
- Lyne et al. (1993) Lyne, A. G., Pritchard, R. S., & Graham-Smith, F. 1993, MNRAS, 265, 1003
- Lyutikov et al. (2011) Lyutikov, M., Otte, N., & McCann, A. 2011, ArXiv e-prints 1108.3824
- Mitton (1978) Mitton, S. 1978, The Crab Nebula
- Moralejo et al. (2009) Moralejo, A., Gaug, M., Carmona, E., et al. 2009, in Proc. ICRC 2009, ArXiv e-prints 0907.0943
- Muslimov & Harding (2004) Muslimov, A. G. & Harding, A. K. 2004, ApJ, 606, 1143
- Pétri (2011) Pétri, J. 2011, MNRAS, 412, 1870
- Romani (1996) Romani, R. W. 1996, ApJ, 470, 469
- Saito (2010) Saito, T. 2010, PhD thesis, Ludwig-Maximilians-Universtät, München, ArXiv e-prints 1105.3400
- Zanin et al. (2011) Zanin, R., Mazin, D., Carmona, E., et al. 2011, in Proc. ICRC 2011, ArXiv e-prints 1110.2987