Identified Particle Production from the BES at RHIC
Abstract
The RHIC Beam Energy Scan focuses on the study of the QCD phase diagram — temperature () vs. baryon chemical potential (). The aim is to verify some predictions from QCD: that a cross-over occurs at = 0, that there exists a first-order phase transition at large and a critical point at an intermediate . The spectra and ratios of produced particles can be used to extract and in different energies and system sizes. The STAR experiment has collected data for Au+Au collisions at 7.7 GeV, 11.5 GeV, and 39 GeV in the year 2010. We present midrapidity spectra, rapidity density, average transverse mass, and particle ratios for identified hadrons from the STAR experiment. The centrality and transverse momentum dependence of the particle yields and ratios are compared to existing data at lower and higher beam energies. The chemical and kinetic freeze-out conditions are extracted from the ratios and particle spectra.
I Introduction
The RHIC beam energy scan (BES) is devoted to exploring the QCD phase diagram rhicbes1 ; rhicbes2 ; qcdscience . The QCD phase diagram represents the variation of temperature vs. baryon chemical potential . At low temperatures, the relevant degrees of freedom are expected to be hadronic but at high temperatures, the quarks and gluons are the relevant degrees of freedom of the system. In the QCD phase diagram, at 0, the transition from hadronic gas to quark gluon plasma (QGP) is expected to be a crossover lattice . At large , it is expected to be a first order phase transition firstorder . The point where the first order phase transition line ends is called the QCD critical point which is of current interest for many heavy-ion experiments rhicbes1 ; rhicbes2 ; cp_exp . The main objectives of RHIC BES are to search for the possible QCD phase boundary and to search for the possible QCD critical point in the QCD phase diagram. In addition, it will be interesting to see how various observables, suggesting QGP formation at top RHIC energies, behave as the collision energy is decreased. This will help to locate the beam energy where there is no QGP formation or the energy representing “turn off” of the QGP signatures. A few potential observables for exploring the QCD phase diagram are: constituent-quark scaling of elliptic flow, parity-violation in strong interactions, wiggle shape of directed flow of protons, freeze-out eccentricity, ratio fluctuations, and higher moments of net-protons rhicbes1 .
The QCD phase diagram can be accessed by varying temperature and baryonic chemical potential . Experimentally this can be achieved by varying the colliding beam energy. A - space point in the QCD phase diagram can be obtained from the spectra and ratios of the produced hadrons. Once the - space point is obtained, one can study various signatures, mentioned above, for evidence of the possible QCD phase boundary and QCD critical point. In the year 2010, the STAR experiment collected data for Au+Au collisions at energies 7.7, 11.5, and 39 GeV, as part of the proposed energies for the BES program, in addition to usual energies of 62.4 and 200 GeV.
II Data Analysis
The data presented here are for Au+Au collisions at = 7.7, 11.5, and 39 GeV taken in 2010 by the STAR experiment star . The total events analyzed for the results presented here are about 4 M, 8 M, and 10 M, respectively for = 7.7, 11.5, and 39 GeV. The trigger selection is done by using the Beam Beam Counter (BBC) and the Vertex Position Detector (VPD) vpd . The main subsystem used for particle identification is the Time Projection Chamber (TPC) tpc . The particle identification is enhanced to higher with the inclusion of the full barrel Time Of Flight (TOF) detector tof . The centrality selection is done using the uncorrected charged track multiplicity measured event-wise in the TPC within 0.5. The centrality classes represent the fractions of this multiplicity distribution. The average number of participating nucleons () and collisions () are obtained by comparing the multiplicity distribution with that from Glauber Monte Carlo simulation rhicbes2 . The raw yields are extracted at low using ionization energy loss () from TPC, and using TOF information at higher . The raw spectra are corrected for the detector acceptance and tracking efficiency. These correction factors are obtained together by embedding the tracks simulated using the GEANT model of the STAR detector into real events at the raw data level geant . The results are presented for midrapidity region.
III Results and Discussions
III.1 Transverse Momentum Spectra
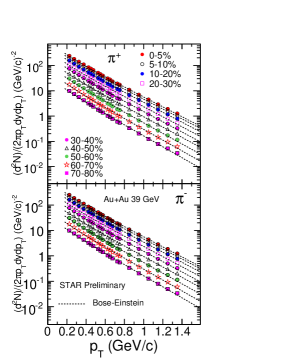
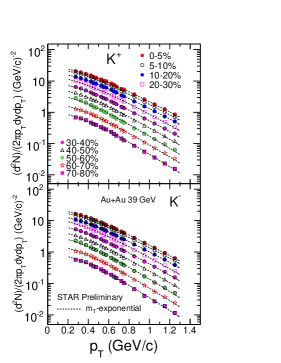
Figure 1 shows invariant yields ) vs. transverse momentum for (left panel) (right panel) and for various collision centralities at midrapidity ( 0.1) in Au+Au collisions at 39 GeV. The curves represent fits to the spectra: pion spectra are fitted with Bose-Einstein function and the kaon spectra with -exponential. The and or values are obtained using the data in the measured ranges and extrapolating using a fit function (Bose-Einstein for and -exponential for ) for the unmeasured ranges. The contribution to the yields from extrapolation to the total yield is about 20-30. The pion spectra presented here are corrected for weak-decay feed-down and muon contamination using STAR HIJING+GEANT, as was done for previous STAR results starpid . The total contribution from weak-decay feed-down and muon contamination is about 17% at low and becomes almost negligible ( 1%) around = 1.4 GeV/.
III.2 Centrality Dependence of Yields and Average Transverse Momentum
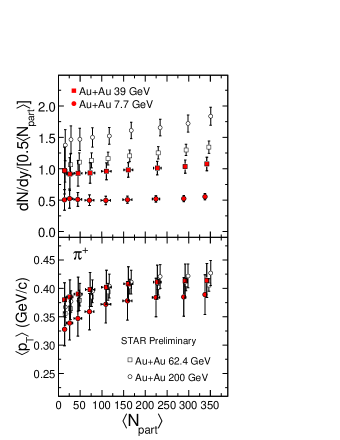
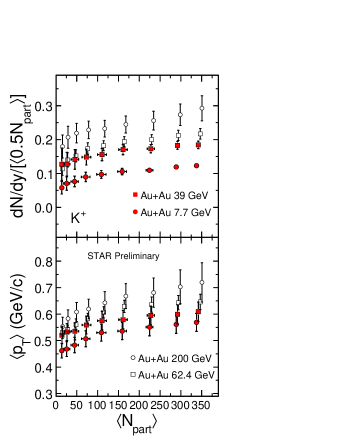
Figure 2 shows the centrality dependence of normalized by number of participating nucleon pairs (top panels) and (bottom panels) for (left) and for (right) in Au+Au collisions at 7.7 and 39 GeV. New measurements from BES data are compared to previously published results at top RHIC energies starpid . The per participating nucleon pair for pions is almost constant as a function of collision centrality at 7.7 GeV, while it increases with for higher energies and for kaons. The increases with collision centrality for both pions and kaons at all energies, indicating that the average collective velocity in the radial direction increases with collision centrality.
III.3 Energy Dependence of Yields and Average Transverse Mass
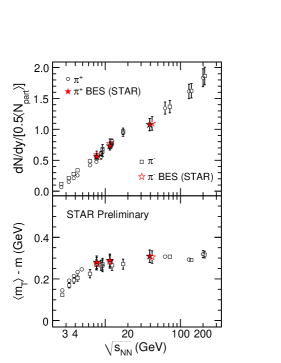
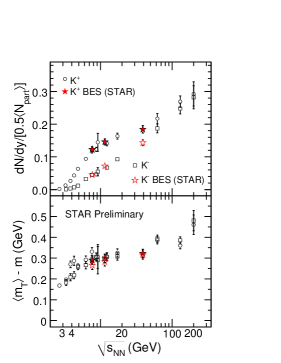
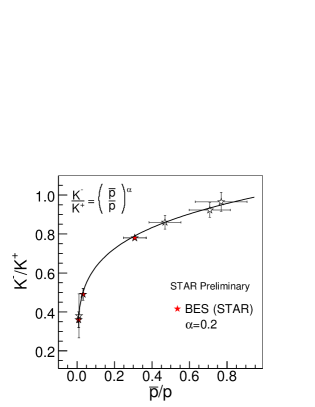
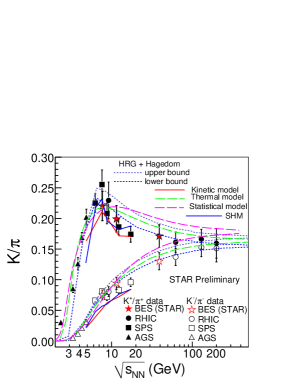
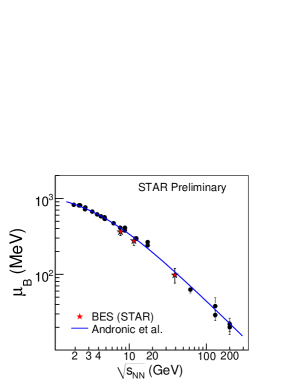
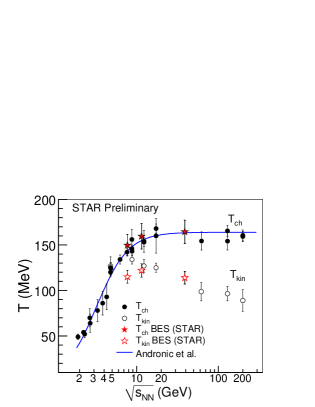
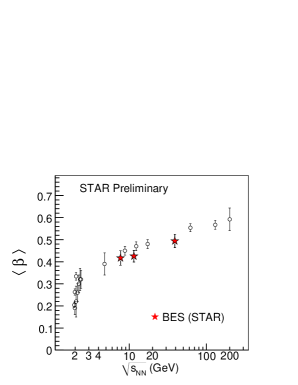
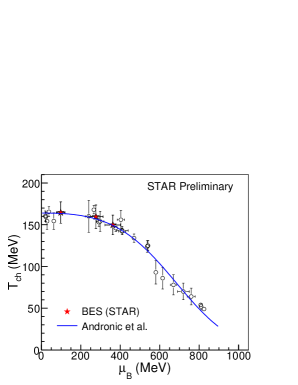
Figure 3 shows the energy dependence of normalized by (top panels) and (bottom panels) as a function of for (left) and for (right). The star symbols represent the data from BES energies and are compared with previous measurements starpid ; sps ; ags . The results are shown for the central collisions and for midrapidity regions. The STAR BES results are consistent with the published beam energy dependence trend. The yields per participating nucleon pair increase with beam energy. The quantity , where and is the hadron mass, increases with beam energy for lower energies, becomes almost constant for the region covered by the BES data and then tends to increase towards the top RHIC energies. This is an interesting observation in a scenario where the system is in a thermodynamic state. In that case, can be related to temperature of the system and may represent entropy. Then this observation could reflect the signature of a first order phase transition as proposed in the Ref. vanhove . However, other interpretations of the observed are possible bedanga .
III.4 Particle Ratios
The particle ratios provide useful information about the collision dynamics as these are fixed after the chemical freeze-out (see Sec. 3.5). Figure 4 (left panel) shows the correlation of ratio with ratio for new measurements from BES energies along with our previously published results starpid . This could give information on how the kaon production is related to the net-baryon density which is reflected by the ratio. The STAR and yields are not feed-down corrected. At lower energies, the kaon production is dominated by the associated production which results in more production compared to . Also the ratio is much less than unity at midrapidity, indicating that there is large baryon stopping at midrapidity at the lower energies. As we go towards higher energies, the pair production mechanism starts to dominate and the ratios tend to become closer to unity. The correlation between (representing net-strange chemical potential, ) and (representing net-baryon chemical potential, ) ratios seem to follow a power law behavior with =0.2 (represented by the curve). In a hadron gas, the relationship between and depends on the temperature. In a particular case of =190 MeV and 500 MeV, these potentials follow the relation kvsp .
Recent theoretical calculations cleyman2 suggest that the maximum net-baryon density at freeze-out is attained at the lowest BES energy of 7.7 GeV. The maximum net-baryon density could also be related to the peak observed in the energy dependence of ratio at around 7-8 GeV, as was observed by the NA49 experiment sps . This is sometimes referred to as the “horn”. The ratio is also important as it could suggest the strangeness enhancement in heavy-ion collisions with respect to the elementary collisions. Figure 4 (right panel) shows the energy dependence of ratio for central collisions at midrapidity. The BES results are shown with star symbols and are compared to results from previous measurements starpid ; sps ; ags . The BES results are in good agreement with the trend of energy dependence established by the published measurements.
Figure 4 (right panel) also shows the predictions of energy dependence of ratio from various theoretical model calculations. The energy dependence of ratio has been interpreted using the Statistical Model of Early Stage (SMES) smes . The model predicts first order phase transition and the existence of mixed phase around beam energy of 7-8 GeV. The SHM or Statistical Hadronization Model shm assumes that the strong interactions saturate the particle production matrix elements. This means that the yield of particles is controlled predominantly by the magnitude of the accessible phase space. The system is in chemical non-equilibrium for 7.6 GeV, while for higher energies, the over-saturation of chemical occupancies is observed. The Statistical Model stat assumes that the ratio of entropy to as a function of collision energy increases for mesons and decreases for baryons. Thus, a rapid change is expected at the crossing of the two curves, as the hadronic gas undergoes a transition from a baryon-dominated to a meson-dominated gas. The transition point is characterized by =140 MeV, = 410 MeV, and =8.2 GeV. In the Thermal Model therm , the energy dependence of is studied by including -meson, which is neglected in most of the models, and many higher mass resonances ( 2 GeV/) into the resonance spectrum employed in the statistical model calculations. The hadronic non-equilibrium Kinetic model kin assumes that the surplus of strange particles is produced in secondary reactions of hadrons generated in nuclear collisions. Then the two important aspects are the available energy density and the lifetime of the fireball. It is suggested that these two aspects combine in such a way to show a sharp peak for the strangeness-to-entropy or ratio as a function of beam energy. In the Hadron Resonance Gas and Hagedorn model (HRG+Hagedorn) hrghag , all hadrons as given in PDG with masses up to 2 GeV are included. The unknown hadron resonances in this model are included through Hagedorn’s formula for the density of states. The model assumes that the strangeness in the baryon sector decays to strange baryons and does not contribute to the kaon production. The energy dependence of ratio seems to be best explained using HRG+Hagedorn model.
III.5 Freeze-out Conditions
The integrated yields of hadrons change only through the inelastic collisions. The point in time when these inelastic collisions stop is called the chemical freeze-out. After this stage, the particle ratios are frozen and the system can be described by the thermal equilibrium model starpid ; chemfo which involves two main parameters and . The and are obtained by fitting the particle ratios with the thermal model. The point in time when the the elastic collisions among the particles cease is called the kinetic freeze-out. The system can be described by the blast-wave (BW) formulation involving two main parameters and average flow velocity () starpid ; bw . The and are obtained by simultaneously fitting the invariant yields for , and with the blast-wave model.
Figure 5 shows the variation of extracted freeze-out parameters for central collisions. Top-left plot shows the energy dependence of baryonic chemical potential. It shows that decreases as the beam energy increases. This is expected since there are fewer net-baryons at midrapidity at higher energies because of less stopping of baryons at midrapidity at higher energies. Top-right plot shows the kinetic freeze-out (open symbols) and chemical freeze-out (solid symbols) temperature plotted vs. . The chemical freeze-out temperature increases with energy and saturates at the higher energies, and kinetic freeze-out temperature decreases with beam energy after 7.7 GeV. Bottom-left plot shows the average flow velocity plotted vs. . The increases with beam energy. Bottom-right plot shows the current picture of the phase diagram ( vs. ). The new measurements from BES program now extend the range covered by the RHIC from 20–400 MeV.
IV Summary
In summary, bulk properties from the RHIC BES program are presented in this paper. The BES data are nicely fitted in the beam energy dependence trend established previously. The yields of identified hadrons increase with beam energy. The is almost constant for the BES energies. The increases with centrality reflecting collectivity increases with centrality. The net-baryon density plays an important role at the lower energies as seen in the energy dependence of ratio, and the correlation between and ratios. The new measurements from the BES program extend the range covered by the RHIC from 20–400 MeV.
Acknowledgements.
We thank the RHIC Operations Group and RCF at BNL, the NERSC Center at LBNL and the Open Science Grid consortium for providing resources and support. This work was supported in part by the Offices of NP and HEP within the U.S. DOE Office of Science, the U.S. NSF, the Sloan Foundation, the DFG cluster of excellence ‘Origin and Structure of the Universe’ of Germany, CNRS/IN2P3, FAPESP CNPq of Brazil, Ministry of Ed. and Sci. of the Russian Federation, NNSFC, CAS, MoST, and MoE of China, GA and MSMT of the Czech Republic, FOM and NWO of the Netherlands, DAE, DST, and CSIR of India, Polish Ministry of Sci. and Higher Ed. Korea Research Foundation, Ministry of Sci. Ed. and Sports of the Rep. Of Croatia, and RosAtom of Russia.References
- (1) STAR Internal Note-SN0493, 2009, arXiv:1007.2613 [nucl-ex].
- (2) B. I. Abelev et al. (STAR Collaboration), Phys. Rev. C 81, 024911 (2010); L. Kumar (STAR Collaboration), Nucl. Phys. A 830, 275C (2009); B. Mohanty, Nucl. Phys. A 830, 899C (2009). L. Kumar (STAR Collaboration), Nucl. Phys. A 862, 125 (2011).
- (3) S. Gupta, X. Luo, B. Mohanty, H. G. Ritter, and N. Xu, Science 332, 1525 (2011).
- (4) Y. Aoki et al., Nature 443, 675 (2006).
- (5) S. Ejiri, Phys. Rev. D 78,074507 (2008); E.S. Bowman and J. I. Kapusta, Phys. Rev. C 79, 015202 (2009).
- (6) A. Laszlo (NA61/SHINE Collaboration), Nucl. Phys. A 830, 559C (2009); C. Hohne (CBM Collaboration), Int. J. Mod. Phys. E 16, 2419 (2007); A. N. Sissakian et al. (NICA Collaboration), J. Phys. G 36, 064069 (2009).
- (7) K. H. Ackermann et al., Nucl. Instr. Methods A 499, 624 (2003).
- (8) W. J. Llope et al., Nucl. Instr. Methods A 522, 252 (2004).
- (9) M. Anderson et al., Nucl. Instr. Methods A 499, 659 (2003).
- (10) W. J. Llope (STAR TOF Group), Nucl. Instr. and Meth. B 241, 306 (2005).
- (11) V. Fine and P. Nevski, in Proceedings of CHEP-2000, Padova, Italy, p. 143.
- (12) B. I. Abelev et al. (STAR Collaboration), Phys. Rev. C 79, 034909 (2009); ibid. Phys. Rev. C 81, 024911 (2010).
- (13) S. V. Afanasiev et al. (NA49 Collaboration), Phys. Rev. C 66, 054902 (2002); C. Alt et al. (NA49 Collaboration), Phys. Rev. C 77, 024903 (2008); ibid. 73, 044910 (2006); T. Anticic et al. (NA49 Collaboration), Phys. Rev. C 69, 024902 (2004).
- (14) L. Ahle et al. (E866 Collaboration and E917 Collaboration), Phys. Lett. B 490, 53 (2000); ibid. 476, 1 (2000); J. L. Klay et al. (E895 Collaboration), Phys. Rev. Lett. 88, 102301 (2002).
- (15) L. Van Hove, Phys. Lett. B 118, 138 (1982).
- (16) B. Mohanty et al., Phys. Rev. C 68, 021901 (2008) and references therein.
- (17) I. G. Bearden et al. (BRAHMS Collaboration), Phys. Rev. Lett. 90, 102301 (2003); J. Cleymans et al. Z. Phys. C 57, 135 (1993).
- (18) J. Cleymans et al., Phys. Rev. C 74, 047901 (2006).
- (19) M. Gaździcki, M. I. Gorenstein, Acta Phys. Pol. B. 30, 2705 (1999).
- (20) I. Kuznetsova et al. J. Phys. G 35, 044011 (2008).
- (21) J. Cleymans et al. Eur. Phys. J. A 29, 119 (2006).
- (22) A. Andronic et al. Phys. Lett. B 673, 142 (2009).
- (23) B. Tomasik et al. Eur. Phys. J. C 49, 115 (2007).
- (24) S. Chatterjee et al. Phys. Rev. C 81, 044907 (2010).
- (25) J. Adams et al. (STAR Collaboration), Nucl. Phys. A 757, 102 (2005); P. Braun-Munzinger et al., Phys. Lett. B 344, 43 (1995).
- (26) E. Schnedermann et al., Phys. Rev. C 48, 2462 (1993).
- (27) A. Andronic et al., Nucl. Phys. A 834, 237 (2010).