A variable mid-infrared synchrotron break associated with the compact jet in GX 339–4
Abstract
Many X-ray binaries remain undetected in the mid-infrared, a regime where emission from their compact jets is likely to dominate. Here, we report the detection of the black hole binary GX 339–4 with the Wide-field Infrared Survey Explorer (WISE) during a very bright, hard accretion state in 2010. Combined with a rich contemporaneous multiwavelength dataset, clear spectral curvature is found in the infrared, associated with the peak flux density expected from the compact jet. An optically-thin slope of –0.7 and a jet radiative power of 61035 erg s-1 are measured. A 24 h WISE light curve shows dramatic variations in mid-infrared spectral slope on timescales at least as short as the satellite orbital period 95 mins. There is also significant change during one pair of observations spaced by only 11 s. These variations imply that the spectral break associated with the transition from self-absorbed to optically-thin jet synchrotron radiation must be varying across the full wavelength range of 3–22 m that WISE is sensitive to, and more. Based on four-band simultaneous mid-infrared detections, the break is constrained to frequencies of 4.61013 Hz in at least two epochs of observation, consistent with a magnetic field 1.5(0.8)104 G assuming a single-zone synchrotron emission region. The observed variability implies that either , or the size of the acceleration zone above the jet base, are being modulated by factors of 10 on relatively-short timescales.
Subject headings:
accretion, accretion disks — black hole physics — stars: individual (GX339-4) — X-rays: binaries1. Introduction
Despite decades of studies on accreting sources, observations of jets in X-ray binaries suffer from important limitations. Strong emission from accreting, stellar or surrounding material dominates fainter jet radiation over infrared–X-ray frequencies in most sources (e.g. Russell et al., 2006). The transient nature of activity in many binaries makes it difficult to catch them contemporaneously with multiple observatories necessary to probe broadband emission and isolate the jet. Moreover, there has so far been a lack of sensitive monitoring instruments in the infrared where the jet flux density is expected to peak (e.g. Markoff et al., 2001).
According to the canonical model of emission from compact jets (Blandford & Königl, 1979), this peak occurs because conservation of particle and magnetic flux leads to each location in the jet being associated with its own photospheric frequency, which falls linearly with distance from the base. The sum of all components conspires to give a flat/inverted spectrum (, where ) up to a peak frequency associated with the optically thick-to-thin break (), above which optically-thin synchrotron radiation () reveals information about the underlying particle distribution. Constraints on this break remain sparse due to the limitations mentioned above (e.g. Fender, 2001; Corbel & Fender, 2002; Gallo et al., 2007; Migliari et al., 2007, 2010; Pe’er & Casella, 2009; Rahoui et al., 2011).
In this Letter, we present the first mid-infrared (MIR) study of GX 339–4, a binary hosting a black hole with mass 6 M⊙ (Hynes et al., 2003), and well-known for its transient, multiwavelength variability on a broad range of timescales (Motch et al., 1982; Dunn et al., 2008; Gandhi, 2009; Casella et al., 2010). Its donor star is a late-type companion in a long (1.7 day) orbit, much fainter than the primary when active (Shahbaz et al., 2001; Muñoz-Darias et al., 2008). GX 339–4 shows evidence of relativistic jets and has proven to be a key object for jet studies across the electromagnetic spectrum (Fender, 2001; Corbel et al., 2003; Markoff et al., 2003; Gandhi et al., 2008).
A MIR detection with Spitzer has been reported, but only in a single filter during a faint, steep-power-law state (Tomsick et al., 2004). We now present multiband simultaneous MIR detections during the source outburst of 2010, which allow important new constraints on , and on changing conditions in the inner jet. A distance of 8 kpc and a black hole mass of 10 M⊙ are taken as representative (Shidatsu et al., 2011). Interstellar line-of-sight extinction of =3.25 is assumed (Lewis et al., in prep.), with dereddening uncertainties described in detail.
2. Observations
2.1. WISE
In the course of an all-sky survey, the Wide-field Infrared Survey Explorer (WISE) satellite (Wright et al., 2010, hereafter W10) detected GX 339–4 on 2010 March 11 (MJD 55266). This fortuitously occurred during a bright, hard state phase before outburst peak in April (e.g. Belloni et al., 2010).
WISE has four arrays (bands W1–W4 centered on wavelengths of 3.4, 4.6, 12 and 22 m, respectively) which image the same 47′47′ field-of-view simultaneously using three dichroic beam splitters. The frame exposure times are 7.7 s for W1–2, and 8.8 s for W3–4, respectively. Consecutive frames are separated by 11 s as the satellite scans across the sky. Though not designed for timing studies, the surveying strategy was such that every source was scanned multiple times over a period of 24 hours, sampling variability on timescales as short as the satellite orbital period. There is a 10% field overlap between adjacent scans, thus sources may be caught on occasion only 11 s apart.
The WISE all-sky survey preliminary data release111http://wise2.ipac.caltech.edu/docs/release/prelim/ reports Vega source magnitudes using both profile-fitting and standard aperture-corrected photometry. Profile-fitting represents the most accurate flux estimation for point sources for single-frame measurements222http://wise2.ipac.caltech.edu/docs/release/prelim/expsup/sec4_3c.htm, because the pipeline can account for image artifacts and source confusion. Some bad pixels are present around GX 339–4 but the field is free of diffraction spikes and detector latency caused by saturated bright sources. The point-spread function (PSF) corresponds to a Gaussian of about 6″.1–6″.5 (W1–W3) and 12″(W4) respectively, imaged at 2.8″/pix (W1–W3) and 5.6″/pix (W4). The two nearest bright stars to GX 339–4 lie 9 and 14″ away, with mean central-pixel count-rates of 0.1 and 1.5 times GX 339–4 in W1 (and a decreasing count-rate towards W4). The pipeline successfully deblends multicomponent emission and reports acceptable values for the photometric fits.
WISE absolute calibration is referenced to a network of standard stars (Cohen et al., 1999), and to sources at the ecliptic poles that are observed on most orbits. GX 339–4 magnitudes are listed in Table 1 for all 13 observing epochs. These were converted to fluxes using standard zeropoints and color corrections (W10) assuming a flat power-law. To account for present pipeline and absolute calibration uncertainties, we include a systematic zero point uncertainty of 2.4, 2.8, 4.5 and 5.7% in W1–W4, respectively (Jarrett et al., 2011). The color correction mainly affects the W3 band, and we also include a 2% uncertainty for this (W10), given the range of MIR spectral slopes discussed later. Improved calibration and reduced systematic errors may be expected after the full WISE data release in 2012.
2.2. Multiwavelength
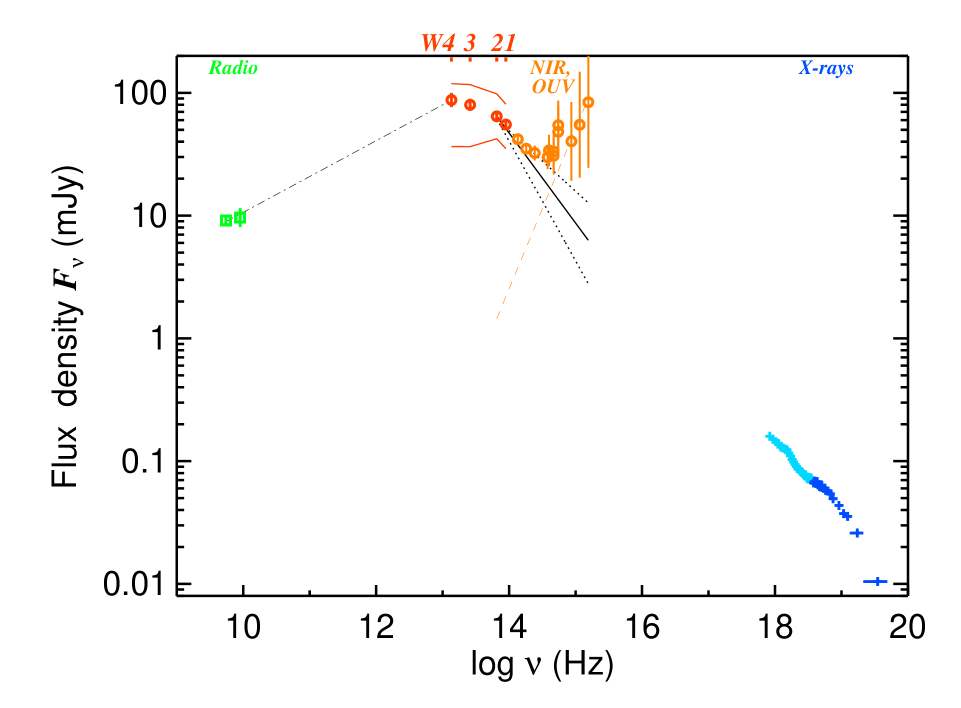
Follow-up data will be presented in a number of upcoming papers, including: 1) Cadolle Bel et al. (2011; hereafter CB11) who describe extensive X-ray, near-IR and optical coverage; 2) Lewis et al. (in prep.) presenting further optical and UV data; and, 3) Corbel et al. (in prep.) discussing the radio. Broadband monochromatic fluxes closest to the WISE observations are listed in Table 2, and plotted in Fig. 1. Where multiple observations were available, averages were used for the mean spectral energy distribution (SED), with the mean error computed as the standard deviation divided by the square-root of the number of exposures.
Below, we present some details on the X-ray analysis, the radio observations, and the UV–to–MIR dereddening, which are specific to our work.
2.2.1 X-rays
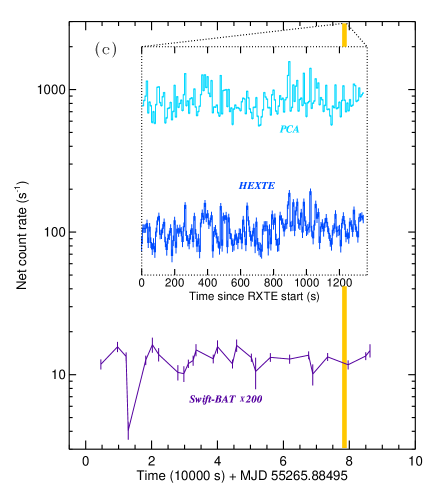
Public X-ray data nearly-simultaneous with WISE from the Rossi X-ray Timing Explorer (RXTE; Bradt et al. 1993) were available for analysis. A short observation (obsid 95409-01-09-03) with goodtime 1360 s was conducted between WISE epochs 12 and 13. For data reduction, we followed standard procedures using HEASOFT v.6.10 and FTOOLS (similarly to Gandhi et al. 2010; hereafter G10).
We find an acceptable fit with a multicolor disk with inner temperature =0.80 keV (90% confidence intervals), an Fe K line with equivalent-width ranging over 70–450 eV, and coronal Comptonization with electron temperature =32 keV and optical depth =1.87 (modelled with comptt; Titarchuk, 1994). The PCA and HEXTE fluxes are found to be =3.70 10-9 and =8.6 10-9 erg s-1 cm-2, respectively, giving a luminosity =1.01038 erg s-1 or 0.08. The bright-state spectrum of GX 339–4 is known to be complex and the exact physical model is irrelevant for the work presented here. The derived luminosity is not overly sensitive to model parametrization. See CB11 for detailed X-ray evolution of the source over the outburst.
For timing analysis, we extracted net light curves from the RXTE event mode data, with 8 s time bins in order to approximately match the WISE exposure times. RXTE data probe variability shorter than 1360 s. For longer timescales, we used Swift Burst Alert Telescope (BAT) 15–50 keV light curves provided by the Hard X-ray Transient Monitor team333http://swift.gsfc.nasa.gov/docs/swift/results/transients/weak/GX339-4. Swift sampling times are non-uniform, with intervals ranging from 10 mins to 1 h.
2.2.2 Radio
The Australia Telescope Compact Array (ATCA) observed GX 339–4 frequently during outburst. Here, we have used the mean fluxes observed on the two closest dates straddling the WISE observation: MJD 55262.91 and 55269.80, with simultaneous observations in the 5.5 and 9 GHz bands. Variations of 25 and 40% are present between the bands. Note that the source does not display extreme radio variability on timescales of days (Corbel et al., 2000). Full details will be in Corbel et al. (in prep.).
2.2.3 Dereddening
The UV–to–near-IR data were dereddened assuming a standard interstellar extinction law with =3.1 (Cardelli et al., 1989). Extinction beyond 3 m, though certainly lower than in the near-IR, remains ill-constrained. We use the mean of three recent extinction laws for the WISE data, with their dispersion serving as a propagated systematic uncertainty on the corrected fluxes: 1) the =5.5 grain model of Draine (2003) which matches the Galactic center extinction of Lutz et al. (1996) below 8 m; 2) the Galactic center extinction curve described by Chiar & Tielens (2006); and 3) that presented by Flaherty et al. (2007). The latter two provide updates on MIR Silicate absorption strengths. Finally, we also include a systematic uncertainty of 0.5 mags (G10).
3. Results
3.1. Broad-band spectrum
GX 339–4 is detected with high significance in all four WISE bands, with average signal:noise of 40–50 in W1–W3 and 22 in W4 across epochs. With mean observed fluxes of 60 mJy in W3 and W4, these detections are amongst the brightest for transient binary systems in the MIR (Wachter, 2008; Vrtilek, 2008), especially when considering the isolated jet component, as we discuss below.
The SED in Fig. 1 shows two peaks. A rising spectrum in the optical/ultraviolet (OUV) may originate either via pre-shock jet synchrotron or accretion disk (re)radiation (cf. G10). Dominant dereddening uncertainty prevents detailed inferences here, but we note that the optical–to–X-ray flux ratio is relatively low at (5500 Å)/0.08 (with a factor of two uncertainty), so disk X-ray irradiation could provide the requisite power.
A second peak is in the MIR, associated with broad spectral curvature declining towards the near-IR and to the radio. We discuss below that this curvature is likely to be emission from the compact jet, with the WISE W1–2 bands preferentially probing optically-thin radiation. Thus fitting a two-power-law model (one for the optically-thin jet and one for the OUV) over the W2–UV frequency range yields a mean optically-thin spectral slope =–0.730.24, and a largely unconstrained OUV slope =1.30.9. Fitting a single optically-thick power-law to the radio–W4 regime yields =0.290.02, though the average SED indicates that a single power-law may be an over-simplification. Errors include systematic uncertainties.
measures the distribution function of jet plasma energies, implying a power-law slope =1–2=2.50.5 (Rybicki & Lightman, 1979). Integrating over the mean radio–near-IR (2 m) SED using piece-wise power-law interpolation gives a lower limit to the jet radiative power () of 61035 erg s-1, assuming that corrections due to relativistic beaming are of order unity (Casella et al., 2010). If the X-ray power () is close to the total jet power (Körding et al. 2006), we may place a lower limit on the jet radiative efficiency, =/1%.
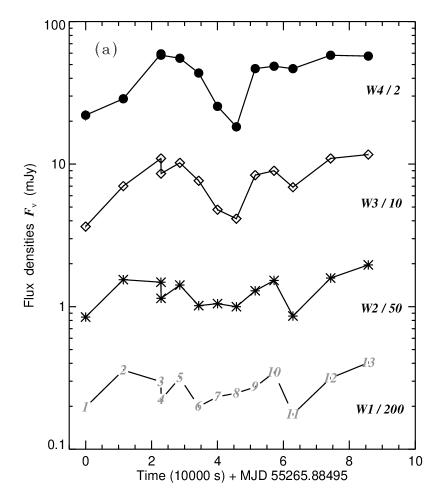
3.2. Variability
Simultaneous four-band WISE light curves in Figure 2 show striking variability typically sampled at (multiples of) the WISE orbital period of 95 mins. The shortest sampling interval was 11 s between epochs 3 and 4, when WISE caught GX 339–4 on two consecutive scans. We extracted light curves of randomly-selected field stars for comparison. For each band, two field stars with brightness similar to GX 339–4 within 5′ were selected. Variations in the target light curves are clearly much stronger than the field star variations and also display inter-band correlations, implying that they are not related to any instrumental or observational artifact.
We measured the fractional variability amplitudes (; Vaughan et al. 2003) of the MIR light curves and found them to increase with wavelength, with 0.250.03 for W1–2 and 0.320.06 for W3–4, respectively (errors allow for WISE pipeline systematics as in § 2.1). The peak-to-peak flux ratios also increase from 2.3–3.3 in W1–4. In X-rays, the Swift data show low mean variability over the timespan of WISE observations, with (Swift)=0.170.02. This value may suffer from large systematics because BAT employs a coded-mask with a wide field-of-view. RXTE is not affected by such complications, and we measure (PCA)=0.210.01 and (HEXTE)=0.200.01 for the full energy ranges of the instruments, and over the range of timescales of 8–1360 s.
4. Discussion
Both the timing and spectral properties strongly favor a jet origin for the mid-infrared emission. The mean optically-thick and thin slopes are fairly typical for binaries in the hard state when the jet is known to be strong. From closely-simultaneous X-ray and MIR light curves, we find when comparing similar timescales. This argues against strong MIR variations originating via reprocessing, because the secondary (driven) variability cannot exceed the primary ones in strength. X-ray variations can also be ruled out as the driver of IR variations in the outer disk because the IR spectral slopes are inconsistent with thermal reprocessing. Dusty circumbinary disks found in some other sources (Rahoui et al., 2010) are unlikely here because of the strong variability (so dust grains should be destroyed by X-rays), and the MIR spectral slopes do not match thermal dust emission.
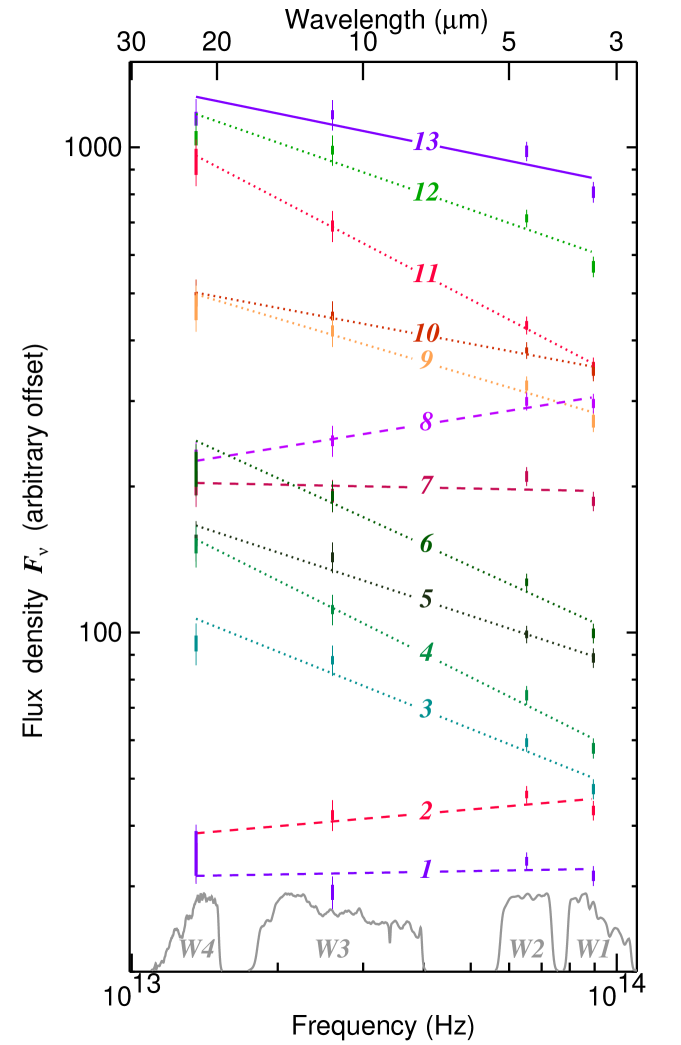
The strong variability implies dramatic changes in spectral slope across the WISE bands in the individual observation epochs. These are displayed in Fig. 3. Parametrizing the spectra with single power-laws results in slopes of –0.5 to +0.2 (Table 1). In several epochs, additional spectral curvature appears to be present within the WISE bands. In particular, in epochs 12 and 13, W1 and W4 fluxes lie below the fit (while W2–3 lie above), returning large single-power-law null-hypothesis rejection probabilities (). From W2 to W1, the slope is negative in most epochs (=–0.480.07), meaning that these bands probe mostly optically-thin emission. Thus carrying out a simple two-power-law fit to describe the W1 & W2 band-pair and the W3 & W4 pair separately, the spectral break associated with this curvature is constrained to be at log(; Hz)=13.650.24 and 13.680.26 in epochs 12 and 13, respectively.
The position of depends strongly on the magnetic field strength () at the acceleration zone in the compact jet, and is comparatively insensitive to luminosity, geometry and energy partition factors. Generalizing the homogeneous cylindrical single-zone emission model of Chaty et al. (2011), we find expressions for and the zone radius as follows.
| (1) | |||||
| (2) | |||||
where =(2+13)-1, is the equipartition fraction of particles to magnetic energy density, is the scale-height of the optically-thin region, is the distance in units of 8 kpc, and =70 mJy. Since depends only weakly on and (we fix both at 1), we have a robust estimate of when can be measured. Both epochs 12 and 13 imply 1.5(0.8)104 G and 2.5(1.5)109 cm, with errors determined from Monte Carlo sampling of all parameters (including also systematic distance uncertainty of 2 kpc).
In addition, the strong MIR slope changes between optically-thick and thin imply that is varying over a range at least as wide as that which WISE is sensitive to. It is likely that uncertainties due to present WISE photometric calibration as well as the ill-constrained dereddening prevent accurate localization of in some other epochs. Setting the WISE systematic errors to zero and repeating the single-power-law fits returns 90% values in additional epochs 1, 2, 3, 6 and 7, consistent with falling within the WISE bandpass in these.
In order to understand the extent of changing jet physical conditions, we compare two extreme WISE epochs: 1) epoch 4, with very bright flux in W4 and a steep slope implying optically-thin emission over the whole WISE range; 2) epoch 8, when the source was faintest in W4 with an inverted slope implying that has shifted to the high frequency end. We assume 1) (epoch 4)=1.31013 Hz and 2) (8)=91013 Hz, corresponding to the extreme WISE frequencies and representing likely upper and lower limits to the true values, respectively. The dereddened fluxes are (4)115 mJy and (8)50 mJy. Comparing and , we find
| (3) |
| (4) |
Modulations by factors of 10 in the field strength or in acceleration zone size are required. The standard scaling of the field along the jet is -1 (Blandford & Königl, 1979) which, if true, is consistent with the variability being dominated by changes in location of the acceleration zone along the jet. These modulations may ultimately originate from stochastic instabilities within the accretion flow, or as a result of changing dissipative shock conditions in the inner jet (e.g., Falcke & Biermann, 1995; Meier et al., 2001; Polko et al., 2010). Multiwavelength monitoring coordinated with the mid-infrared opens up the possibility for studying these processes in the future. The characteristic timescales of change are hours or less (Fig. 2), though variability between epochs 3 and 4 means that some changes are faster than 11 s.
Simultaneous multiband observations over a broad frequency range with WISE have proved crucial for revealing complex and rapid changes occurring near the jet base. Based on the average data in Fig. 1 alone, it would be impossible to accurately localize and to infer changes in its position. Whereas has been found to lie at similar MIR frequencies of (1–4)1013 Hz in 4U 0614+091 and Cyg X-1, observational limitations prevented simultaneous observations straddling the break in the former (Migliari et al., 2010), and the MIR is dominated by non-jet emission in the latter (Rahoui et al., 2011). We have cleanly probed jet-dominant MIR emission simultaneously in multiple bands and shown that inferences from long-term averages are not representative of the underlying behavior in GX 339–4, at least. Thus, time dependence must be incorporated as an integral parameter when modeling compact jets.
Scale-invariant jet models imply that similar break frequency variability could be present in active galactic nuclei, where is expected at mm frequencies (Kellermann & Pauliny-Toth, 1969; Heinz & Sunyaev, 2003). Long-term mm monitoring may have already found signatures for this (Trippe et al., 2011).

| Epoch | MJD | W1§ | W2§ | W3§ | W4§ | # | |
|---|---|---|---|---|---|---|---|
| mag (mJy) | mag (mJy) | mag (mJy) | mag (mJy) | % | |||
| 1 | 55265.8849 | 9.960.03 (39.42) | 9.190.02 (42.32) | 7.570.04 (36.53) | 5.860.11 (44.17) | +0.02 | 82 |
| 2 | 55266.0173 | 9.310.02 (71.73) | 8.540.02 (77.33) | 6.860.03 (70.15) | 5.570.07 (57.57) | +0.09 | 86 |
| 3 | 55266.1496 | 9.510.03 (59.53) | 8.580.02 (74.23) | 6.370.02 (109.68) | 4.790.04 (118.812) | –0.40 | 88 |
| 4 | 55266.1497 | 9.830.03 (44.42) | 8.870.03 (57.23) | 6.640.02 (85.86) | 4.810.04 (116.211) | –0.50 | 66 |
| 5 | 55266.2158 | 9.450.02 (63.33) | 8.630.02 (70.83) | 6.450.03 (102.17) | 4.860.03 (110.611) | –0.33 | 48 |
| 6 | 55266.2820 | 9.950.02 (39.92) | 8.990.02 (50.82) | 6.760.03 (76.56) | 5.120.09 (87.111) | –0.46 | 85 |
| 7 | 55266.3481 | 9.780.02 (46.62) | 8.960.03 (52.52) | 7.270.04 (47.94) | 5.710.06 (50.95) | –0.02 | 82 |
| 8 | 55266.4143 | 9.720.03 (49.42) | 9.010.02 (49.92) | 7.430.03 (41.43) | 6.070.09 (36.55) | +0.16 | 40 |
| 9 | 55266.4804 | 9.610.03 (54.63) | 8.730.03 (64.63) | 6.670.03 (83.76) | 5.050.06 (93.610) | –0.30 | 56 |
| 10 | 55266.5466 | 9.350.02 (69.13) | 8.550.01 (76.33) | 6.590.02 (89.96) | 5.000.04 (97.310) | –0.19 | 25 |
| 11 | 55266.6128 | 10.090.03 (35.12) | 9.180.02 (43.02) | 6.880.03 (68.95) | 5.050.07 (93.510) | –0.52 | 17 |
| 12 | 55266.7451 | 9.450.03 (63.13) | 8.510.02 (79.33) | 6.370.02 (109.68) | 4.810.04 (116.111) | –0.35 | 93 |
| 13 | 55266.8774 | 9.180.03 (80.94) | 8.280.03 (98.15) | 6.300.02 (116.78) | 4.830.04 (114.611) | –0.21 | 93 |
| Band (Telescope or Instrument)a | log Frequency | Mean MJDb | Flux densityc | Reference |
|---|---|---|---|---|
| Hz | mJy | |||
| UVW2 (UVOT) | 15.19 | 55261.05 | 83.8(6.9) | CB11; Lewis et al. (in prep.) |
| UVW1 (UVOT) | 15.06 | 55259.97 | 54.6(3.0) | CB11; Lewis et al. (in prep.) |
| U (UVOT) | 14.94 | 55260.38 | 40.3(0.7) | CB11; Lewis et al. (in prep.) |
| V (FTS) | 14.74 | 55273.72 | 54.5(1.8) | CB11; Lewis et al. (in prep.) |
| R (FTS) | 14.67 | 55273.72 | 33.2(2.1) | CB11; Lewis et al. (in prep.) |
| i’ (FTS) | 14.60 | 55273.72 | 33.9(0.3) | CB11; Lewis et al. (in prep.) |
| V (REM) | 14.74 | 55261.30 | 48.2(1.1) | CB11 |
| R (REM) | 14.67 | 55261.30 | 30.7(0.7) | CB11 |
| I (REM) | 14.58 | 55261.30 | 29.9(0.3) | CB11 |
| J (REM) | 14.39 | 55261.30 | 32.4(0.8) | CB11 |
| H (REM) | 14.26 | 55261.30 | 35.1(0.3) | CB11 |
| K (REM) | 14.13 | 55261.30 | 41.9(0.7) | CB11 |
| W1 (WISE) | 13.95 | 55266.363 | 55.2(3.9) | This work |
| W2 (WISE) | 13.81 | 55266.363 | 64.3(4.6) | This work |
| W3 (WISE) | 13.41 | 55266.363 | 79.9(7.3) | This work |
| W4 (WISE) | 13.13 | 55266.363 | 87.4(8.3) | This work |
| 9 GHz (ATCA) | 9.95 | 55266.4 | 9.7(0.1)1.7 | Corbel et al. (in prep.) |
| 5.5 GHz (ATCA) | 9.74 | 55266.4 | 9.1(0.1)1.0 | Corbel et al. (in prep.) |
References
- Belloni et al. (2010) Belloni, T., Motta, S., & Muñoz-Darias, T. 2010, The Astronomer’s Telegram, 2577, 1
- Blandford & Königl (1979) Blandford, R. D., & Konigl, A. 1979, ApJ, 232, 34
- Bradt et al. (1993) Bradt, H. V., Rothschild, R. E., & Swank, J. H. 1993, A&AS, 97, 355
- Cadolle Bel et al. (2011) Cadolle Bel, M., Rodriguez, J., D’Avanzo, P., Russell, D. M., Tomsick, J., Corbel, S., Lewis, F., Rahoui, F., Buxton, M., Goldoni, P. & Kuulkers E. 2011, A&A, submitted (CB11)
- Cardelli et al. (1989) Cardelli, J. A., Clayton, G. C., & Mathis, J. S. 1989, ApJ, 345, 245
- Casella et al. (2010) Casella, P., Maccarone, T. J., O’Brien, K., Fender, R. P., Russell, D. M., van der Klis, M., Pe’Er, A., Maitra, D., Altamirano, D., Belloni, T., Kanbach, G., Klein-Wolt, M., Mason, E., Soleri, P., Stefanescu, A., Wiersema, K., & Wijnands, R. 2010, MNRAS, 404, L21
- Chaty et al. (2011) Chaty, S., Dubus, G., & Raichoor, A. 2011, A&A, 529, A3+
- Chiar & Tielens (2006) Chiar, J. E., & Tielens, A. G. G. M. 2006, ApJ, 637, 774
- Cohen et al. (1999) Cohen, M., Walker, R. G., Carter, B., Hammersley, P., Kidger, M., & Noguchi, K. 1999, AJ, 117, 1864
- Corbel et al. (2000) Corbel, S., Fender, R. P., Tzioumis, A. K., Nowak, M., McIntyre, V., Durouchoux, P., & Sood, R. 2000, A&A, 359, 251
- Corbel & Fender (2002) Corbel, S., & Fender, R. P. 2002, ApJL, 573, L35
- Corbel et al. (2003) Corbel, S., Nowak, M. A., Fender, R. P., Tzioumis, A. K., & Markoff, S. 2003, A&A, 400, 1007
- Draine (2003) Draine, B. T. 2003, ARA&A, 41, 241
- Dunn et al. (2008) Dunn, R. J. H., Fender, R. P., Körding, E. G., Cabanac, C., & Belloni, T. 2008, MNRAS, 387, 545
- Falcke & Biermann (1995) Falcke, H., & Biermann, P. L. 1995, A&A, 293, 665
- Fender (2001) Fender, R. P. 2001, MNRAS, 322, 31
- Flaherty et al. (2007) Flaherty, K. M., Pipher, J. L., Megeath, S. T., Winston, E. M., Gutermuth, R. A., Muzerolle, J., Allen, L. E., & Fazio, G. G. 2007, ApJ, 663, 1069
- Gallo et al. (2007) Gallo, E., Migliari, S., Markoff, S., Tomsick, J. A., Bailyn, C. D., Berta, S., Fender, R., & Miller-Jones, J. C. A. 2007, ApJ, 670, 600
- Gandhi (2009) Gandhi, P. 2009, ApJL, 697, L167
- Gandhi et al. (2010) Gandhi, P., Dhillon, V. S., Durant, M., Fabian, A. C., Kubota, A., Makishima, K., Malzac, J., Marsh, T. R., Miller, J. M., Shahbaz, T., Spruit, H. C., & Casella, P. 2010, MNRAS, 407, 2166 (G10)
- Gandhi et al. (2008) Gandhi, P., Makishima, K., Durant, M., Fabian, A. C., Dhillon, V. S., Marsh, T. R., Miller, J. M., Shahbaz, T., & Spruit, H. C. 2008, MNRAS, 390, L29
- Heinz & Sunyaev (2003) Heinz, S., & Sunyaev, R. A. 2003, MNRAS, 343, L59
- Hynes et al. (2003) Hynes, R. I., Steeghs, D., Casares, J., Charles, P. A., & O’Brien, K. 2003, ApJL, 583, L95
- Jarrett et al. (2011) Jarrett, T. H., Cohen, M., Masci, F., Wright, E., Stern, D., Benford, D., Blain, A., Carey, S., Cutri, R. M., Eisenhardt, P., Lonsdale, C., Mainzer, A., Marsh, K., Padgett, D., Petty, S., Ressler, M., Skrutskie, M., Stanford, S., Surace, J., Tsai, C. W., Wheelock, S., & Yan, D. L. 2011, ApJ, 735, 112
- Kellermann & Pauliny-Toth (1969) Kellermann, K. I., & Pauliny-Toth, I. I. K. 1969, ApJL, 155, L71+
- Körding et al. (2006) Körding, E. G., Fender, R. P., & Migliari, S. 2006, MNRAS, 369, 1451
- Lutz et al. (1996) Lutz, D., Feuchtgruber, H., Genzel, R., Kunze, D., Rigopoulou, D., Spoon, H. W. W., Wright, C. M., Egami, E., Katterloher, R., Sturm, E., Wieprecht, E., Sternberg, A., Moorwood, A. F. M., & de Graauw, T. 1996, A&A, 315, L269
- Mainzer et al. (2011) Mainzer, A., Bauer, J., Grav, T., Masiero, J., Cutri, R. M., Dailey, J., Eisenhardt, P., McMillan, R. S., Wright, E., Walker, R., Jedicke, R., Spahr, T., Tholen, D., Alles, R., Beck, R., Brandenburg, H., Conrow, T., Evans, T., Fowler, J., Jarrett, T., Marsh, K., Masci, F., McCallon, H., Wheelock, S., Wittman, M., Wyatt, P., DeBaun, E., Elliott, G., Elsbury, D., Gautier, IV, T., Gomillion, S., Leisawitz, D., Maleszewski, C., Micheli, M., & Wilkins, A. 2011, ApJ, 731, 53
- Markoff et al. (2001) Markoff, S., Falcke, H., & Fender, R. 2001, A&A, 372, L25
- Markoff et al. (2003) Markoff, S., Nowak, M., Corbel, S., Fender, R., & Falcke, H. 2003, A&A, 397, 645
- Meier et al. (2001) Meier, D. L., Koide, S., & Uchida, Y. 2001, Science, 291, 84
- Migliari et al. (2007) Migliari, S., Tomsick, J. A., Markoff, S., Kalemci, E., Bailyn, C. D., Buxton, M., Corbel, S., Fender, R. P., & Kaaret, P. 2007, ApJ, 670, 610
- Migliari et al. (2010) Migliari, S., Tomsick, J. A., Miller-Jones, J. C. A., Heinz, S., Hynes, R. I., Fender, R. P., Gallo, E., Jonker, P. G., & Maccarone, T. J. 2010, ApJ, 710, 117
- Motch et al. (1982) Motch, C., Ilovaisky, S. A., & Chevalier, C. 1982, A&A, 109, L1
- Muñoz-Darias et al. (2008) Muñoz-Darias, T., Casares, J., & Martínez-Pais, I. G. 2008, MNRAS, 385, 2205
- Pe’er & Casella (2009) Pe’er, A., & Casella, P. 2009, ApJ, 699, 1919
- Polko et al. (2010) Polko, P., Meier, D. L., & Markoff, S. 2010, ApJ, 723, 1343
- Rahoui et al. (2010) Rahoui, F., Chaty, S., Rodriguez, J., Fuchs, Y., Mirabel, I. F., & Pooley, G. G. 2010, ApJ, 715, 1191
- Rahoui et al. (2011) Rahoui, F., Lee, J. C., Heinz, S., Hines, D. C., Pottschmidt, K., Wilms, J., & Grinberg, V. 2011, ApJ, 736, 63
- Russell et al. (2006) Russell, D. M., Fender, R. P., Hynes, R. I., Brocksopp, C., Homan, J., Jonker, P. G., & Buxton, M. M. 2006, MNRAS, 371, 1334
- Rybicki & Lightman (1979) Rybicki, G. B., & Lightman, A. P. 1979, Radiative processes in astrophysics (New York, Wiley-Interscience, 1979. 393 p.)
- Shahbaz et al. (2001) Shahbaz, T., Fender, R., & Charles, P. A. 2001, A&A, 376, L17
- Shidatsu et al. (2011) Shidatsu, M., Ueda, Y., Tazaki, F., Yoshikawa, T., Nagayama, T., Nagata, T., Oi, N., Yamaoka, K., Takahashi, H., Kubota, A., Cottam, J., Remillard, R., & Negoro, H. 2011, PASJ in press, arXiv:1105.3586
- Titarchuk (1994) Titarchuk, L. 1994, ApJ, 434, 570
- Tomsick et al. (2004) Tomsick, J. A., Bailyn, C. D., Buxton, M. M., Corbel, S., Fender, R. P., Markoff, S., Jimenez-Garate, M., Kaaret, P., & Kalemci, E. 2004, in Bulletin of the American Astronomical Society, Vol. 36, American Astronomical Society Meeting Abstracts, 104.04–+
- Trippe et al. (2011) Trippe, S., Krips, M., Pietu, V., Neri, R., Winters, J. M., Gueth, F., Bremer, M., Salome, P., Moreno, R., Boissier, J., & Fontani, F. 2011, A&A in press, arXiv:1107.5456
- Vaughan et al. (2003) Vaughan, S., Edelson, R., Warwick, R. S., & Uttley, P. 2003, MNRAS, 345, 1271
- Vrtilek (2008) Vrtilek, S. D. 2008, in American Institute of Physics Conference Series, Vol. 1010, A Population Explosion: The Nature & Evolution of X-ray Binaries in Diverse Environments, ed. R. M. Bandyopadhyay, S. Wachter, D. Gelino, & C. R. Gelino, 18–22
- Wachter (2008) Wachter, S. 2008, in American Institute of Physics Conference Series, Vol. 1010, A Population Explosion: The Nature & Evolution of X-ray Binaries in Diverse Environments, ed. R. M. Bandyopadhyay, S. Wachter, D. Gelino, & C. R. Gelino, 210–214
- Wright et al. (2010) Wright, E. L., Eisenhardt, P. R. M., Mainzer, A. K., Ressler, M. E., Cutri, R. M., Jarrett, T., Kirkpatrick, J. D., Padgett, D., McMillan, R. S., Skrutskie, M., Stanford, S. A., Cohen, M., Walker, R. G., Mather, J. C., Leisawitz, D., Gautier, III, T. N., McLean, I., Benford, D., Lonsdale, C. J., Blain, A., Mendez, B., Irace, W. R., Duval, V., Liu, F., Royer, D., Heinrichsen, I., Howard, J., Shannon, M., Kendall, M., Walsh, A. L., Larsen, M., Cardon, J. G., Schick, S., Schwalm, M., Abid, M., Fabinsky, B., Naes, L., & Tsai, C.-W. 2010, AJ, 140, 1868 (W10)