Eruptive Variable Stars and Outflows in Serpens NW
Abstract
We study the outflow activity, photometric variability and morphology of three very young stellar objects in the Serpens NW star forming region: OO Serpentis, EC 37 (V370 Ser) and EC 53 (V371 Ser). High spatial resolution Keck/NIRC2 laser guide star adaptive optics images obtained in 2007 and 2009 in broad-band K and in a narrow-band filter centered on the 1–0 S(1) emission line of H2 allow us to identify the outflows from all three objects. We also present new, seeing-limited data on the photometric evolution of the OO Ser reflection nebula and re-analyze previously published data. We find that OO Ser declined in brightness from its outburst peak in 1995 to about 2003, but that this decline has recently stopped and actually reversed itself in some areas of the reflection nebula. The morphology and proper motions of the shock fronts MHO 2218 near EC 37 suggest that they all originate in EC 37 and that this is an outflow seen nearly along its axis. We identify an H2 jet emerging from the cometary nebula EC 53. The star illuminating EC 53 is periodically variable with a period of 543 days, and has a close-by, non-variable companion at a projected distance of 92 AU. We argue that the periodic variability is the result of accretion instabilities triggered by another very close, not directly observable, binary companion and that EC 53 can be understood in the model of a multiple system developing into a hierarchical configuration.
1 INTRODUCTION
The Serpens star forming region is a compact region of low-mass star formation. At a distance of 311 pc (de Lara, Chavarria-K. & Lopez-Molina, 1991) it is still close enough for detailed, spatially resolved studies of its individual young stellar objects (YSOs) and has therefore attracted considerable attention. The Serpens NW region is part of the Serpens molecular cloud and is the site of much of the most recent star formation activity in this cloud, as indicated by multiple sources of CO outflow and H2 jets (Hodapp et al., 1996a; Herbst, Beckwith, & Robberto, 1997) in an area of less than 0.2 pc in projected diameter. After two decades of monitoring this region in the K band, it is clear that two objects in Serpens NW are particularly noteworthy in the context of establishing the relationship between outflows, accretion instabilities, and multiplicity: Serpens DEOS = OO Ser, and EC 53 = V371 Ser.
The Serpens NW molecular core contains the unique eruptive variable OO Ser discovered by Hodapp et al. (1996a) and originally named the ”Deeply Embedded Outburst Star (DEOS)”. This object has an outburst amplitude similar to the larger and more luminous FU Orionis (FUor)-class of objects and an outburst duration longer than that of EX Lupi (EXor) objects. (See Herbig (1977) for the definition of these object classes.) It is so deeply embedded as to be inaccessible at optical wavelengths and shows an infrared spectrum (Hodapp et al., 1996a; Hodapp, 1999; Kóspál et al., 2007) much more dominated by dust than either of those established classes of young eruptive variables. Based on its association with a bipolar nebula, and its detection at sub-mm and millimeter wavelengths, Hodapp et al. (1996a) have classified this object as Class I in the scheme of Adams, Lada, & Shu (1987). This conclusion was corroborated by Kóspál et al. (2007) who found, on the basis of archival Spitzer data, that OO Ser is the dominant source in Serpens NW at mid-infrared wavelengths. This point was further strengthened by Evans et al. (2009) who observed the Serpens star forming region with Spitzer as part of the ”Clouds to Disks” (C2D) project. Among the sources in Serpens NW classified in their survey, OO Ser has the lowest bolometric temperature (130 K) and highest luminosity (10 ). OO Ser consists of an extended reflection nebula and a more compact central flux maximum. The latter appears slightly extended on our adaptive optics images with a cometary morphology opening to the west and therefore represents the most intense inner parts of the reflection nebula. At near-infrared wavelengths, we probably do not see any direct, unscattered light from the embedded star. We therefore use the variable star designation OO Ser to describe the variable reflection nebula in its entirety.
The variable object V371 Ser, originally named EC 53 in the IR imaging survey of the Serpens molecular cloud by Eiroa & Casali (1992), and the irregularly variable star V370 Ser (EC 37) have also attracted attention. Both these sources are probably among the more evolved YSOs in the Serpens NW region, since they are quite bright at near-infrared wavelengths and do not dominate at mid-IR wavelengths. V371 Ser (EC 53) is a ”cometary” nebula, i.e., one visible lobe of a bipolar structure. Both objects are associated with molecular hydrogen shock fronts indicating ongoing outflow and therefore accretion activity.
One goal of this study was to determine the source of the faint H2 v=1-0 S(1) emission labeled MHO 2218 by Davis et al. (2010) in the area of EC 37 and OO Ser, to determine which of these two objects is the driving source of this shock excited emission. In a complex, dense star-forming region such a Serpens NW, it is not trivial to properly associate H2 shock fronts with their driving sources, yet such proper identification is essential for determining the evolutionary state of the YSOs. Another purpose was to study the bipolar nebula associated with the eruptive variable object OO Ser and the changes it underwent since its last observed eruption in 1995. The cometary nebula EC 53 was fortuitously included in the field of view and the study of this object returned very interesting results.
We have observed the Serpens NW region with the Keck II laser adaptive optics system both in broad band Ks and in H2 line emission on two occasions separated by about two years. The observations are listed in Table 1, described in detail in section 2.1, and the results are discussed in section 3.1. To further investigate the temporal evolution of the light distribution in the OO Ser bipolar nebula, older, seeing-limited data, primarily from the UH 2.2 m telescope, but also recently obtained data from the Infrared Imaging System (IRIS), UKIRT, and the CFHT were analyzed in addition to the Keck data. These observations are described in Section 2.2, are listed in Table 2, and discussed in Sections 3.2 and 3.3.
2 OBSERVATIONS AND DATA REDUCTION
2.1 Keck Adaptive Optics Imaging
The adaptive optics data reported here were obtained at the Keck II telescope, using the laser guide star adaptive optics (LGSAO) system (Wizinowich et al., 2006) in conjunction with the Near-Infrared Camera 2 (NIRC2) camera. The dates, details of the observations, and the achieved FWHM image quality of the final images are summarized in Table 1. In addition to the object images, we took separate sky frames at positions that appeared free of bright stars and extended emission on deep, seeing-limited images taken earlier. The dithered sky frames were also adaptive optics corrected to allow the optimal removal of any faint stars by computing the median of a set of such sky frames. Flatfield correction was done using differential (lights-on minus lights-off) dome flats. The Serpens NW region is a dense nearby molecular cloud and consequently suffers from a lack of available optically visible tip-tilt guide stars. Within the constraints of the Keck LGSAO system, the only available guide star is EC 92 (2MASSJ18295360+0117017) with an R magnitude of 16.6. Even with this tip-tilt guide star, OO Ser can only be reached when using the wide field (40 FOV) mode of NIRC2, and only with a rotator position of 279 to place the tip-tilt star in the extreme corner of the guider field. These circumstances explain the otherwise strange choice of field orientation and object placement in our images. It is obvious that the object placement is less than ideal, with OO Ser in one corner of the field, and EC 53 in the bad quadrant of the NIRC2 detector, where one of the 8 output amplifiers of the Aladdin detector array is not operable and several others shows excess noise. The images were processed using various IRAF routines (see Section 2.2 for a general description of the data reduction procedure) and were astrometrically de-warped using the IDL routines provided by B. Cameron on the NIRC2 website 111http://www2.keck.hawaii.edu/inst/nirc2/forReDoc/post_observing/dewarp/.
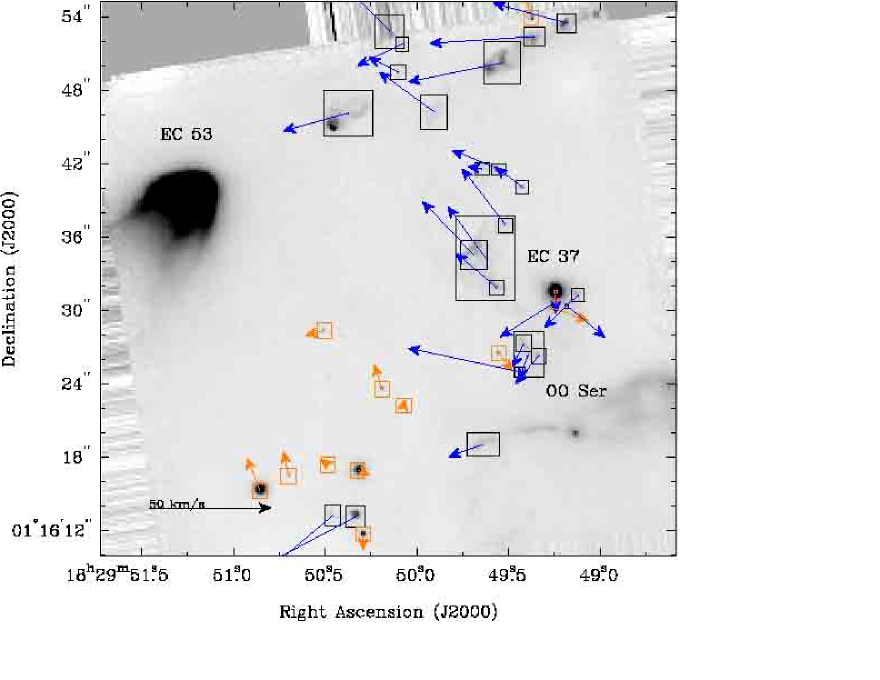
We have obtained proper motion measurements of the various H2 shock fronts from the H2 S(1) narrow-band images obtained in 2007 and 2009, because these images had the best signal-to-noise ratio for the faint shock fronts yet still showed a sufficient number of stars to use as an astrometric reference. By comparison, the K-band images had more S/N on the stars, but the shock fronts were generally too faint to get good astrometric results. Establishing an astrometric reference grid on a small image near the center of a nearby molecular cloud is fraught with difficulties and has to rely on some simplifying assumptions. There are no stars in this image (Fig. 1) that could be confidently identified as distant background stars with negligible proper motion. The few stars in the image could possibly be highly reddened background stars, but they could also be faint, partly embedded young stars within the Serpens NW star-forming region. The best that can be done in this situation is to use all available stars as an astrometric reference. The images at the two epochs were astrometrically matched using the IRAF tasks geomap and geotran. Since the images had already been de-warped, we restricted the geomap solution to linear terms, to avoid instabilities due to the small number of reference stars. Proper motions were then measured using the IRAF task xregister that computes the cross-correlation between the images at the two epochs in a sub-image containing a feature (star or shock front) of interest.
We summarize our proper motion measurements in Fig. 1, where the measurements of stars are represented by amber (light grey) arrows, while those of H2 shock fronts are indicated by blue (dark grey) arrows. All the stars have small residual proper motions against the reference system established by the ensemble of these same stars, and these proper motion vectors represent the combined error of the individual proper motion measurements and the uncertainty of the astrometric reference system defined by that ensemble of stars, as well as possibly genuine individual proper motion.
2.2 Photometric Monitoring
The study of the temporal evolution of the reflection nebula associated with OO Ser and the variability of EC 53 made use of older observations obtained at the UH 2.2 m telescope with the QUIRC camera (Hodapp et al., 1996b) that had already been published in the earlier papers on the discovery of OO Ser (Hodapp et al., 1996a) and the initial study of the OO Ser and EC 53 light curves (Hodapp, 1999). To these light curves, we have now added newer QUIRC data obtained up to 2004 when that camera was decommissioned, data obtained at the UH 2.2 m telescope with the SIRIUS camera (Nakajima et al., 2002) in 2000, as well as data obtained at UKIRT with WFCAM in 2008 and at CFHT with WIRCAM in 2011. We have also included new data from the recently commissioned 0.8 m Infra-Red Imaging Survey (IRIS) telescope described by Hodapp et al. (2010). Finally, we have used the oldest available near-infrared image of the Serpens NW region that we had obtained on 1991, Aug. 5 with the UH NICMOS-3 camera (Hodapp, Rayner, & Irwin, 1992) at the UH 2.2 m telescope in the K′ filter (Wainscoat & Cowie, 1992). We used the same photometric apertures as for the other data sets and the same reference stars. The correction between K′ and K was determined from near-simultaneous images obtained in those two filters during the outburst of OO Ser in 1995. The lowest spatial resolution data, the 1991 UH NICMOS3 camera image and the 2010 IRIS 0.8 m telescope data, were not used for the sub-regions in the reflection nebula. The seeing-limited observations are listed in Table 2.
For the study of the photometric behavior of individual knots of nebulosity within the OO Ser bipolar nebula, we have also included the two Keck K-band images (Table 1), after scaling them to the common astrometric solution of the seeing-limited images. The Keck images could not be used to measure the integral brightness of the reflection nebula, because their field of view did not contain the integration box for the integral brightness completely.
The images were flatfield corrected using differential dome flats, bad pixel masks were derived from the dome flats. The dithered object images were median combined into sky frames and subtracted from the flatfielded images. The resulting images were aligned and co-added while eliminating bad pixels in the process. After this standard data reduction, these seeing-limited images were transformed to a common astrometric solution using the IRAF tasks geomap and geotran. The available data were diverse in the total exposure time achieved, prevailing seeing, and photometric quality of the nights. For most, separate standard star observations were not available. Therefore, the photometric calibration relied on an ensemble of field stars. Of these field stars, we selected the four stars that showed the smallest scatter of the photometric measurements in the 1994 to 1998 time interval as secondary standards and calibrated them against brighter stars in the 2MASS catalog (Skrutskie et al., 2006). Obviously, our procedure makes the assumption that these selected stars were constant throughout the two decades for which photometry is being discussed here. We have not tried to correct for color terms between the Ks filter of 2MASS (Cohen, Wheaton, & Megeath, 2003), the classical (Johnson, 1966) K, and the Mauna-Kea-standard K (Tokunaga, Simons, & Vacca, 2002) filters used in the UH QUIRC camera and the other cameras occasionally used, because such effects are much smaller than the variability amplitudes discussed here. To avoid problems caused by the ubiquitous extended emission, photometry on rectangular sub regions of the bipolar nebula associated with OO Ser were obtained with the IRAF task imstat. The sky background was separately measured in similar rectangular regions selected to be unaffected by stars or extended flux.
In a diverse data set combining data taken with different telescopes and cameras, different exposure times and under varying conditions, the internal error of a photometric measurement underestimates the uncertainty of the result. In our case, for the higher quality data obtained with QUIRC at the UH 2.2 m telescope, internal errors are only of the order of Jy. For the UH 2.2 m telescope QUIRC and SIRIUS data, the rms scatter of the individual secondary standard star flux values over time is Jy. The IRIS 0.8 m telescope data have higher rms scatter of Jy, due to poorer sampling and smaller signal-to-noise ratio. With these total errors, the variations in the light curve for different regions of the OO Ser reflection nebula are highly significant.
3 Results and Discussion
3.1 Proper Motion of H2 Shock Fronts Near EC 37 = V370 Ser
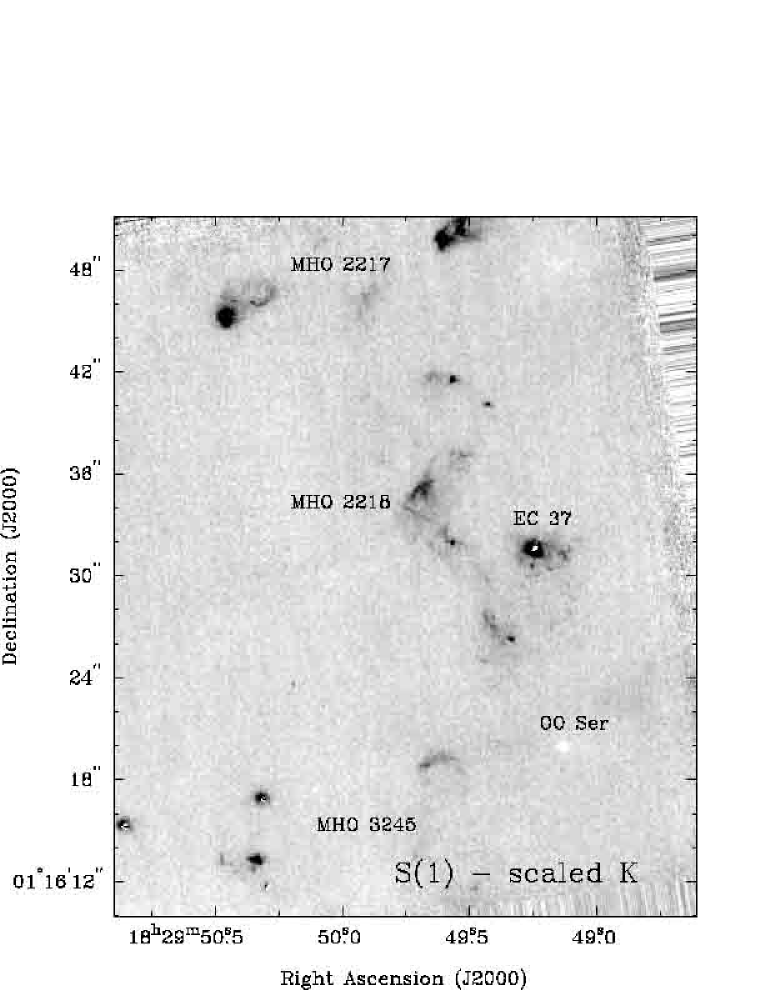
Figure 1 shows the proper motion vectors measured from the Keck NIRC2 H2 S(1) adaptive optics images taken in 2007 and 2009. For many of the clearly defined bow shock systems, these results essentially confirm the earlier results by Hodapp (1999) that were based on seeing-limited images over a 4 year interval. The new data with their superb spatial resolution and depth enable, for the first time, a study of the much fainter emission in the general area of EC 37, which is listed as MHO2218 in the catalog of H2 shock fronts by Davis et al. (2010) 222The catalog is available at http://www.jach.hawaii.edu/UKIRT/MHCat. Figure 2 is a version of the 2009 Keck AO image where an intensity-scaled version of the K image was subtracted, to best bring out the H2 shock fronts by subtracting out the continuum sources.
The young stellar object EC 37 has an average H-K 3.6 from the photometry reported by Hodapp et al. (1996a), making it one of the reddest of the point sources in the catalog of Serpens infrared sources by Eiroa & Casali (1992). As already shown by Hodapp (1999) it exhibits the irregular variability characteristics of T Tauri stars (Joy, 1945). In addition, it coincides with a small unresolved knot of 3 mm emission at flux level 3.6 mJy in the map of Testi & Sargent (1998), indicating the presence of substantial amounts of cold dust around the star, and therefore a young age of the object. On the adaptive optics H2 1–0 S(1) images, individual knots of emission are visible in the immediate vicinity of EC 37, primarily to the south of the star, in addition to more smoothly distributed flux. Very faint, knotty emission can be seen up to about 5 to the south of EC 37. Outside of this area, the brightest H2 shocks are found to the east and north of EC 37.
The large system of H2 S(1) shock fronts near EC 37 (MHO 2218) shows a pattern of proper motion vectors that can best be understood as an outflow emerging from EC 37. The emission knots east of EC 37 were already imaged and their proper motion measured by Hodapp (1999). For those brighter knots, the older measurements agree very well with the new adaptive-optics-based proper motion vectors. In addition, fainter emission knots to the south-east of EC 37 could now be measured that show unambiguously that those knots move away from EC 37 and not from OO Ser, which is located even further south. A few of the small emission knots in the immediate vicinity of the unresolved star EC 37 also have measured proper motion now, showing a pattern of motion radially away from the star.
This system of emission knots near EC 37 is clearly not seen in an orientation close to the edge-on orientation that is favorable for seeing the full extent of a jet. The comparatively low extinction towards the central star that makes it directly visible at near-infrared wavelengths, the fact that H2 S(1) emission knots are seen all around EC 37, and the complex pattern of proper motion vectors all support the notion that this outflow is seen nearly along the direction of its axis. This is also supported by the general lack of morphological features that would be indicative of an edge-on orientation, such as a cometary or bipolar morphology. In Serpens NW, both EC 53 and OO Ser are examples of the latter morphology.
3.2 OO Ser
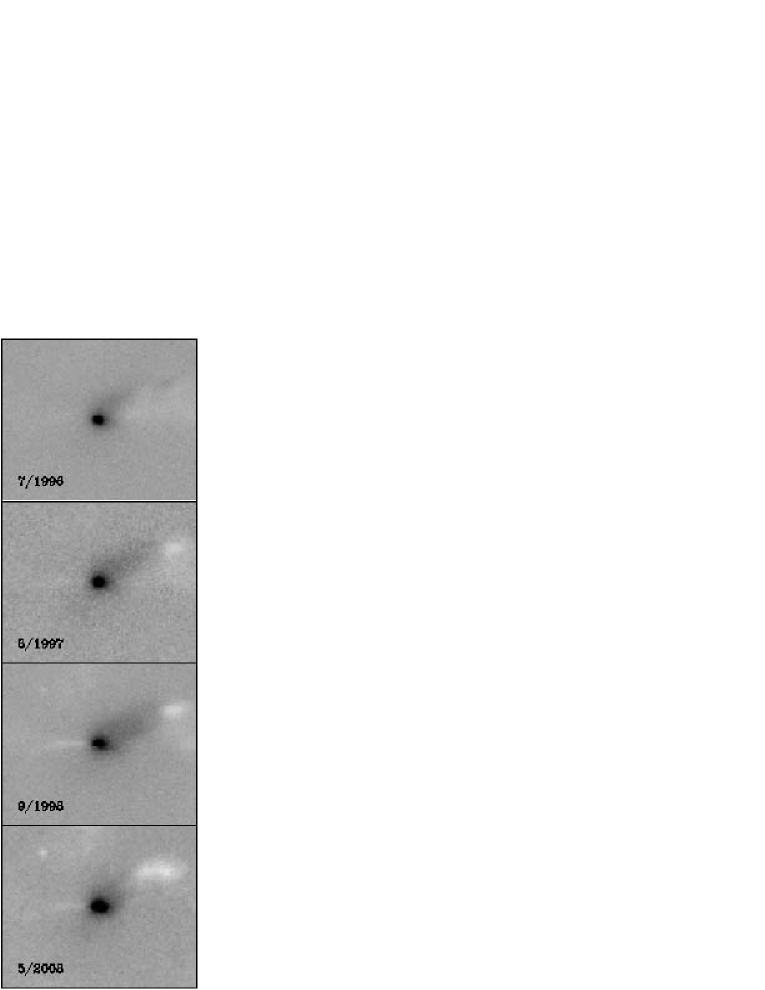
The deeply embedded eruptive variable source OO Ser shows nebulosity of bipolar morphology, with the western lobe being brighter than the eastern. At the spatial resolution of our adaptive optics co-added images of 100 mas FWHM (see Table 1), the object at the center of the bipolar nebula (in the south-western corner of Fig. 1) appears slightly extended and elongated with the shape of a cometary nebula opening to the west. Even on these deep adaptive optics images, we are not seeing direct light from the central star of the OO Ser reflection nebula. The whole reflection nebula brightened after the outburst of the central object in 1995. However, the changes in brightness were not spatially uniform. Motivated by these tentative findings, we have re-analyzed older, seeing-limited images from the time of maximum brightness in 1995 to images taken in 2008. The images were spatially registered to the image taken near maximum brightness in July of 1995 using the IRAF tasks geomap and geotran. After adjusting the sky background to zero and after scaling of the images by the integrated flux of the reflection nebula to account for the varying average brightness of the extended object, difference images were computed. These are shown in Fig. 3 and illustrate that the bipolar nebula did not change its brightness spatially uniformly. In Fig. 3, a faster than average decline in brightness is represented by dark tone while areas declining more slowly appear bright. Temporal variations in the flux distribution of reflection nebulae are not a new phenomenon. For example, the case of R Mon has been studied as early as Hubble (1916). Examples observed in the near-infrared include Cep A (Hodapp & Bressert, 2009) and L483 (Connelley, Hodapp, & Fuller, 2009). The interesting aspect of these variations is that they point to significant variations of the extinction in the optical path of the scattered light on time scales of a few years, making the spatial scales of the obscuring dust comparable to those of our own Solar System.
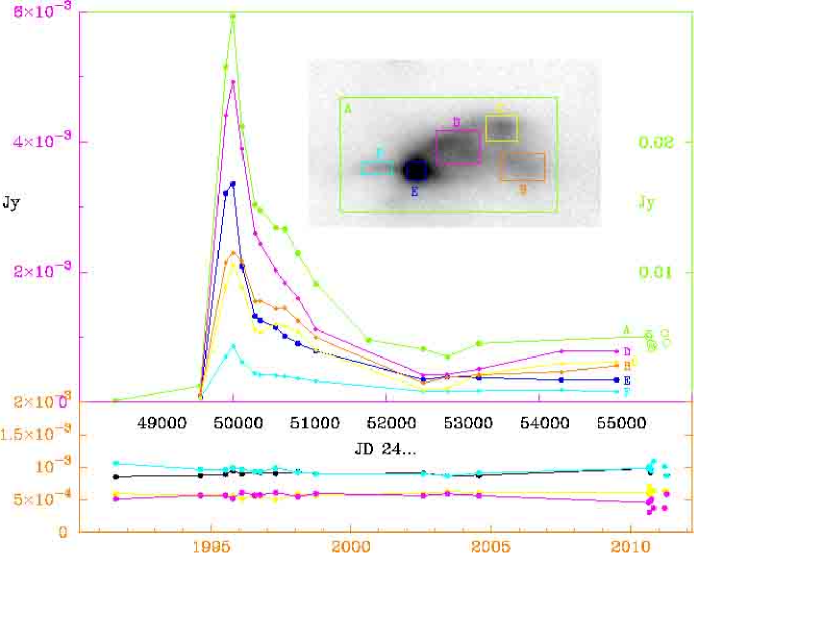
We have also extracted photometry of the OO Ser nebula and its central extended source on the available seeing limited images, as described in section 2.2. Figure 4 shows the resulting light curves and illustrates the location of the rectangular extraction apertures used. In Fig. 4, the total brightness of the full OO Ser reflection nebula, i.e., the largest extraction aperture, is plotted on a different flux scale than the smaller sub-apertures. It is clear from Fig. 4 that the overall brightness of the nebula reached a relative minimum in 2002 or 2003, and has been slowly rising again after that time, albeit with substantial local variations. This result was already indicated by two independent Ks-band photometric data points obtained in 2004 and 2006 by Kóspál et al. (2007) (their Fig. 4).
Up to now, the earliest published photometric data point in the OO Ser light curve had been the 1994 QUIRC image shown in Hodapp et al. (1996a). We have now re-analyzed the oldest sufficiently deep image of OO Ser available to us. This 1991 image obtained at the UH 2.2m telescope with the UH NICMOS3 camera data gives a 5 detection of the integrated flux of the OO Ser nebula in pre-outburst condition of K=16.8. This photometric value is about 2.5 magnitudes fainter than the value of K=14.3 mag for the integrated flux measured in the same aperture on the 1994 QUIRC image. This demonstrates that by the time of the 1994 observations, the brightening process had already been under way. We have also double-checked this result qualitatively by the artificial data experiment of adding an appropriately intensity-scaled and smoothed version of an image of OO Ser in its bright state to the 1991 image. This experiment showed that OO Ser would have been easily visible in the 1991 image had it been at the same brightness as in 1994. Overall, this clearly shows that a significant brightening of OO Ser began before 1994 and maybe as early as 1991.
Our images in the 1–0 S(1) line of H2 show shock excited emission in the eastern lobe of the OO Ser bipolar nebula. A thin arc of emission appears to outline the edge of the eastern outflow cavity of OO Ser in our H 1-0 S(1) narrow-band image in Fig. 1. The continuum-subtracted H image in Fig. 2 shows that this arc ends in a shock front dominated by line emission. Still further to the east, several individual shock fronts are visible whose proper motion (Fig. 1) traces them back to OO Ser. This proves that OO Ser is an accreting source in the early evolutionary state that is characterized by shock-excited H2 emission. The H2 shock fronts associated with OO Ser have now been listed as MHO 3245 in the catalog of molecular hydrogen shock fronts by Davis et al. (2010).
The variable reflection nebulosity extends to the west up to the apparent edge of the dense molecular cloud, as judged from the density of background stars. To the east, the variable reflection nebulosity extends a little beyond the fine line of S(1) emission just discussed, but is, overall, much less extended than the reflection nebulosity in the western direction. This morphology strongly suggests that the western lobe, i.e., the brighter reflection nebula, is slightly oriented towards the observer, while the eastern lobe with the H2 shock fronts points away from the observer and into denser parts of the Serpens NW molecular cloud so that reflection nebulosity becomes un-observable.
3.3 EC 53 = V371 Ser
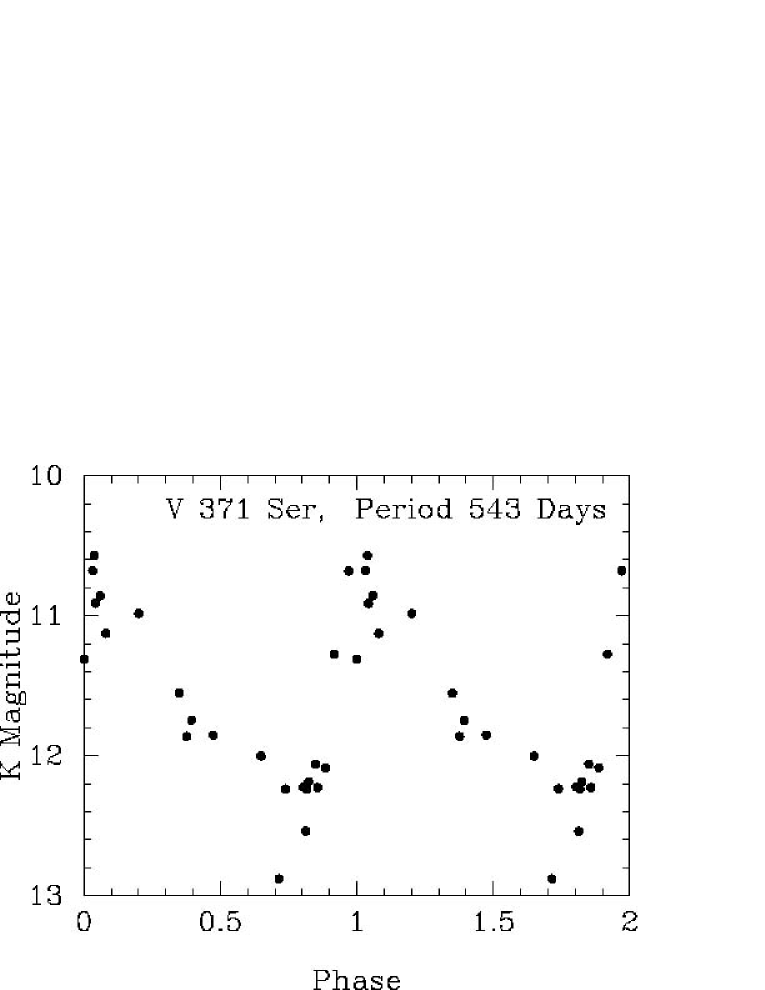
The cometary nebula EC 53 shows many of the characteristics of a Class I young star seen in a nearly edge-on orientation of its accretion disk. This object has been found by Hodapp (1999) to be variable, with strong indication of periodicity. We used the Period Analysis Software (Peranso) package written by T. Vanmunster, and several of the algorithms implemented there for a period analysis of all our seeing-limited observations of V371 Ser in the past 20 years. The dominant period found by all algorithms is 543 days, close to the period initially reported in Hodapp (1999). All the observations are plotted in a phase diagram with the 543 day period solution and shown in Fig. 5. Additional observations are scheduled with the IRIS system to better define the shape of the light curve.
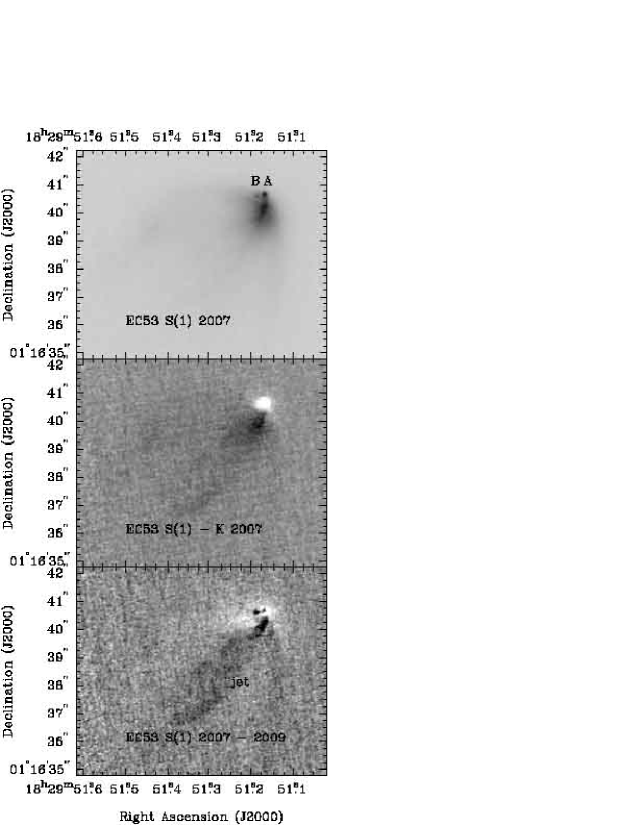
Our K-band adaptive optics images taken with Keck/NIRC2 show this object in two very different phases of its light curve. In 2007, the object was near minimum while in 2009, it was near maximum brightness. The top panel of Fig. 6 shows the S(1) narrow-band image in 2007, near minimum brightness. The middle panel is a difference image of the S(1) line image minus a scaled K broad-band image, to bring out the H2 jet near the center of the reflection nebula. The bottom panel is a scaled difference image of the 2007 - 2009 data, showing the regions varying in phase with the illuminating source in bright tones, while constant (or un-phased) regions are shown in dark tone. The effectively constant parts of the image include the companion object (EC 53 B), and the line emission of the H2 jet. Further along the axis of this jet, outside of the field of our images presented here, a terminal shock front was first identified by Herbst, Beckwith, & Robberto (1997) as their object S11, and is included in the MHO catalog by Davis et al. (2010) as MHO 2221. In the 2007 images, both in broadband K and in the narrow S(1) filter, it is clearly seen that that the central star in EC 53 is a binary. The brighter component of this binary system (EC 53 A) is the variable. In its brighter state, which was observed in 2009, it so dominates the total flux that it makes the detection of the companion star (EC 53 B) very difficult. A similar study of the uniformity of brightness changes to that done on OO Ser was done, but essentially resulted in the detection of the nearly constant S(1) line emission component of the extended flux. Apart from this, the change in brightness appeared uniform throughout the reflection nebula.
EC 53 must be a physical binary. The companion star is located at a projected distance of 296 mas (92 AU) from the brighter component and has an apparent magnitude of K=19.0. The nearest field star to EC 53 detected in our images is 14 away. With such a low density of unrelated stars, the probability that a 0.3 companion is a chance alignment is 1/2000. From the AV measurement of Eiroa & Casali (1992), and with the extinction law of Rieke & Lebofsky (1985), this gives an absolute K-magnitude of 9.75 for the companion. The extinction value is based on the near-infrared color excess relative to normal stars of the integrated light of the EC 53 nebula. The extinction towards the companion star may be significantly different, so the following discussion should be taken with some caution.
The Baraffe COND03 models (Baraffe et al., 2003) for a 1 Myr star (the earliest models) give MK = 9.73 for a 0.005 object, while the DUSTY models give a mass between 0.004 and 0.005. The age of EC 53 is not well determined, but based on its association with strong ”cometary” nebulosity and a molecular hydrogen jet, and the age of its immediate neighbors in Serpens NW, it is probably younger than 1 Myr. The uncertainties of the evolutionary models are substantial, in particular at the very youngest ages, as pointed out by Baraffe et al. (2002). We therefore take this mass as a very rough estimate and conclude that the companion must be a future sub-stellar object, quite likely of planetary mass. At a projected distance of 92 AU, this low-mass companion is too far away from the main star to have been formed by core accretion (Marley et al., 2007) at its present distance. Also, less than 1 Myr is not enough time to form giant planets by this mechanism. We therefore assume that the companion has formed at the same time as the main component by disk or core fragmentation.
In their study of optical photometry of T Tauri stars, Herbst, Herbst & Grossman (1994) list three main causes for variability in these stars: rotational modulation of dark star spots, modulation of bright accretion hot spots, and variable extinction due to eclipses by disks. While variability is common in young stars, periodicity is mostly observed on the timescale of days to a few weeks associated with stellar rotation. For example, Carpenter, Hillenbrand, & Skrutskie (2001) and Herbst et al. (2002) have studied variability in the Orion Nebula at infrared and optical wavelengths, respectively. While a large fraction of stars in their respective samples showed variability, the most common type of variability was rotationally modulated variations of spotted T Tauri stars with typical periods of order of several days to about a week, and small peak-to-peak amplitudes of a fraction of a magnitude. The short time-span of most variability monitoring campaigns biases the results against finding long-period variables. Even after considering this bias, longer period periodic variations in young stars appear to be very rare. One example of longer period variability is WL4 in Oph, discovered by Plavchan et al. (2008) in the 2MASS Calibration Point Source Working Database. This star has a 0.4 mag amplitude in Ks and a period of 130.87 days caused by eclipses of each of two binary components by a circum-binary disk. For WL4, Plavchan et al. (2008) specifically argue against a periodically driven accretion model for this star. On the other hand, Mathieu et al. (1997) interpreted the photometric variations of DQ Tau (period 15.80 days) as evidence for ”variable accretion regulated by the binary orbit”. Such variable accretion was also postulated by Bouvier et al. (2003) as part of the explanation of the variations (period 8.2 days) observed in AA Tau. Among all the YSOs with established light curves, the long period, substantial amplitude and association with ongoing accretion makes EC 53 = V371 Ser quite a unique object.
Given that EC 53 is an outflow source, we expect that most of its luminosity is derived from accretion luminosity, and not from a, possibly pulsating, stellar atmosphere. We therefore believe that the most likely explanation for the periodic variations of EC 53 are periodic variations in the disk accretion rate, modulated by the presence of a close companion star on an eccentric orbit. This mechanism has been discussed in detail by Reipurth (2000) as an explanation for FUor outbursts and for giant, well-collimated outflows. In this scenario, an originally non-hierarchical multiple system evolves into a hierarchical system of a tightly bound pair and a third component at a much larger distance that may ultimately become unbound. This model has recently been substantiated by detailed orbital simulation by Reipurth et al. (2010). In a tight binary system, the main reservoir of material available for accretion lies outside of the binary orbit, explaining the long-wavelength spectral energy distribution peak for young accreting binaries. It has been shown by Artymowicz & Lubow (1996) that streams of material can flow through the binary orbits into the immediate vicinity of either of the two close binary components, from where they can be accreted onto the stars by magnetospheric accretion. These models have been detailed out by recent numerical simulations by de Val-Borro et al. (2011). Even though the relationship between binary orbit and accretion streams is not trivial, the model calculations show that in eccentric orbits, the arrival of the accretion streams at the star roughly coincides with the periastron phase of the binary orbit. In our case of EC 53, the observed companion (EC 53 B) at 296 mas projected separation is the distant third component, while the two components responsible for the 543 day period of light variation form the closely bound system EC 53 A. The formation of a tightly bound binary may lead to the release of the third component of the original non-hierarchical system, in the case of EC 53 a free-floating object of maybe only planetary mass.
So far, no repetitive FUor events have been found. Some of the smaller EXor outbursts have been found to be repetitive, for example the prototypical EX Lupi (Aspin et al., 2010) or V1647 Ori (Aspin et al., 2006), but there are no cases with a clearly established periodicity. EC 53 may therefore represent the short-period extension of the FUor and EXor phenomenon.
4 CONCLUSIONS
We have presented the results of Keck/NIRC2 laser adaptive optics imaging of three young, accreting objects in the Serpens NW region.
Much of the shock-excited H2 emission between the eruptive variable OO Ser and the irregular variable EC 37 = V370 Ser originates in the latter. The proper motion pattern and the relatively low extinction to this object suggest that the line of sight towards this object is closely aligned with the outflow axis.
We have identified small patches of H2 emission east of OO Ser, associated with the bipolar nebula centered on this deeply embedded outburst star. These shock fronts demonstrate that OO Ser has ongoing outflow activity and is therefore still accreting mass. Based on images spread over many years, we show variations in the light distribution of the western lobe of the OO Ser bipolar nebula that are similar to other cases of ”shadow play” in young reflection nebulae, indicative of spatially and temporarily variable extinction near the star in the line of sight of the reflected light. After the 1995 outburst of OO Ser, both the central source and the integrated light of the surrounding bipolar reflection nebula faded until about 2003. After this time, the overall decline has stopped. Within the range of the spatial variations in brightness distribution observed before, some areas of the reflection nebula have brightened, while others have continued to fade.
The variable cometary nebula EC 53 = V371 Ser has an H2 jet, indicating ongoing outflow activity. The earlier suggestion that the brightness variations of this object are periodic has been confirmed by many additional observations and a period of 543 d is now well established. V371 Ser has a faint, non-variable companion at a projected distance of 92 AU that is probably a very low mass future brown dwarf or even an object of only planetary mass. The variable cometary nebula EC 53 is being interpreted in the framework of the Reipurth (2000) model whereby the ejection of a third component from a previously non-hierarchical system leads to the formation of a tight binary on an initially eccentric orbit that then imposes its orbital period on the on-going disk accretion, leading to a periodicity in the accretion luminosity.
References
- Adams, Lada, & Shu (1987) Adams, F. C., Lada, C. J., & Shu, F. H. 1987, ApJ, 312, 788
- Artymowicz & Lubow (1996) Artymowicz, P. & Lubow, S. H. 1996, ApJ, 467, L77
- Aspin et al. (2006) Aspin, C., Barbieri, C., Boschi, F., Di Mille, F., Rampazzi, F, Reipurth, B, & Tsvetkov, M. 2006, A&A, 132, 1298
- Aspin et al. (2010) Aspin, C., Reipurth, B., Herczeg, G. J., Capak, P. 2010, ApJ, 719, 50
- Baraffe et al. (2003) Baraffe, I., Chabrier, G., Barman, T. S., Allard, F., & Hauschildt, P. H. 2003, A&A, 402, 701
- Baraffe et al. (2002) Baraffe, I., Chabrier, G., Allard, F., & Hauschildt, P. H. 2002, A&A, 382, 563
- Bouvier et al. (2003) Bouvier, J., Grankin, K. N., Alencar, S. H. P., Dougados, C., Fernandez, M., Basri, G., Batalha, C., E. Guenther, Ibrahimov, M. A., Magakian, T. Y., Melnikov, S. Y., Petrov, P. P., Rud, M. V., & Zapatero Osorio 2003, A&A, 409, 169
- Carpenter, Hillenbrand, & Skrutskie (2001) Carpenter, J. M., Hillenbrand, L. A., & Skrutskie, M. F. 2001, AJ, 121, 3160
- Cohen, Wheaton, & Megeath (2003) Cohen, M., Wheaton, Wm. A., & Megeath, S. T. 2003, AJ, 126, 1090
- Connelley, Hodapp, & Fuller (2009) Connelley, M. S., Hodapp, K. W., & Fuller, G. A. 2009, AJ, 237, 3494
- Davis et al. (2010) Davis, C. J., Gell, R., Khanzadyan, T., Smith, M. D., & Jenness, T. 2010, A&A, 511, 24
- de Lara, Chavarria-K. & Lopez-Molina (1991) de Lara, E., Chavarria-K., C., & Lopez-Molina, G. 1991, A&A, 243, 139
- de Val-Borro et al. (2011) de Val-Borro, M., Gahm, G. F., Stempels, H. C., & Peplinski, A. 2011, MNRAS, 413, 2679
- Eiroa & Casali (1992) Eiroa, C., & Casali, M. M. 1992, A&A, 262, 468
- Evans et al. (2009) Evans, N. J., et al. 2009, ApJS, 181, 321
- Herbig (1977) Herbig, G. H. 1977, ApJ, 217, 693
- Herbst, Beckwith, & Robberto (1997) Herbst, T. M., Beckwith, S. V. W., & Robberto, M. 1997, ApJ, 486, L59
- Herbst, Herbst & Grossman (1994) Herbst, W., Herbst, D. K., & Grossman, E. J. 1994, AJ, 108, 1906
- Herbst et al. (2002) Herbst, W., Bailer-Jones, C. A. L., Mundt, R., Meisenheimer, K., & Wackermann, R. 2002, A&A, 396, 513
- Hodapp, Rayner, & Irwin (1992) Hodapp, K. W., Rayner, J. , & Irwin, E. 1992, PASP, 104, 441
- Hodapp et al. (1996a) Hodapp, K.-W., Hora, J. L., Rayner, J. T., Pickles, A. J. & Ladd, E. F. 1996, ApJ, 468, 861
- Hodapp et al. (1996b) Hodapp, K.-W. et al. 1996, New Astronomy 1, 177
- Hodapp (1999) Hodapp, K.-W. 1999, AJ, 118, 1338
- Hodapp & Bressert (2009) Hodapp, K. W., & Bressert, E. 2009, AJ, 137, 3501
- Hodapp et al. (2010) Hodapp, K. W., Chini, R., Reipurth, B., Murphy, M., Lemke, R., Watermann, R., Jacobson, S., Bischoff, K., Chonis, T., Dement, K., Terrien, R., & Provence, S. 2010, Proc. SPIE 7735-45.
- Hubble (1916) Hubble, E. 1916, ApJ, 44, 190
- Johnson (1966) Johnson, H. L. 1966, ARAA, 4, 193
- Joy (1945) Joy, A. H. 1945, ApJ, 102, 168
- Kóspál et al. (2007) Kóspál, Á., Ábrahám, P., Prusti, T., Acosta-Pulido, J., Hony, S., Moór, A., & Siebenmorgen, R. 2007, A&A, 470, 211
- Marley et al. (2007) Marley, M. S., Fortney, J. J., Hubickyj, O., Bodenheimer, P., & Lissauer, J. J. 2007, ApJ, 655, 541
- Mathieu et al. (1997) Mathieu, R. D., Stassun, K., Basri, G., Jensen, E. L. N., Johns-Krull, C. M., Valenti, J. A., & Hartmann, L. W. 1997, AJ, 113, 1841
- Nakajima et al. (2002) Nakajima, Y., Tamura, M., Nagashima, C., Nagayama, T., Baba, D., Sugitani, K., Nakaya, H., Nagata, T., Kato, D., Kurita, M., Sato, S., Jiang, Z., Ita, Y., Tanabe, T., Nakata, Y., Naoi, T., Oasa, Y. 2002, Proc. SPIE 4836, 29-34
- Plavchan et al. (2008) Plavchan, P., Gee, A. H., Stapelfeldt, K., & Becker, A. 2008, ApJ, 684, L37
- Reipurth (2000) Reipurth, B. 2000, AJ, 120, 3177
- Reipurth et al. (2010) Reipurth, B., Mikkola, S., Connelley, M., & Valtonen, M. 2010, ApJ, 725, L56
- Rieke & Lebofsky (1985) Rieke, G. H. & Lebofky, M. J. 1985, ApJ, 288, 618
- Skrutskie et al. (2006) Skrutskie, M. F., Cutri, R. M., Stiening, R., Weinberg, M. D., Schneider, S., Carpenter, J. M., Beichman, C., Capps, R., Chester, T., Elias, J., Huchra, J., Liebert, J., Lonsdale, C., Monet, D. G., Price, S., Seitzer, P., Jarrett, T., Kirkpatrick, J. D., Gizis, J., Howard, E., Evans, T., Fowler, J., Fullmer, L., Hurt, R., Light, R., Kopan, E. L., Marsh, K. A., McCallon, H. L., Tam, R., Van Dyk, S., & Wheelock, S. 2006, AJ, 131, 1163
- Testi & Sargent (1998) Testi, L., & Sargent, A. I. 1998, ApJ, 508, L91
- Tokunaga, Simons, & Vacca (2002) Tokunaga, A. T., Simons, D. A., & Vacca, W. D. 2001, PASP, 114, 180
- Wainscoat & Cowie (1992) Wainscoat, R. J. & Cowie, L. L. 1992, AJ, 103, 332
- Wizinowich et al. (2006) Wizonowich, P. L., Le Mignant, D., Bouchez, A. H., Campbell, R. D., Chin, J. C. Y., Contos, A. R., Van Dam, M. A., Hartman, S. K., Johansson, E. M., Lafon, R. E., Lewis, H., Stomski, P. J., & Summers, D. M. 2006, PASP, 118, 297
| Date (UT) | JD | Filter | t | nreads | coadds | frames used | FWHM [mas] |
|---|---|---|---|---|---|---|---|
| 2007-06-10 | 2454262 | H2 | 30s | 8 | 1 | 125 | 88 |
| 2007-07-09 | 2454291 | K | 2s | 8 | 45 | 25 | 123 |
| 2009-06-20 | 2455003 | H2 | 60s | 16 | 1 | 82 | 114 |
| 2009-06-29 | 2455012 | K | 2s | 8 | 45 | 15 | 97 |
| Date | JD | Instrument | Filter |
|---|---|---|---|
| 5 Aug 1991 | 2448474 | UH NICMOS3 | K’ |
| 16 Aug 1994 | 2449581 | UH QUIRC | K |
| 13 Jul 1995 | 2449912 | UH QUIRC | K |
| 12 Oct 1995 | 2450003 | UH QUIRC | K |
| 6 Feb 1996 | 2450120 | UH QUIRC | K |
| 28 Jul 1996 | 2450293 | UH QUIRC | K |
| 3 Oct 1996 | 2450360 | UH QUIRC | K |
| 25 Apr 1997 | 2450564 | UH QUIRC | K |
| 17 Aug 1997 | 2450678 | UH QUIRC | K |
| 5 Feb 1998 | 2450850 | UH QUIRC | K |
| 30 Sep 1998 | 2451087 | UH QUIRC | K |
| 18 Aug 2000 | 2451775 | UH SIRIUS | Ks |
| 1 Aug 2002 | 2452488 | UH QUIRC | KMKO |
| 10 Jun 2003 | 2452801 | UH QUIRC | KMKO |
| 31 Jul 2004 | 2453218 | UH QUIRC | KMKO |
| 21 May 2008 | 2454608 | UKIRT WFCAM | KMKO |
| 17 Aug 2010 | 2455426 | IRIS | Ks |
| 28 Aug 2010 | 2455436 | IRIS | Ks |
| 14 Sep 2010 | 2455454 | IRIS | Ks |
| 1 Oct 2010 | 2455471 | IRIS | Ks |
| 20 Oct 2010 | 2455490 | IRIS | Ks |
| 20 Mar 2011 | 2455641 | IRIS | Ks |