Quantifying the Faint Structure of Galaxies: The Late-type Spiral NGC 2403††thanks: Based on data collected at the Subaru telescope, which is operated by the National Astronomical Observatory of Japan.††thanks: Based on observations made with the NASA/ESA Hubble Space Telescope, obtained from the Data Archive at the Space Telescope Science Institute, which is operated by the Association of Universities for Research in Astronomy, Inc., under NASA contract NAS 5-26555. These observations are associated with program GO10523.
Abstract
Ground-based surveys have mapped the stellar outskirts of Local Group disc galaxies in unprecedented detail, but extending this work to other galaxies is necessary in order to overcome stochastic variations in evolutionary history and provide more stringent constraints on cosmological galaxy formation models. As part of our continuing program of ultra-deep imagery of galaxies beyond the Local Group, we present a wide-field analysis of the isolated late-type spiral NGC 2403 using data obtained with Suprime-Cam on the Subaru telescope. The surveyed area reaches a maximum projected radius of 30 kpc or deprojected radius of kpc. The colour-magnitude diagram reaches 1.5 mag below the tip of the metal-poor red giant branch (RGB) at a completeness rate for kpc. Using the combination of diffuse light photometry and resolved star counts, we are able to trace the radial surface brightness (SB) profile over a much larger range of radii and surface brightness than is possible with either technique alone. The exponential disc as traced by RGB stars dominates the SB profile out to disc scale-lengths, or kpc, and reaches a -band SB of . Beyond this radius, we find evidence for an extended structural component with a significantly flatter SB profile than the inner disc and which we trace to kpc and . This component can be fit with a power-law index of , has an axial ratio consistent with that of the inner disc and has a V-band luminosity integrated over all radii of 1–7% that of the whole galaxy. At kpc, we estimate a peak metallicity [M/H] assuming an age of 10 Gyr and zero element enhancement. Although the extant data are unable to discriminate between stellar halo or thick disc interpretations of this component, our results support the notion that faint, extended stellar structures are a common feature of all disc galaxies, even isolated, low-mass systems.
keywords:
galaxies: individual: NGC2403 – galaxies: haloes – galaxies: discs – galaxies: structure – galaxies: stellar content1 Introduction
The stellar outskirts of galaxies are important testing grounds for models of galaxy formation and evolution. This is because the dynamical and star formation timescales there are relatively long making it easier to identify accreted material and to study relatively unprocessed gas. N-body and hydrodynamical simulations of galaxy formation within a cosmological context predict that the merging and accretion that is more common at high redshift can leave an imprint on galaxy outskirts that is visible to the present day in the form of thick discs, stellar haloes and discrete substructures (e.g. Brook et al., 2004; Bullock & Johnston, 2005; Cooper et al., 2010). Within this scenario, the properties of these structures may correlate with host galaxy properties, like present-day total mass, but they are also expected to exhibit significant variations at the same mass scale due to stochastic variations in the merging/accretion history and the detailed nature of the individual progenitor systems (e.g. Cooper et al., 2010; Purcell et al., 2007). Thick discs and haloes may also arise from other processes besides merging, such as radial migration, misaligned gas accretion, and in-situ star formation (Schönrich & Binney, 2009; Roškar et al., 2010; Loebman et al., 2010). Therefore, it is crucial to study as many galaxies and galaxy types as possible to overcome stochastic variations and discern underlying trends that may help to isolate the dominant formation mechanisms.
These outer stellar structures are very faint, typically several magnitudes below the sky level. Detecting their diffuse light requires very careful treatment of sky subtraction, flat-fielding errors, detector response, scattered light, and PSF wings (e.g. Morrison et al., 1997; de Jong, 2008). Nevertheless, a growing body of diffuse light analyses supports the idea that such structures are common around disc galaxies (e.g. Zibetti et al., 2004; Zibetti & Ferguson, 2004; Jablonka et al., 2010; Burstein, 1979; Tsikoudi, 1979; Shaw & Gilmore, 1990; de Grijs & van der Kruit, 1996; Morrison et al., 1997; Neeser et al., 2002; Dalcanton & Bernstein, 2002; Malin & Hadley, 1997; Shang et al., 1998; Martínez-Delgado et al., 2009). Most of these studies have imaged in a single band hence there is no information on the the nature of the extended stellar populations. Even in cases where multiple passbands have been obtained, the age-metallicity degeneracy present in optical broadband colours enables only very crude constraints.
An alternative approach to studying galaxy outskirts is with resolved stars, a technique which can typically reach far fainter surface brightness (SB) levels than diffuse light. The most interesting cosmological constraints come from the old stars in these systems, those on the red giant branch (RGB). With ground-based telescopes, resolving RGB stars in external galaxies was initially limited to systems within the Local Group (e.g. Ferguson et al., 2002, 2007; Ibata et al., 2007; McConnachie, 2009). These studies found a wealth of very faint stellar structures around the MW-analog M31 and comparatively little around the late-type spiral M33. These structures exhibited large-scale inhomogeneities in distribution and composition, highlighting the importance of areal coverage when looking at galaxy outskirts. However, these are just two systems; more rigorous tests of cosmological galaxy formation models require similar data for many more galaxies beyond the Local Group.
With this motivation in mind, we are conducting a program to explore the low surface brightness outer regions of all large galaxies within 5 Mpc using wide-field imagers on 8-m class telescopes. In our first paper, we used Subaru/Suprime-Cam to identify an extended structure of RGB stars around the MW-analog, M81, stretching out to a deprojected radius kpc (Barker et al., 2009). This structure had a flatter radial and azimuthal surface density profile than the main disc suggesting it was a halo or thick disc, but its properties did not exactly match either of these components in the MW. Furthermore, as M81 is part of an interacting group of galaxies, we could not exclude the hypothesis that the extended component was the result of a recent tidal encounter.
In parallel with our efforts, other groups have pursued similar studies but typically with smaller field-of-view (FOV) imagers (e.g. Vlajić et al., 2009, 2011; de Jong et al., 2008; Rejkuba et al., 2009). Such studies risk being affected by the presence of localized substructures which fall within the FOV and also suffer from significant uncertainty in the background/contaminant subtraction which is a crucial aspect of quantifying low surface brightness emission. Even for systems beyond the Local Group, the FOVs of HST and GMOS are too small to reveal a global picture of their outer structures and wide-field imagers like Suprime-Cam are clearly needed (e.g. Mouhcine et al., 2010; Bailin et al., 2011; Tanaka et al., 2011). Perhaps it is not so surprising then, that, until recently, no detailed global analysis of RGB stars had been conducted for a spiral galaxy outside the Local Group.
As part of our program, we present here observations of the late-type Sc galaxy, NGC 2403. With a total mass and a circular velocity of (Fraternali et al., 2002), NGC 2403 is similar in many respects to M33 and NGC 300, and is, therefore, a good system with which to increase the observed baseline in galaxy mass. In this work, we adopt the HST Key Project Cepheid-based distance modulus of , giving it a distance of 3.13 Mpc (Freedman et al., 2001). This distance compares favorably to HST RGB tip-based distances of 3.09 – 3.20 Mpc (Dalcanton et al., 2009). At this distance, kpc. NGC 2403 is located from the plane of the MW with a Galactic longitude of . It has a B-band isophotal radius of , or 9.8 kpc, and a photographic V-band disc scale-length kpc within the inner 4.5 kpc (Okamura et al., 1977). The total apparent V-band magnitude, corrected for reddening, is (de Vaucouleurs et al., 1991), which translates to an absolute magnitude of . With an inclination of (Fraternali et al., 2002), inclination-dependent extinction effects are not likely to be significant ( mag, Shao et al. (2007)).
Fraternali et al. (2002) used high resolution Very Large Array observations of neutral hydrogen in NGC 2403 to derive a total HI mass and a dynamical mass inside a radius of 23 kpc. These observations revealed no signs of interaction in the immediate vicinity. However, they did reveal an asymmetric warp in the outer disc and a thick, clumpy layer of HI that rotates more slowly than, and contains roughly the mass of, the cold HI disc.
NGC 2403 is the brightest member of a loose galaxy group that shows no clear signs of interactions. Chynoweth et al. (2009) detected no HI clouds in this group with masses down to a limit of . The nearest systems to NGC 2403 are the small galaxies, DDO 44 and NGC 2366, each lying kpc and kpc away in projection, respectively. Five other small galaxies are located kpc away in projection (Karachentsev et al., 2002). On larger scales, NGC 2403 belongs to a filament of known galaxies spanning roughly on the sky. M81 is located near the center of the filament kpc from the spirals NGC 2403 and NGC 4236, which lie at opposite ends. NGC 2403 is at least 4 times farther away from the nearest large disc galaxy (M81) than M33 is from M31 and hence it can be considered a far more isolated system.
This paper is organized as follows. In §2, we describe the observations and data reduction procedures. In §3, we present the colour-magnitude diagram (CMD) and, in §4.1, we show the 2-dimentional point source maps. Then, the radial star count profiles are derived in §4.2, which reveal the presence of the extended component. After that, in §4.3, we estimate the RGB metallicity of the extended component. In §5, the SB profile is derived and we fit the SB profile with several models and, in §6, we discuss the implications. Finally, we summarize the results in §7.
2 Observations and Data Reduction
The observations were obtained with the Suprime-Cam instrument (Miyazaki et al., 2002) on the 8-m Subaru telescope on the night of January 8, 2005 (S04B, PI=N. Arimoto). This instrument consists of 10 CCDs of 2048x4096 pixels arranged in a 2x5 pattern, with a pixel scale of 0.2 arcsec and a total field of view of approximately 34′x27′(including long edge inter-chip gaps of 16 – 17 arcsec and short edge gaps of 5 – 6 arcsec).
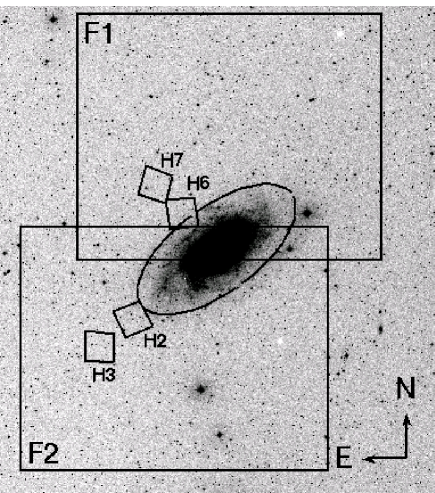
NGC 2403 was covered using two field centers, one to the north of its nucleus at and another to the south at . The large rectangular boxes in Fig. 1 outline the locations of these fields, which we refer to as F1 and F2, respectively. For each field, we obtained a set of 8 images in the Johnson filter with individual exposure times of 450s, and 12 images in the Sloan filter with exposure times of 205s. All observations were recorded under slightly non-photometric conditions through patchy thin cirrus. The images of F1 were taken in an average seeing of in both filters while the F2 images had an average seeing of and in the -band and -band, respectively.
To fill in the chip gaps and facilitate the removal of cosmic rays and bad pixels, individual images were dithered by arcsec, resulting in a mosaic for each field covering 36′x28′, or 32x25 kpc. Accounting for the overlap region between F1 and F2, the total surveyed area was , or , in the central 39x48 kpc around NGC 2403. Flat-field and interchip gain variations were removed with master flats obtained by combining 12 and 11 twilight sky flats in the and filters, respectively. After flat-fielding, remaining large scale variations in dark sky level, measured directly from stacked dark sky images at several different positions obtained during this run, were less than 1% of sky. An -band fringe frame acquired from an earlier Suprime-Cam imaging run was used to help assess the degree of dark sky fringing present, but this was found to be negligible in our data, so this extra image processing step was not required.
The image processing procedure was very similar to that followed by Barker et al. (2009). After converting the raw data to multi-extension FITS format, all images and calibration frames were run through a variant of the data reduction pipeline developed for the Isaac Newton Telescope (INT) Wide Field Survey (WFS) 111http://www.ast.cam.ac.uk/wfcsur/. Here we present a brief overview of the main steps of the pipeline which is described in more detail in Irwin (1985, 1997); Irwin & Lewis (2001) and Irwin et al. (2004).
Prior to deep stacking, catalogues were generated for each individual processed science image to both refine the astrometric calibration and asses the data quality. For astrometric calibration, a Zenithal polynomial projection (Greisen & Calabretta, 2002) provided a good prescription for the World Coordinate System (WCS) and included all the significant telescope radial field distortions. We used this in conjunction with a 6-parameter linear plate model per detector to define the required astrometric transformations. The 2MASS point source catalogue (Cutri, 2003) was used for the astrometric reference system.
The individual image qualities were then assessed using the average seeing and ellipticity of stellar images, as well as sky level and sky noise determined from the object cataloguing stage. Images were stacked at the detector level using the updated WCS information to accurately align them to a reference image. The background level in the overlap area between each image in the stack and the reference was adjusted additively to compensate for sky variations during the exposure sequence and the final stack included seeing weighting, confidence (i.e. variance) map weighting, and clipping of cosmic rays.
Next, we generated detector-level catalogues from the stacked images and updated the WCS astrometry in the FITS image extensions prior to mosaicing all detectors together. Residual astrometric errors over the whole stacked array were typically , greatly simplifying this process. Slight offsets in underlying sky level between the stacked detector images caused small (typically of sky), but still visible, discontinuities in the final mosaics. These offsets were due to small colour equation differences in the detectors and the relatively blue colour of the twilight sky compared to dark sky and unresolved diffuse light from NGC 2403. We corrected these offsets iteratively by visual inspection of a 4x4 blocked version of the mosaics using a pre-assigned keyword in each relevant detector FITS extension designed for this purpose.
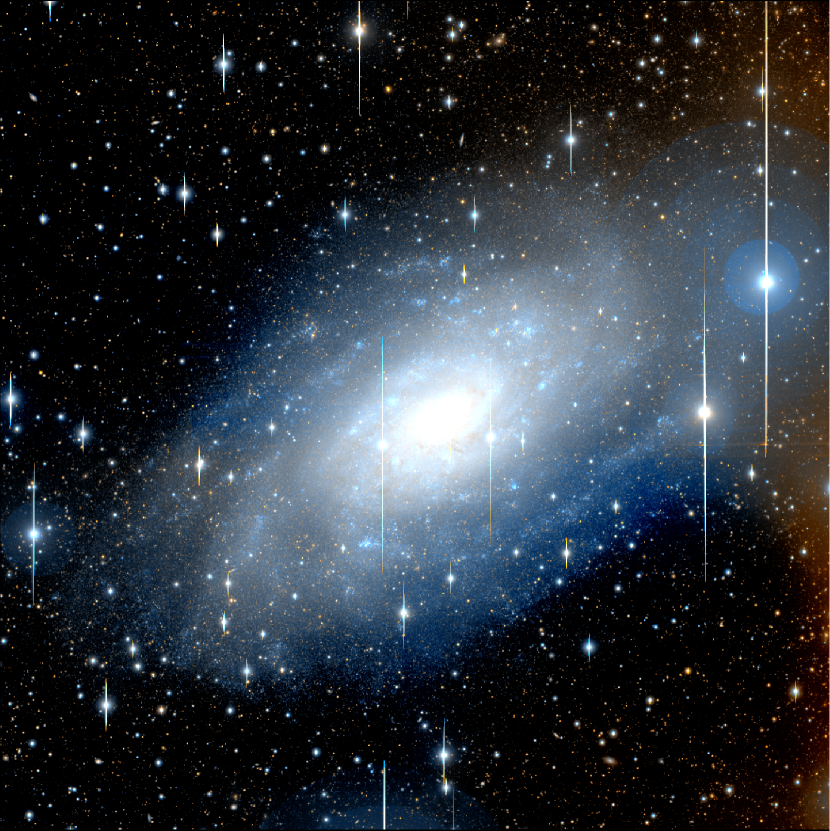
Fig. 2 shows a colour composite image made from the and stacked mosaics of both fields and cropped to kpc on a side. In this image, north is up and east is to the left. The intensity scaling is logarithmic and the colour mapping is similar to that of Lupton et al. (2004) with for the blue channel, for red, and the average for green.
The data reduction pipeline also produced an aperture photometry catalogue using a “soft-edged” aperture with radius close to the full-width-half-maximum (FWHM) (e.g., Irwin, 1997; Naylor, 1998). A series of apertures ranging from 1/2 to 4 times the FWHM were additionally used to compute stellar aperture corrections and to correct for PSF variation across the field-of-view.
The photometric calibration was based on a comparison with 0.29 deg2 of INT -band photometry centred on NGC 2403 taken in photometric conditions during April 2009. The INT photometry were converted to the Johnson-Cousins system using the transformation equations given on the WFS website. All the INT data were calibrated on a nightly basis against multiple observations of Landolt standard stars. Both Subaru fields for NGC 2403 were compared independently with the INT data and were found to have the same zero-points to within their errors (). They were also checked directly against each other using the common overlap region and again they agreed within this error. Thus, the photometric zero-point is accurate to mag.
2.1 PSF-Fitting Photometry
Because the data reduction pipeline did not provide a direct estimate of the completeness rate, we elected to additionally perform PSF-fitting photometry on the stacked mosaics. This was accomplished using the standalone versions of the DAOPHOT/ALLSTAR/ALLFRAME suite of programs (Stetson, 1987; Stetson & Harris, 1988; Stetson, 1994). The PSF for each field in each filter was built by starting with an initial list of roughly 1000 bright, fairly isolated stars and iteratively subtracting neighbors, rejecting stars with large residuals, and increasing the spatial complexity of the PSF as a function of position on the mosaics. In the end, this left several hundred stars to build a PSF that varied quadratically with position on each stacked mosaic.
We derived a coordinate transformation between the stacked and mosaics of each field using DAOMASTER (Stetson, 1993). The stacked mosaics were then coadded with MONTAGE2 (Stetson, 1994). Objects meeting a detection threshold on the coadded image were measured with ALLSTAR to obtain a first guess at positions and magnitudes and the resulting list was input into ALLFRAME together with the stacked mosaics in each filter and their coordinate transformation. To reduce contamination from non-stellar sources in the ALLFRAME photometric catalogue, we excluded objects with abnormally low or high sharp values as measured in the -band. For the overlap region between F1 and F2 we used only the F1 catalogue since it had better seeing. The PSF magnitudes were standardized to the Johnson-Cousins system using linear transformations to the calibrated Subaru aperture photometry described in §2.
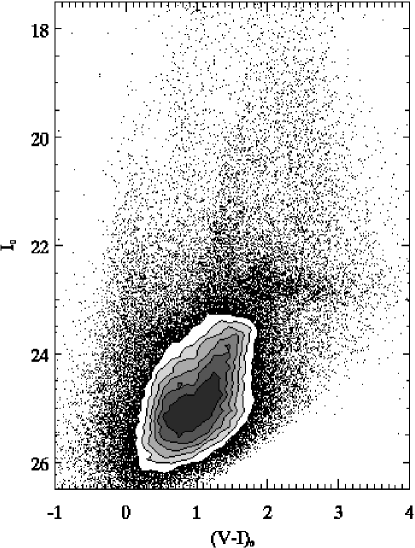
Fig. 3 shows the colour-magnitude diagram (CMD) for the final point source catalogue for both fields, which contains 163293 sources. Contours are overplotted where the density of points is extremely high. The contour levels correspond to [140, 200, 260, 320, 380, 440] . There are several clear stellar sequences visible, which we discuss in more detail in §3.
2.2 Artificial Star Tests
To estimate completeness, we performed artificial star tests in which fake stars with known magnitudes were injected onto each stacked mosaic and then the PSF-fitting procedure described above was repeated. The fake stars had positions, magnitudes, and colours distributed like the real stars. This process was repeated several times to build up a total catalogue of injected fake stars equally divided between F1 and F2.
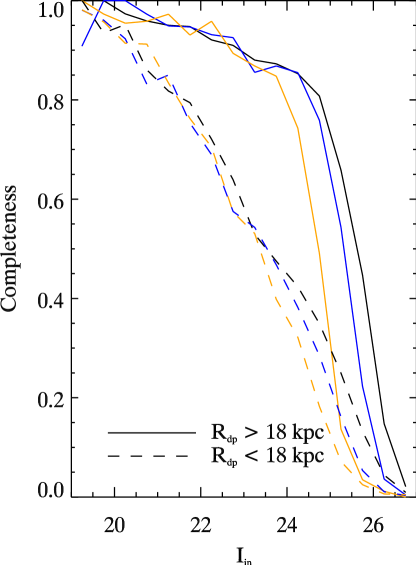
Fig. 4 plots the completeness rate derived from the artificial star tests for both fields combined. Close to the bright, optical disc of NGC 2403, the completeness varies significantly with deprojected radius () 222Deprojected radii refer to the circular radii within the disc plane and are calculated assuming the 2MASS near-infrared isophotal center of (Jarrett et al., 2003), an inclination of 63°, and a position angle of 124° measured north through east (Fraternali et al., 2002).. Thus, we show the completeness for two radial ranges, kpc (dashed) and kpc (solid), and for three different input (VI) colour ranges, 0 – 1 (black), 1 – 2 (blue), and 2 – 3 (orange). Table 1 lists the 50% completeness levels in the -band for both fields individually and for the total catalogue. In F1, the 50% completeness level occurs at for kpc and at for kpc. In F2, the 50% completeness level occurs at for kpc and at for kpc. The 50% level is fainter in F1 than it is in F2 because of the difference in seeing, but the effect is most noticeable in the bright optical disc where the crowding is highest. We account for this difference whenever necessary by treating the completeness corrections separately for each field. In §4.2, we further examine the completeness as a function of radius in the context of the star count profiles.
| 0 – 1 | 1 – 2 | 2 – 3 | |
|---|---|---|---|
| kpc | |||
| Field F1 | 24.2 | 23.9 | 23.5 |
| Field F2 | 23.1 | 23.2 | 22.9 |
| Total catalogue | 23.5 | 23.5 | 23.4 |
| kpc | |||
| Field F1 | 25.9 | 25.5 | 24.9 |
| Field F2 | 25.3 | 25.0 | 24.4 |
| Total catalogue | 25.6 | 25.3 | 24.7 |
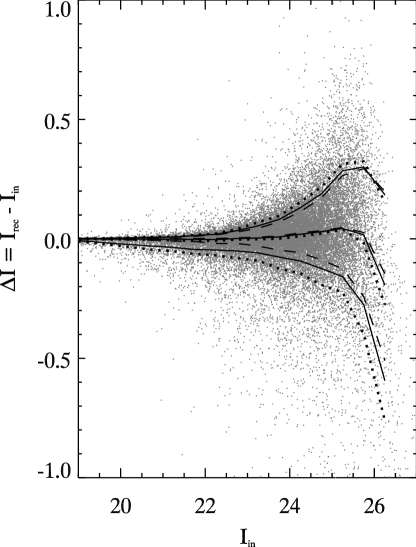
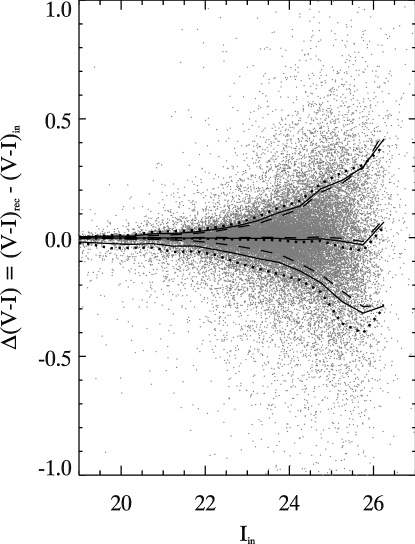
In Fig. 5, we show the -band photometric shifts of the artificial stars, , for the total catalogue. This shift is defined as the recovered magnitude minus the input magnitude. The lines show the median shift and the central 68% for stars at all radii (solid) and those with kpc (dotted) and with kpc (dashed). For all radii, the median of is at and at . Fig. 6 plots the same information as Fig. 5, but for the colour shift, . For all radii, the median of is at and at . These figures show that there are no significant systematic colour or magnitude shifts for .
3 Colour-Magnitude Diagram
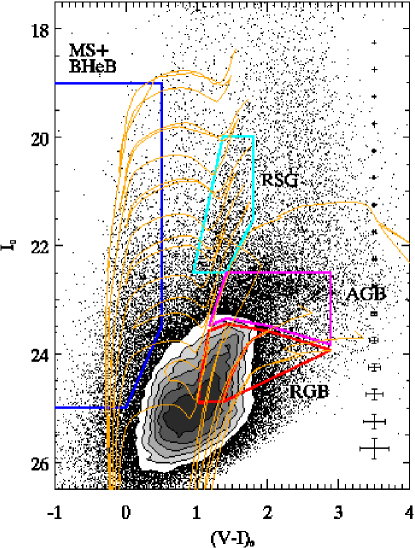
In Fig. 7, we show the de-reddened point source CMD with isochrones from Marigo et al. (2008) shifted to the distance of NGC 2403. On the right-hand side are typical photometric errors (the median of ) from the artificial star tests. Clearly, there is a range of ages and metallicities present in these fields. The young isochrones at have ages of 10.0, 17.8, 31.6, 56.2, 100, and 178 Myr and a metallicity [M/H] . This metallicity should be representative of the young populations in the disc, as Garnett et al. (1997) measured [O/H] of HII regions to decrease from roughly solar at 1 kpc to about 0.4 dex below solar at 6 kpc. The three old isochrones at have a common age of 10 Gyr and [M/H] = –1.3, –0.7, –0.4. The discontinuities in the asymptotic giant branch (AGB) are explained in Marigo et al. (2008) and are caused by changes in the opacity tables at the transition to the thermally pulsing phase.
We apply extinction corrections on a star-by-star basis using the Schlegel et al. (1998) maps. These maps indicate a median value of 0.04 with negligible spatial variation. We adopt the Cardelli et al. (1989) extinction law, for which and . The inner kpc in projected radius around NGC 2403 were masked in the Schlegel et al. (1998) maps and replaced with median values from the surrounding sky. Thus, the star-by-star correction does not include extinction internal to NGC 2403, but this should not be a serious problem since (i) we mainly focus on regions outside the bright optical disc, (ii) we are mostly concerned with the RGB stars, which tend to lie farther away from the high extinction star forming regions than young stars (Zaritsky, 1999), and (iii) our CMD selection boxes are large compared to the expected amount of internal extinction.
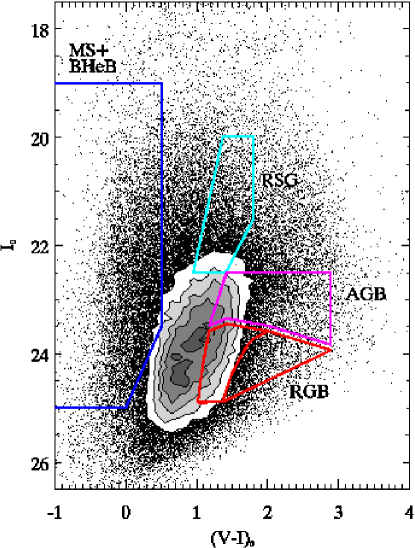
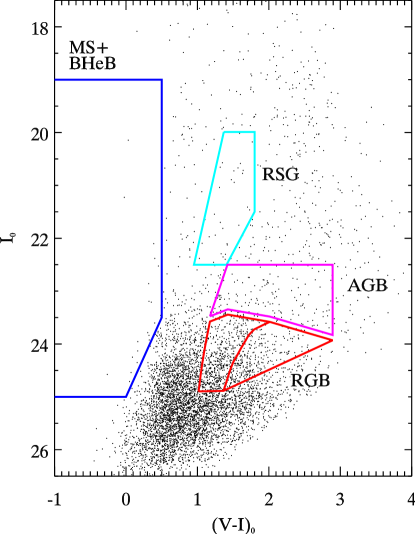
In what follows, we will focus on several particular CMD regions (outlined in Fig. 7) which isolate stars in different evolutionary stages in NGC 2403. The blue lines in Fig. 7 mark the region occupied by young main sequence and blue helium burning stars (MS+BHeB) with ages Myr. Stars within the cyan polygon are red supergiants (RSGs) with ages in the range Myr. The red lines enclose RGB stars, which can have ages Gyr. The bright edge of the RGB box is set by the RGB tip of the isochrones which has a small metallicity dependence. There could be some contamination of the RGB box by AGB stars and by young, red helium burning stars with masses of , particularly if they have [M/H] . The magenta lines enclose AGB stars above the RGB tip, which tend to have somewhat younger ages ( Gyr) than the RGB stars (Martínez-Delgado et al., 1999; Gallart et al., 2005).
We have also divided the RGB box into “metal-poor” ([M/H] ) and “metal-rich” ([M/H] ) subregions. There will be some overlap in the metallicities probed by these subregions due to photometric errors, but they are broader than the errors, and so are useful in identifying any population gradients. Some of the most metal-poor ([M/H] ) and metal-rich ([M/H] ) RGB stars may fall outside the total RGB box, but extending it further to the blue or red would increase contamination from MW foreground stars and unresolved background galaxies, and would increase uncertainties due to incompleteness. We note that our use of the term, metal-poor, differs somewhat from the traditional sense because it includes metallicities up to [M/H] but this definition has been chosen for consistency with Barker et al. (2009).
There is a clear RGB sequence visible in Fig. 7 with a colour distribution that peaks between the [M/H] = –1.3 and –0.7 isochrones, suggesting a dominant population in between these two metallicities. At magnitudes fainter than , the peak in the colour distribution moves toward bluer colours because of the increasing contamination from unresolved background galaxies. To mitigate this contamination, we do not use any sources fainter than .
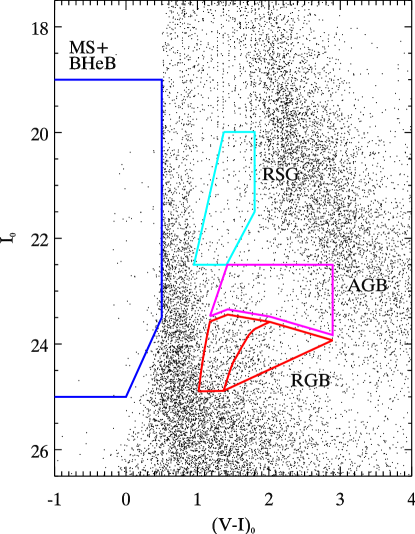
Fig. 8 shows the foreground star CMD predicted by the Besançon model of the MW (Robin et al., 2003) for the same total area and line of sight as our observations. We applied extinction corrections to the foreground stars in the same way as for the real data. The stellar colours and magnitudes have been scattered using a simple exponential function to mimic the increase of photometric error with magnitude seen in the artificial star tests. The Besançon model predicts that the number of foreground stars is of all point sources over the magnitude limits of the NGC 2403 CMD. There are two main features in the foreground star CMD, a narrow vertical strip at and a broader, curved band in the upper right quadrant. The vertical strip is composed mostly of main sequence turnoff stars in the MW halo at and in the MW disc at while the curved band is comprised of late-type main sequence stars in the MW disc. These two features are visible in the NGC 2403 CMD at magnitudes brighter than . As can be seen in Fig. 8, the CMD selection boxes sample regions that minimize contamination from foreground stars.
To check the effectiveness of our morphological classification, Fig. 9 shows the CMD of the objects classified as extended (i.e., with high sharp values indicating a poor fit to the stellar PSF). The CMD selection boxes and contours are overlaid to facilitate comparison with Fig. 7. The number of extended objects is about the same as the number of point sources. The extended objects are concentrated in a broad diagonal band, the bulk of which lies at bluer colours than the RGB and AGB selection boxes. Importantly, the extended objects have a colour-magnitude distribution that is different from that of the point sources, and most of the stellar sequences in Fig. 7 are not visible. Examination of the extended object spatial distribution in the sky reveals that some of them are misclassified stars located in heavily crowded regions in the bright optical disc of NGC 2403. However, these are the most poorly measured objects and they should not affect our conclusions because we apply completeness corrections to the radial star count profiles and we rely on the diffuse light profile inside kpc.
4 Star Count Analyses
4.1 Spatial Distribution
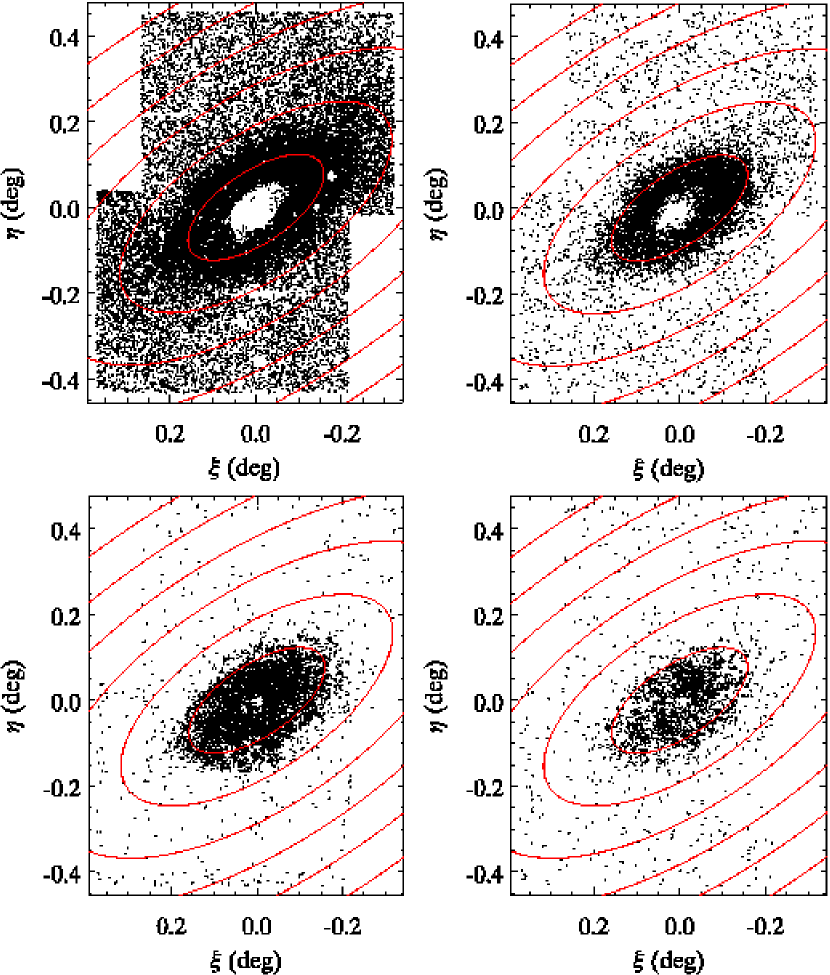
In Fig. 10, we plot the two-dimensional spatial distribution of sources in the CMD selection boxes. Going clockwise from top left, the maps show RGB, AGB, RSG, and MS+BHeB point sources. No correction for contaminants has been made. The ellipses correspond to kpc in steps of 10 kpc (). The hole in the nucleus is due to severe stellar crowding. A few highly saturated stars also appear as smaller holes. The horizontal white stripes at are due to low confidence pixels, which have a low effective exposure time because of dithering. We exclude these pixels from the star count profiles below.
In contrast to our findings for M81 and comparably deep images of NGC 891 (Mouhcine et al., 2010), there are no obvious substructures in the distribution of MS+BHeB and RSG stars beyond the optical disc. The RGB and AGB stellar distributions are relatively smooth suggesting that NGC 2403 has evolved quiescently with no significant recent major accretions or mergers. However, we note that the photometry in our survey of NGC 2403 does not go as deep as in the INT or CFHT surveys of M31 and M33 (Ferguson et al., 2002; McConnachie et al., 2010), so the very faint structures seen in those surveys would be below our detection limit.
4.2 Radial Profiles
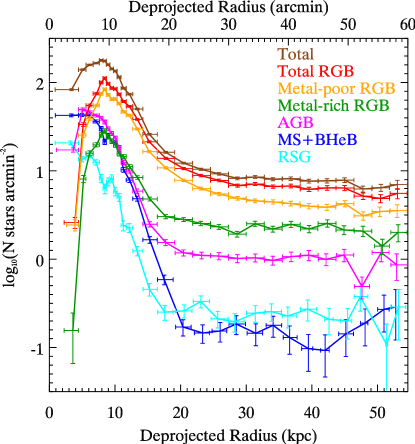
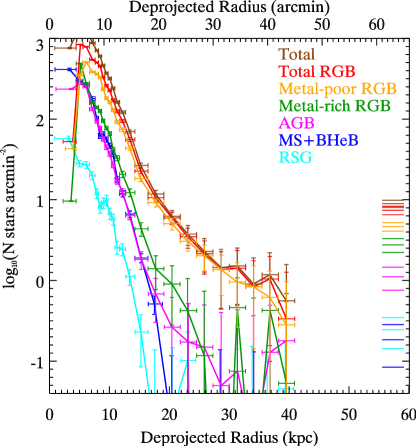
Fig. 11 shows the raw surface density profiles for point sources in the CMD selection boxes (i.e., before any completeness correction or background subtraction has been applied). Low confidence pixels near the chip edges and mosaic corners are excluded from the profiles. The lines are colour-coded so that the total RGB box is red, metal-poor RGB box is orange, metal-rich RGB box is green, AGB box is magenta, MS+BHeB box is blue, and RSG box is cyan. The top profile is the total of all the boxes. Each point in the profiles is the mean of all stars within a bin. Horizontal error bars span the full radial range of stars in each bin. Vertical error bars include Poisson noise, which may underestimate the true error because it does not include background galaxy clustering. Severe crowding causes the profiles to turn over at kpc. Beyond 10 kpc, there are two regimes visible, one that extends out to kpc where the profiles have a steep slope and another beyond 18 kpc where they are relatively flat. In particular, the metal-poor RGB profile decreases slowly out to kpc showing the first indication of an outer structure of metal-poor RGB stars around NGC 2403.
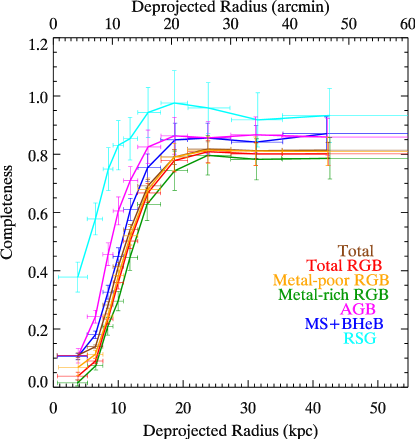
Next, we correct the raw star counts for completeness by weighting each star by , where is the star’s completeness interpolated in colour, magnitude, and using the artificial stars in the appropriate field. Fig. 12 shows the weighted mean completeness rate (i.e., ) of the CMD selection boxes in the total catalogue. Beyond 18 kpc, the completeness is approximately constant and inside 18 kpc, the completeness drops with decreasing radius because of stellar crowding. This figure shows that the metal-poor RGB has a completeness rate for kpc. Similarly, the total profile is complete for kpc. Because of the difference in seeing between the two fields, the total profile is complete for (12) kpc in field F1 (F2) alone.
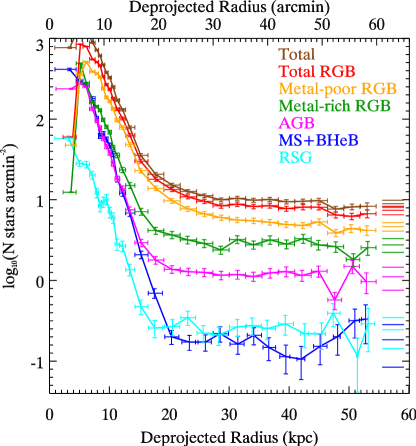
Fig. 13 shows the resulting completeness-corrected surface density profiles. The completeness correction leaves the profiles outside 18 kpc mostly unchanged, but it has a larger effect on the inner 18 kpc where the profile slopes are now much more similar and more clearly show the exponential decline of the inner disc (discussed further in §5). Inside 6 kpc, some profiles still turn over indicating the completeness correction is less reliable there, which is not surprising given the high degree of crowding.
The short horizontal lines on the right-hand side of Fig. 13 mark the background levels and uncertainties. The background level for each box comes from the total counts and area summed over the last 5 bins covering kpc while the uncertainty comes from the standard deviation of the same bins. Fig. 14 shows the CMD for the background region, which covers an area of or the total field of view. There are no obvious NGC 2403 stellar sequences visible, consistent with these objects being dominated by unresolved background galaxies and MW foreground stars. The selection boxes avoid the most heavily contaminated regions at and .
The background-subtracted, completeness-corrected star count profiles are displayed in Fig. 15. This figure shows strong evidence for an extended metal-poor RGB component with a shallower radial profile than the inner disc, that starts to dominate the star counts at kpc. There is also a small excess of metal-rich RGB stars at kpc, but this could be due to photometric errors scattering some metal-poor RGB stars into the metal-rich box.
The MS+BHeB and RSG profiles extend out to kpc or and the AGB profile extends out to kpc or , consistent with the findings of Davidge (2003, 2007). The AGB profile shows a slight change in slope at 18 kpc similar to the RGB profiles, but the errors on the points beyond this distance are too large to say with high confidence whether or not this change is real.
All the background-subtracted profiles exhibit a similar steep slope at kpc. As we will see in Section 5, this radial range is clearly dominated by outer disc. We fitted exponentials to the profiles in this region, after multiplying the logarithm of the surface density by 2.5 to bring them onto a magnitude scale, and the resulting scale-lengths are listed in Table 2. The quoted errors give the interval over which increases by 1.0. The young star profiles have scale-lengths around 1.7 kpc while the AGB stars have a larger scale-length of kpc, suggesting some size evolution in the scale-length over the last few Gyr. The metal-poor RGB profile has a longer scale-length than the metal-rich RGB profile, and both RGB profiles have longer scale-lengths than any of the young star profiles. This could be due to a contribution from a distinct, more extended metal-poor component and/or the disc RGB population being more broadly distributed in radius than the young stars, further suggesting outside-in formation.
| CMD box | Scale-length |
|---|---|
| (kpc) | |
| MS+BHeB | |
| RSG | |
| AGB | |
| metal-poor RGB | |
| metal-rich RGB | |
| total-RGB | |
| total |
4.3 RGB Metallicity
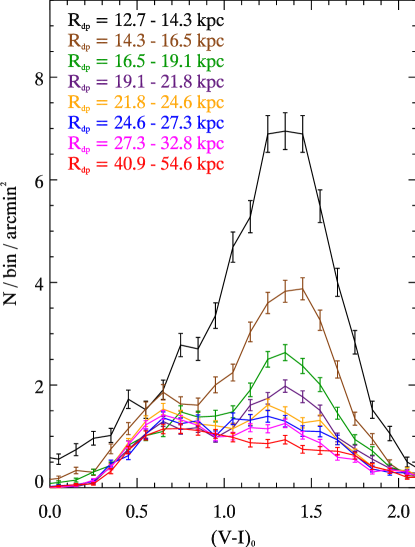
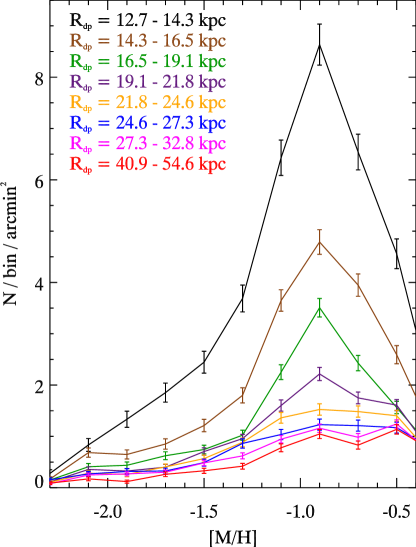
To examine in more detail the nature of the extended RGB component at large radii, Fig. 16 shows the colour histogram for point sources in the magnitude range and for several different radial ranges including the background region at kpc. Each histogram has units of surface density per 0.1 mag-wide bin, so the background region has the lowest values. The error bars include the contribution from Poisson noise, but not from clustering of background galaxies, and, therefore, they may underestimate the true standard deviation in each bin. In this figure, the RGB appears as the prominent peak at , which drops to the background level at the outermost radii. There is little apparent change in the position of the peak with radius suggesting little variation in the peak metallicity. At kpc, there is still a peak visible at the same colour as the inner radii.
Next, we construct the metallicity distribution function (MDF) of point sources falling in the RGB selection box. For this purpose, we assume an age of 10 Gyr and and adopt the Marigo et al. (2008) isochrones. We use 9 isochrones spaced roughly 0.3 dex apart in the range [M/H] –2.3 to 0.2. These isochrones form an irregular grid in colour, magnitude, and metallicity. We then interpolate between the grid points to measure the metallicity of each source in the RGB selection box. The interpolation is performed with the TRIGRID function in the Interactive Data Language (IDL), which utilizes Delaunay triangulation and polynomial interpolation.
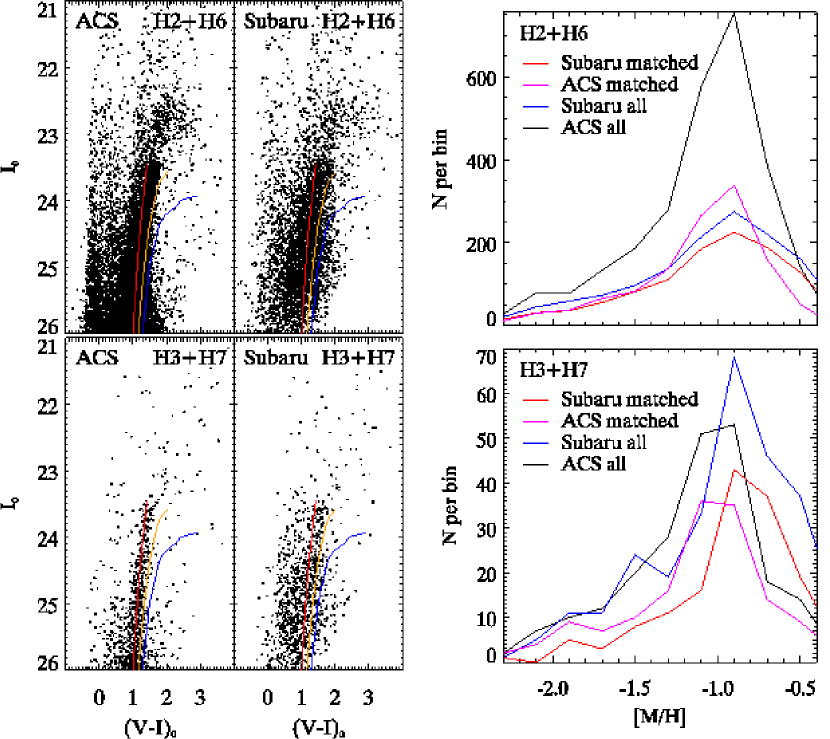
Fig. 17 shows the MDFs for different radial ranges in units of surface density per 0.2 dex-wide bin. Sources falling in the metal-rich RGB box lie within the 2 highest metallicity bins. We do not show metallicities higher than –0.4 as this is roughly the maximum metallicity contained within the metal-rich RGB box for this age. The MDFs are not corrected for incompleteness, but this should not dramatically alter their shapes since the metal-rich RGB box is typically only less complete than the metal-poor RGB box.
The MDFs for all radii exhibit a peak at [M/H] . Adopting the Dartmouth isochrones (Dotter et al., 2007) gives a peak metallicity dex lower. Adding the above uncertainties in quadrature, and taking the mean of the two estimates with the different isochrones, gives [M/H] as our final estimate for the peak metallicity. If the mean RGB age is as young as 2 Gyr, then the peak metallicity would be dex higher. An enhancement in the -elements would leave our estimate for [M/H] unchanged because -enhanced isochrones can be approximated by scaled-solar isochrones with the same global metallicity. Using the formalism of Salaris et al. (1993), an enhancement in the -elements of would mean that [Fe/H] is lower than [M/H] by dex.
There is no statistically significant gradient in the peak metallicity out to 27 kpc in Fig. 17, but radial star formation history variations may hide any metallicity gradient that is present given our assumption of a simple stellar population. As we move to larger radii and the number of NGC 2403 stars decreases, the MDFs look increasingly similar to the background. At all radii, there appears to be a large spread in metallicity. The artificial star tests indicate that only at kpc do the photometric errors contribute significantly to this spread. At these radii, there could also be some young, red helium-burning giants contaminating the metal-poor tail. A spread in age at any radius may also contribute to the observed MDF widths. Finally, we note that a star-by-star scatter plot of [M/H] versus did not reveal any further information.
Davidge (2003) observed a single field located on the NE minor axis at kpc. He measured an RGB metallicity gradient by comparing the observed RGB colour near the RGB tip to that of several MW globular clusters. He divided his field into radial subregions and found at kpc and at kpc (after converting his galactocentric radii to reflect our values of inclination, position angle, and distance modulus). We have extracted the RGB stars within his observed field and divided them into the same subregions, but the MDFs were consistent with those in Fig. 17 and they showed no evidence for a metallicity gradient. We note that Davidge’s field encompasses a radial range where the stellar density falls off rapidly; it is possible that an underestimate of the background contamination could explain his result.
To check the external accuracy of our metallicities, we downloaded and reduced four HST/ACS fields from the MAST archive (PID 10523) that fall within our surveyed area. The names and locations of the fields are given in Fig. 1. We performed the data reduction using the ACS module of the DOLPHOT package 333DOLPHOT is an adaptation of the photometry package HSTphot (Dolphin, 2000). It can be downloaded from http://purcell.as.arizona.edu/dolphot/. following the steps outlined in the DOLPHOT manual and using the default input parameters. We defined objects as point sources if they were classified by DOLPHOT as ’good stars’ with and crowding parameter in both filters, and if the overall and . Magnitudes were reported for every source in the native ACS VEGAMAG filter system ( and ) and in the ground-based Johnson-Cousins system using the transformation equations in Sirianni et al. (2005).
Fig. 18 compares the ACS CMDs and MDFs with the Subaru CMDs and MDFs for all point sources falling within the ACS fields. To boost the number statistics, we combined the ACS fields into two pairs with similar radii, and 12 kpc for H2H6 and and 21 kpc for H3H7. Overplotted on the CMDs are the Marigo et al. (2008) isochrones for an age of 10 Gyr and [M/H] –1.3, –0.7, and –0.4. For ease of comparison, the ACS CMDs are in the ground-based magnitude system, but to avoid any possible biases introduced in the transformation, the computation of the ACS MDFs was done in the native ACS system. Additionally, we matched point sources in the Subaru catalogue with point sources in the ACS catalogues by applying constant offsets of in right ascension and declination. The MDFs for the matched subsets are also shown in Fig. 18.
Overall, there is good correspondence between the ACS and Subaru CMDs. The RGB is clearly visible in both CMDs despite the higher background contamination in the ground-based data which dominates in H3H7 at . In H2+H6, the Subaru CMD is missing many of the blue sources at because they lie in highly crowded young stellar associations. The Subaru MDFs have broadly similar shapes as the ACS MDFs, with the caveat that the Subaru completeness is lower in H2+H6 than in H3+H7 because of the higher crowding level. This experiment indicates that our peak metallicities agree with ACS to within 0.2 dex.
5 Quantifying The Global Structure of NGC 2403
Having established the existence of an extended structural component at large radii in NGC 2403, we now construct a composite SB profile which uses diffuse light and resolved star counts in the regions where they are each most reliable. Within the bright optical disc, where the effects of incompleteness on the star counts are most severe, we use the diffuse light because of its insensitivity to these effects. In the outer regions, where the sky background dominates the diffuse light, but where the completeness rate is the highest and varies the least, we use the total star counts, which have a higher contrast over the background than the diffuse light.
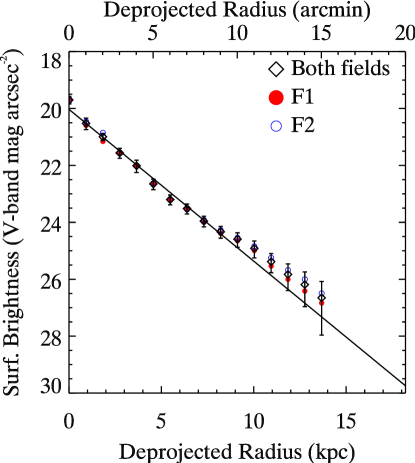
We derived the V-band diffuse light SB profile of NGC 2403 using the IRAF ellipse task with elliptical annuli of constant center, position angle, and inclination after masking saturated stars. In each elliptical annulus, the median pixel value was computed after two clipping iterations. The diamonds in Fig. 19 show the sky-subtracted profile for the average of both fields while the circles show the profile for each field separately. The sky value for each field was estimated from the mode of the pixel histogram, which was 1930 ADU and 2660 ADU in F1 and F2, respectively. These values translate to a sky SB of and . Another method of sky estimation, that involved taking the mean of the median pixel value in 16 3′x3 ′boxes near the edges of the mosaic, gave values 10 ADU and 18 ADU less than the first method, or about 0.9 and 1.5 times the standard deviation of the median pixel box values in F1 and F2, respectively. To be conservative, we adopt the difference between the two methods as the sky uncertainty. The error bars are shown only for the average profile and they include read noise, sky background uncertainty, and the root-mean-square (r.m.s.) deviation of the pixel values in each annulus to account for azimuthal variations due to spiral arms, HII regions, OB associations, and any possible warping of the stellar disc. The median foreground extinction of all point sources, mag, was subtracted from the profiles, but no correction was made for internal extinction.
The best-fit exponential disc (solid line) has a scale-length of kpc, in agreement with the star count profiles in Table 2. The diffuse light profile shows a change to a slightly flatter slope at kpc., which is more pronounced in F2. Inside 4.5 kpc, the scale-length is kpc, which is in good agreement with the value of kpc derived by Okamura et al. (1977) over the same radial range.
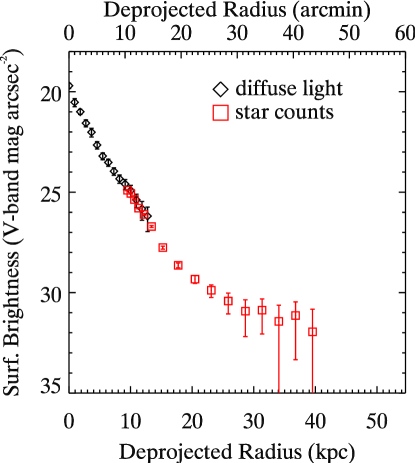
The next step in constructing the SB profile involves merging the star count profile with the diffuse light profile. The conversion of star counts to magnitudes is achieved by the relation , where is the stellar surface density and the zero-point, ZP = 31.32, is estimated from the overlapping region between the star counts and diffuse light. By merging the profiles in this way, we can trace NGC 2403’s SB over a larger radial range than is possible with either profile alone. This is made possible by the much lower sky background attained with the resolved star counts, , more than 7 magnitudes fainter than the diffuse light background.
In Fig. 20, we show the composite SB profile for NGC 2403 made by combining the diffuse light (diamonds) and total star count profiles (squares). The SB profile extends over 12 magnitudes and reaches at kpc and at kpc. Disregarding any contribution from the inner disc beyond 22 kpc, the extended component can be described by an exponential scale-length kpc or a projected power-law () with index .
Merging the diffuse light and star counts assumes that any radial gradient in the colour and luminosity function has a negligible effect on the SB. However, we are primarily concerned with the outskirts of NGC 2403, where the luminosity function is dominated by the RGB and varies relatively little with radius. One other related subtlety is that the star count profiles should be weighted by the -band luminosities of their constituent stars before summing them to make the total profile. We can estimate the magnitude of this effect by scaling the star count profiles by the average V-band luminosities of point sources in their respective CMD boxes. This has the effect of shifting the young star and AGB profiles upward relative to the RGB profiles and slightly steepening the total star count profile scale-length in the region kpc from 2.2 kpc to 2.0 kpc. Thus, we expect that disregarding this effect will have little impact on our results. We also note that correcting for internal extinction in the main gas disc could steepen the profile, as well, but we have chosen not to attempt any correction for this because of the uncertain dust properties in NGC 2403.
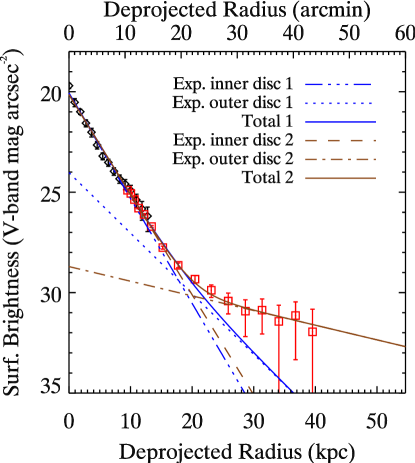
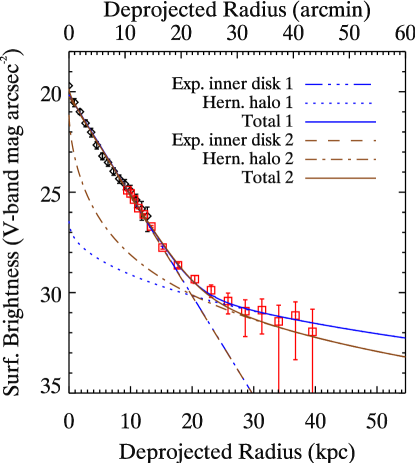
Fig. 21 shows two separate models for NGC 2403’s SB profile which include an exponential inner disc and a spherically-symmetric Hernquist halo. We recall that a Hernquist profile can be characterised by a scale radius, , which is approximately of the half-mass radius and that, for , the projected light profile follows a power-law with exponent (Hernquist, 1990). In the first model, the best-fit exponential inner disc scale-length is kpc and the halo’s scale radius is held fixed at kpc. We use 14.0 kpc as a fiducial value because it was recently estimated for the MW’s halo (Newberg & Yanny, 2006), it lies within the range of kpc found in some theoretical semi-analytic simulations (Bullock & Johnston, 2005), and it provides a reasonable description of M81’s extended component (Barker et al., 2009). If we allow the halo’s scale radius to be free, then its best-fit value is kpc and the disc scale-length is virtually unchanged at kpc. Both values of provide similar fit qualities and yield similar halo luminosities. If we extrapolate the fits out to 50 kpc, then the haloes would contain of the total galactic V-band luminosity, or . Note that the luminosity does not significantly change if extrapolated further out to 100 kpc.
If the extended component is a disc structure, then it would be more appropriate to describe it with a radial exponential profile than a Hernquist profile. We show two different disc plus disc models of the SB profile in Fig. 22. In the first, the scale-length of the extended component is fixed to that of the MW’s thick disc, kpc (Jurić et al., 2008) and the resulting best-fit scale-length of the inner disc is kpc. However inspection of Fig. 22 shows this model clearly fails to explain the excess light beyond 20 kpc. Thus, the scale-length of the extended component could only be as small as the MW’s thick disc if we have grossly underestimated the background or if there is a third structural component that dominates at kpc. In the second model, the extended component’s scale-length is free and its best-fit value is kpc while the best-fit inner disc scale-length is kpc. The V-band luminosity of the outer disc in these two models is of the total.
We conclude from these decompositions that the data can accomodate a wide range of scale radius or scale-length for the extended component given the signal-to-noise ratio and limited radial range of the outer points in the SB profile. Both power-law and exponential fits can be found which provide acceptable fits. The extended component’s -band luminosity is somewhat dependent on the model adopted, particularly on the behaviour of the model inside 20 kpc. If this component exists at all radii, then the range ( of the total) is likely to bracket the true luminosity.
6 Discussion
We have found strong evidence for an extended structure of RGB stars in NGC 2403 which dominates the light profile beyond kpc and has a peak metallicity of [M/H] . This structure has a flatter radial profile than the inner disc, can be reliably traced to kpc and . The radial profile is consistent with a power-law halo or exponential disc and we now discuss these possibilities in more detail.
The MW and M31 have the most thoroughly studied stellar haloes, so they provide a useful baseline for comparison to the extended component in NGC 2403. Although the MW’s stellar halo contains significant amounts of substructure (e.g. Bell et al., 2008), many studies over the years have found that it can be broadly described by a power-law volume density distribution with index 3.0 (see the review by Helmi (2008)). Newberg & Yanny (2006) described the spatial distribution of halo stars with a Hernquist profile with scale radius kpc. The total luminosity of the MW halo was estimated by Carney et al. (1990) to be , which is of the total galactic luminosity of (Sackett, 1997).
Accretion remnants are also observed throughout the halo of M31, but Ibata et al. (2007) found that a subregion of the southern quadrant lacked any substructure and could be fit out to 150 kpc by a Hernquist profile with kpc or an exponential profile with scale-length kpc. Fitting the minor axis profile in regions devoid of spatial substructures, they derived a projected power-law index of . They estimated a total halo -band luminosity similar to the MW’s halo, corresponding to of the total of (de Vaucouleurs et al., 1991).
In their analytic simulations of hierarchical galaxy formation, Purcell et al. (2007) found that the fraction of diffuse halo light increases with host galaxy total mass. The fractional luminosity of the extended component in NGC 2403 is of the same order as the MW and M31 stellar haloes, and higher than the expected value of for a dark matter (DM) halo in the Purcell et al. (2007) simulations. Their simulations had considerable scatter at fixed host galaxy mass reflecting variations in the mass accretion history. Indeed, a fractional luminosity of 1%, on the low end of our estimates, is within the 95% confidence interval for their simulations of haloes with this mass. Given the uncertainties in the mass of NGC 2403’s DM halo and the star formation prescriptions employed in the simulations, these differences are not entirely surprising and cannot be used to exclude the idea that the extended component is a stellar halo. What is more clear is that the extended component in NGC 2403 is less luminous than the MW and M31 haloes, as would be expected if stellar halo luminosity scales with total galaxy luminosity.
The MW halo has a peak metallicity [Fe/H] , or [M/H] for a typical (see the reviews by Helmi (2008) and Geisler et al. (2007)). Several other recent studies have found evidence for an extended halo in M31 with metallicities in the range –0.7 to –1.5 (Reitzel & Guhathakurta, 2002; Kalirai et al., 2006; Chapman et al., 2006; Richardson et al., 2009). Font et al. (2006) and Purcell et al. (2008) found that the stellar halo metallicity in semi-analytic and analytic simulations correlated positively with stellar halo mass. The metallicity we measure for the extended component in NGC 2403 is roughly similar to that in the MW and M31 haloes, but given the precision of our measurement we cannot say with high confidence that it is inconsistent with a halo mass-metallicity relation. Again, it is important to remember that the theoretical simulations predict a spread in halo properties at a given mass depending on the exact details of the accretion history.
The concept of a single well-defined stellar halo in the MW may not be totally accurate. Carollo et al. (2010) found evidence that the MW halo could be divided into two kinematically distinct components, with a flattened inner halo dominating at kpc and a roughly spherical outer halo dominating beyond 20 kpc. The inner halo density distribution had a power-law index and an MDF that peaked at [Fe/H] whereas the outer halo had and a peak [Fe/H] . These results highlight the fact that the inferred properties can depend on the region observed. If the NGC 2403 extended component is a dual-component halo with the same radial divisions as the MW halo, then, because the inner disc dominates the light at small radii, our observations would be most sensitive to the transition zone between the inner and outer haloes and the beginning of the outer halo.
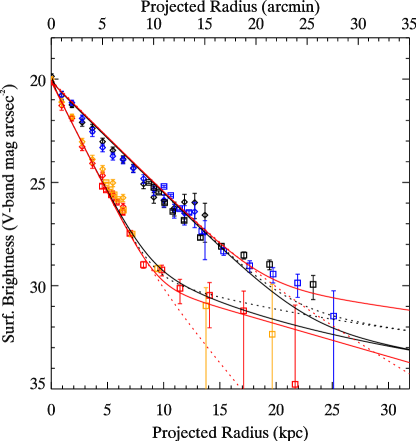
To explore further if the extended component could be a spherically symmetric halo, Fig. 23 plots the SB profile along the major and minor axes (upper and lower points, respectively). These profiles were constructed using circular annuli in -wide wedges centred on each axis. The diamonds and squares show the diffuse light and total star count profiles, respectively. The points are colour-coded so that the north-west major axis is black, south-east major axis is blue, north-east minor axis is red, and south-west minor axis is orange. The black lines show the disc+halo models from §5 with halo scale radius kpc (dotted lines) and 1.3 kpc (solid lines). The red lines show the disc+disc models from §5 with outer disc scale-length kpc (dotted lines) and 15 kpc (solid lines). To overplot the disc models on the minor axis, the radius was divided by the axis ratio of the inner disc. The spherical halo models underpredict the SB on the major axis beyond kpc. The disc+disc model with outer disc scale-length kpc provides the best fit to the major axis profiles. Thus, the data show a clear preference for a flattened geometry for the extended component with a projected axis ratio similar to that of the inner disc.
If it is a disc structure, the extended component may be analagous to the thick discs observed in the MW and edge-on galaxies. Since we lack a full understanding of how thick discs form, it is unclear exactly how their stellar populations should scale with host galaxy mass. The scale-length and luminosity of the extended component in NGC 2403 are longer and smaller, respectively, than those of the MW’s thick disc, which has a radial scale-length of kpc (Jurić et al., 2008; Carollo et al., 2010), and contributes to the MW’s total disc luminosity (Buser et al., 1999; Chen et al., 2001; Larsen & Humphreys, 2003). The extended component’s scale-length is also larger than that of the extended disc and the thick disc in M31, which are kpc and kpc respectively (Ibata et al., 2005; Collins et al., 2011), as well as the thick disc scale-lengths measured by Yoachim & Dalcanton (2006) for edge-on spirals with similar circular velocities. The ratio of outer-to-inner disc luminosities in NGC 2403 is lower than most of their sample, as well. The metallicity of the extended component is lower than the mean metallicity of the MW’s thick disc, [Fe/H] (Gilmore et al., 1995; Robin et al., 1996; Soubiran et al., 2003; Allende Prieto et al., 2006), but is similar to the values of [Fe/H] and found in for the extended and thick discs in M31 (Ibata et al., 2005; Collins et al., 2011). Thick and/or extended disc structures have been hypothesized to form through a variety of processes, including direct accretion, heating of a pre-existing disc and radial migration (e.g. Peñarrubia et al., 2006; Richardson et al., 2008; Schönrich & Binney, 2009; Loebman et al., 2010).
It is not straightforward to compare in detail our results for NGC 2403 with those found for other systems beyond the Local Group. Most wide-field studies published to date have focused on the vertical profiles of highly-inclined systems (Mouhcine et al., 2010; Bailin et al., 2011; Tanaka et al., 2011) while interpretation of the HST and Gemini studies is signficantly complicated by the small FOV coverage (e.g. Tikhonov et al., 2005; Vlajić et al., 2009; Rejkuba et al., 2009). Nonetheless, evidence is mounting for the ubiquitous presence of moderate metallicity stellar envelopes surrounding a variety of galaxy types (e.g. Seth et al., 2005; Mould, 2005; Ibata et al., 2009; Tanaka et al., 2011) and our results for NGC 2403 provide further support for this. One system for which a detailed comparison is possible is the moderately-inclined MW-analogue M81. This system had a close encounter with its two neighbors, M82 and NGC 3077, some Myr ago (Yun et al., 1994; Yun, 1999). Barker et al. (2009) identified an extended stellar component around M81 that could be its halo or an extended disc like that in M31. This component bears some striking differences to the extended component in NGC 2403. Disregarding any contribution from the inner disc, the total star counts beyond kpc had a radial scale-length of kpc and power-law index of . The extended component began to dominate the SB profile at and the implied luminosity was if extrapolated out to 100 kpc over all position angles. There was an RGB visible in the CMD at kpc, which was estimated to have a peak metallicity [M/H] assuming an age of 10 Gyr. In addition, AGB and metal-rich RGB stars were detected out to 40 kpc at surface densities of . The azimuthal star count profile for the metal-poor RGB was somewhat flatter than that for the metal-rich RGB and AGB, suggesting that the extended component was a halo or a more face-on or thicker disc structure.
In contrast, the extended component in NGC 2403 starts to dominate over the disc at a lower SB and the implied luminosity is times less. The radial profile is steeper and there are no detectable AGB or metal-rich RGB stars beyond 30 kpc. The axis ratio of the extended component does not appear significantly different from that of the inner disc out to kpc.
The few similarities that do exist between the M81 and NGC 2403 extended components include the fact that both start to dominate over the bright optical disc at kpc, both have radial profiles flatter than the inner disc, and both are dominated by RGB stars with similar metallicities. Also, the lack of a bulge in NGC 2403 suggests that the presence of an extended component does not require a bulge and that the two components may be unrelated. Indeed, Barker et al. (2009) found that a single -law profile could not fit both M81’s bulge and its extended component.
It is interesting, then, that NGC 2403 so far shows no clear-cut signs of interaction in its stellar or HI distributions yet it still has an extended component that could be a thick disc or halo. Our survey has found no obvious stellar streams or substructures around NGC 2403 that would attest to a significant recent accretion, but structures like the extended tails of RGB stars observed around M33 (McConnachie et al., 2010) would be too faint for us to observe. Regions beyond the area we have surveyed are more likely to contain substructures because of the longer phase mixing timescale there (Johnston et al., 2008).
Finally, we note that the main (inner) exponential disc of NGC 2403 dominates the surface brightness profile to kpc, or scalelengths, and is characterized by a metallicity of [M/H]=–1.0 in its outermost parts. This is reminiscent of NGC 300 where Vlajić et al. (2009) trace the exponential disc to scalelengths (15 kpc) where it has a peak metallicity of [Fe/H] = –0.9. This finding provides further evidence that the stellar discs of spiral galaxies can often be far more extended than commonly thought.
7 Summary
Using Suprime-Cam on the Subaru telescope we have conducted a wide-field imaging survey of RGB stars around the low mass spiral galaxy NGC 2403. These observations represent the first global analysis of RGB stars in a late-type spiral beyond the Local Group. The surveyed area reaches a maximum kpc or kpc. The CMD reaches 1.5 mag below the tip of the metal-poor RGB at a completeness rate for kpc. We detect young stars (ages Myr) out to radii , or kpc.
Using the combination of diffuse light photometry and resolved star counts, we are able to trace the SB profile over a much larger range of radius and magnitude than possible with either technique alone. The exponential disc as traced by RGB stars dominates the SB profile out to disc scale-lengths, or kpc, and reaches a -band SB of . Beyond this radius, we find strong evidence for an extended structural component with a flatter SB profile than the inner disc and which we trace out to kpc and . The extended component’s V-band luminosity integrated over all radii is one to a few percent that of the whole galaxy, depending on assumed profile. At kpc, we estimate a peak metallicity [M/H] assuming an age of 10 Gyr and . The projected axis ratio of the extended component does not appear significantly different from that of the inner disc within kpc.
Possible interpretations for the nature of this component include a inestellar halo or thick disc. Kinematic information for tracer populations would help distinguish whether this component is a rotating disc structure or a pressure-supported halo. There are few, if any, bright AGB stars in this component to act as spectroscopic targets, so we must wait for the next generation of facilities to target the more numerous RGB stars. These results provide further evidence that faint, extended stellar structures appear to be a generic feature of disc galaxies, even isolated late-type systems.
Acknowledgments
MKB and AMNF acknowledge support from a Marie Curie Excellence Grant from the European Commission under contract MCEXT-CT-2005-025869 and a rolling grant from the Science and Technology Facilities Council.
References
- Allende Prieto et al. (2006) Allende Prieto C., Beers T. C., Wilhelm R., Newberg H. J., Rockosi C. M., Yanny B., Lee Y. S., 2006, ApJ, 636, 804
- Bailin et al. (2011) Bailin J., Bell E. F., Chappell S. N., Radburn-Smith D. J., de Jong R. S., 2011, ApJ, 736, 24
- Barker et al. (2009) Barker M. K., Ferguson A. M. N., Irwin M., Arimoto N., Jablonka P., 2009, AJ, 138, 1469
- Bell et al. (2008) Bell E. F., Zucker D. B., Belokurov V., Sharma S., Johnston K. V., Bullock J. S., Hogg D. W., Jahnke K., de Jong J. T. A., Beers T. C., Evans N. W., Grebel E. K., Ivezić Ž., Koposov S. E., Rix H.-W., Schneider D. P., Steinmetz M., Zolotov A., 2008, ApJ, 680, 295
- Brook et al. (2004) Brook C. B., Kawata D., Gibson B. K., Freeman K. C., 2004, ApJ, 612, 894
- Bullock & Johnston (2005) Bullock J. S., Johnston K. V., 2005, ApJ, 635, 931
- Burstein (1979) Burstein D., 1979, ApJ, 234, 829
- Buser et al. (1999) Buser R., Rong J., Karaali S., 1999, A&A, 348, 98
- Cardelli et al. (1989) Cardelli J. A., Clayton G. C., Mathis J. S., 1989, ApJ, 345, 245
- Carney et al. (1990) Carney B. W., Latham D. W., Laird J. B., 1990, AJ, 99, 572
- Carollo et al. (2010) Carollo D., Beers T. C., Chiba M., Norris J. E., Freeman K. C., Lee Y. S., Ivezić Ž., Rockosi C. M., Yanny B., 2010, ApJ, 712, 692
- Chapman et al. (2006) Chapman S. C., Ibata R., Lewis G. F., Ferguson A. M. N., Irwin M., McConnachie A., Tanvir N., 2006, ApJ, 653, 255
- Chen et al. (2001) Chen B., Stoughton C., Smith J. A., Uomoto A., Pier J. R., Yanny B., Ivezić Ž., York D. G., Anderson J. E., Annis J., Brinkmann J., Csabai I., Fukugita M., Hindsley R., Lupton R., Munn J. A., the SDSS Collaboration 2001, ApJ, 553, 184
- Chynoweth et al. (2009) Chynoweth K. M., Langston G. I., Holley-Bockelmann K., Lockman F. J., 2009, AJ, 138, 287
- Collins et al. (2011) Collins M. L. M., Chapman S. C., Ibata R. A., Irwin M. J., Rich R. M., Ferguson A. M. N., Lewis G. F., Tanvir N., Koch A., 2011, MNRAS, 413, 1548
- Cooper et al. (2010) Cooper A. P., Cole S., Frenk C. S., White S. D. M., Helly J., Benson A. J., De Lucia G., Helmi A., Jenkins A., Navarro J. F., Springel V., Wang J., 2010, MNRAS, 406, 744
- Cutri (2003) Cutri R. M. e. a., 2003, NASA/IPAC Infrared Science Archive, 2MASS All Sky Catalog of point sources, http://irsa.ipac.caltech.edu/applications/Gator/
- Dalcanton & Bernstein (2002) Dalcanton J. J., Bernstein R. A., 2002, AJ, 124, 1328
- Dalcanton et al. (2009) Dalcanton J. J., Williams B. F., Seth A. C., Dolphin A., Holtzman J., Rosema K., Skillman E. D., Cole A., Girardi L., Gogarten S. M., 2009, ApJS, 183, 67
- Davidge (2003) Davidge T. J., 2003, AJ, 125, 3046
- Davidge (2007) Davidge T. J., 2007, ApJ, 664, 820
- de Grijs & van der Kruit (1996) de Grijs R., van der Kruit P. C., 1996, A&AS, 117, 19
- de Jong (2008) de Jong R. S., 2008, MNRAS
- de Jong et al. (2008) de Jong R. S., Radburn-Smith D. J., Sick J. N., 2008, in ASP Conf. Ser. 396 ed. J. G. Funes & E. M. Corsini (San Francisco, CA: ASP), GHOSTS — Bulges, Halos, and the Resolved Stellar Outskirts of Massive Disk Galaxies. p. 187
- de Vaucouleurs et al. (1991) de Vaucouleurs G., de Vaucouleurs A., Corwin Jr. H. G., Buta R. J., Paturel G., Fouque P., 1991, Third Reference Catalogue of Bright Galaxies. New York: Springer
- Dolphin (2000) Dolphin A. E., 2000, PASP, 112, 1383
- Dotter et al. (2007) Dotter A., Chaboyer B., Jevremović D., Baron E., Ferguson J. W., Sarajedini A., Anderson J., 2007, AJ, 134, 376
- Ferguson et al. (2007) Ferguson A., Irwin M., Chapman S., Ibata R., Lewis G., Tanvir N., 2007, in Island Universes: Structure and Evolution of Disk Galaxies, ed. R. S. de Jong (Dordrecht: Springer), p. 239
- Ferguson et al. (2002) Ferguson A. M. N., Irwin M. J., Ibata R. A., Lewis G. F., Tanvir N. R., 2002, AJ, 124, 1452
- Font et al. (2006) Font A. S., Johnston K. V., Bullock J. S., Robertson B. E., 2006, ApJ, 646, 886
- Fraternali et al. (2002) Fraternali F., van Moorsel G., Sancisi R., Oosterloo T., 2002, AJ, 123, 3124
- Freedman et al. (2001) Freedman W. L., Madore B. F., Gibson B. K., Ferrarese L., Kelson D. D., Sakai S., Mould J. R., Kennicutt Jr. R. C., Ford H. C., Graham J. A., Huchra J. P., Hughes S. M. G., Illingworth G. D., Macri L. M., Stetson P. B., 2001, ApJ, 553, 47
- Gallart et al. (2005) Gallart C., Zoccali M., Aparicio A., 2005, ARA&A, 43, 387
- Garnett et al. (1997) Garnett D. R., Shields G. A., Skillman E. D., Sagan S. P., Dufour R. J., 1997, ApJ, 489, 63
- Geisler et al. (2007) Geisler D., Wallerstein G., Smith V. V., Casetti-Dinescu D. I., 2007, PASP, 119, 939
- Gilmore et al. (1995) Gilmore G., Wyse R. F. G., Jones J. B., 1995, AJ, 109, 1095
- Greisen & Calabretta (2002) Greisen E. W., Calabretta M. R., 2002, A&A, 395, 1061
- Helmi (2008) Helmi A., 2008, A&A Rev., 15, 145
- Hernquist (1990) Hernquist L., 1990, ApJ, 356, 359
- Ibata et al. (2005) Ibata R., Chapman S., Ferguson A. M. N., Lewis G., Irwin M., Tanvir N., 2005, ApJ, 634, 287
- Ibata et al. (2007) Ibata R., Martin N. F., Irwin M., Chapman S., Ferguson A. M. N., Lewis G. F., McConnachie A. W., 2007, ApJ, 671, 1591
- Ibata et al. (2009) Ibata R., Mouhcine M., Rejkuba M., 2009, MNRAS, 395, 126
- Irwin & Lewis (2001) Irwin M., Lewis J., 2001, NewA Rev., 45, 105
- Irwin (1985) Irwin M. J., 1985, MNRAS, 214, 575
- Irwin (1997) Irwin M. J., 1997, in Espinoza J. M., ed., 7th Canary Islands Winter School Detectors and Data Analysis Techniques for Wide Field Optical Imaging. Cambridge: Cambridge Univ. Pr., p. 35
- Irwin et al. (2004) Irwin M. J., Lewis J., Hodgkin S., Bunclark P., Evans D., McMahon R., Emerson J. P., Stewart M., Beard S., 2004, in Quinn P. J., Bridger A., eds, Society of Photo-Optical Instrumentation Engineers (SPIE) Conference Series Vol. 5493 of Presented at the Society of Photo-Optical Instrumentation Engineers (SPIE) Conference, VISTA data flow system: pipeline processing for WFCAM and VISTA. pp 411–422
- Jablonka et al. (2010) Jablonka P., Tafelmeyer M., Courbin F., Ferguson A. M. N., 2010, A&A, 513, A78+
- Jarrett et al. (2003) Jarrett T. H., Chester T., Cutri R., Schneider S. E., Huchra J. P., 2003, AJ, 125, 525
- Johnston et al. (2008) Johnston K. V., Bullock J. S., Sharma S., Font A., Robertson B. E., Leitner S. N., 2008, ApJ, 689, 936
- Jurić et al. (2008) Jurić M., Ivezić Ž., Brooks A., Lupton R. H., Schlegel D., Finkbeiner D., Krzesinski J., Long D., Neilsen Jr. E. H., Nitta A., Snedden S. A., York D. G., 2008, ApJ, 673, 864
- Kalirai et al. (2006) Kalirai J. S., Gilbert K. M., Guhathakurta P., Majewski S. R., Ostheimer J. C., Rich R. M., Cooper M. C., Reitzel D. B., Patterson R. J., 2006, ApJ, 648, 389
- Karachentsev et al. (2002) Karachentsev I. D., Dolphin A. E., Geisler D., Grebel E. K., Guhathakurta P., Hodge P. W., Karachentseva V. E., Sarajedini A., Seitzer P., Sharina M. E., 2002, A&A, 383, 125
- Larsen & Humphreys (2003) Larsen J. A., Humphreys R. M., 2003, AJ, 125, 1958
- Loebman et al. (2010) Loebman S. R., Roskar R., Debattista V. P., Ivezic Z., Quinn T. R., Wadsley J., 2010, ArXiv e-prints
- Lupton et al. (2004) Lupton R., Blanton M. R., Fekete G., Hogg D. W., O’Mullane W., Szalay A., Wherry N., 2004, PASP, 116, 133
- Malin & Hadley (1997) Malin D., Hadley B., 1997, PASA, 14, 52
- Marigo et al. (2008) Marigo P., Girardi L., Bressan A., Groenewegen M. A. T., Silva L., Granato G. L., 2008, A&A, 482, 883
- Martínez-Delgado et al. (1999) Martínez-Delgado D., Aparicio A., Gallart C., 1999, AJ, 118, 2229
- Martínez-Delgado et al. (2009) Martínez-Delgado D., Pohlen M., Gabany R. J., Majewski S. R., Peñarrubia J., Palma C., 2009, ApJ, 692, 955
- McConnachie (2009) McConnachie A. W., 2009, Nature, 461, 66
- McConnachie et al. (2010) McConnachie A. W., Ferguson A. M. N., Irwin M. J., Dubinski J., Widrow L. M., Dotter A., Ibata R., Lewis G. F., 2010, ApJ, 723, 1038
- Miyazaki et al. (2002) Miyazaki S., Komiyama Y., Sekiguchi M., Okamura S., Doi M., Furusawa H., Hamabe M., Imi K., Kimura M., Nakata F., Okada N., Ouchi M., Shimasaku K., Yagi M., Yasuda N., 2002, PASJ, 54, 833
- Morrison et al. (1997) Morrison H. L., Miller E. D., Harding P., Stinebring D. R., Boroson T. A., 1997, AJ, 113, 2061
- Mouhcine et al. (2010) Mouhcine M., Ibata R., Rejkuba M., 2010, ApJ, 714, L12
- Mould (2005) Mould J., 2005, AJ, 129, 698
- Naylor (1998) Naylor T., 1998, MNRAS, 296, 339
- Neeser et al. (2002) Neeser M. J., Sackett P. D., De Marchi G., Paresce F., 2002, A&A, 383, 472
- Newberg & Yanny (2006) Newberg H. J., Yanny B., 2006, J. Phys.: Conf. Ser., 47, 195
- Okamura et al. (1977) Okamura S., Takase B., Kodaira K., 1977, PASJ, 29, 567
- Peñarrubia et al. (2006) Peñarrubia J., McConnachie A., Babul A., 2006, ApJ, 650, L33
- Purcell et al. (2007) Purcell C. W., Bullock J. S., Zentner A. R., 2007, ApJ, 666, 20
- Purcell et al. (2008) Purcell C. W., Bullock J. S., Zentner A. R., 2008, MNRAS, 391, 550
- Reitzel & Guhathakurta (2002) Reitzel D. B., Guhathakurta P., 2002, AJ, 124, 234
- Rejkuba et al. (2009) Rejkuba M., Mouhcine M., Ibata R., 2009, MNRAS, 396, 1231
- Richardson et al. (2008) Richardson J. C., Ferguson A. M. N., Johnson R. A., Irwin M. J., Tanvir N. R., Faria D. C., Ibata R. A., Johnston K. V., Lewis G. F., McConnachie A. W., Chapman S. C., 2008, AJ, 135, 1998
- Richardson et al. (2009) Richardson J. C., Ferguson A. M. N., Mackey A. D., Irwin M. J., Chapman S. C., Huxor A., Ibata R. A., Lewis G. F., Tanvir N. R., 2009, MNRAS, 396, 1842
- Robin et al. (1996) Robin A. C., Haywood M., Creze M., Ojha D. K., Bienayme O., 1996, A&A, 305, 125
- Robin et al. (2003) Robin A. C., Reylé C., Derrière S., Picaud S., 2003, A&A, 409, 523
- Roškar et al. (2010) Roškar R., Debattista V. P., Brooks A. M., Quinn T. R., Brook C. B., Governato F., Dalcanton J. J., Wadsley J., 2010, MNRAS, 408, 783
- Sackett (1997) Sackett P. D., 1997, ApJ, 483, 103
- Salaris et al. (1993) Salaris M., Chieffi A., Straniero O., 1993, ApJ, 414, 580
- Schlegel et al. (1998) Schlegel D. J., Finkbeiner D. P., Davis M., 1998, ApJ, 500, 525
- Schönrich & Binney (2009) Schönrich R., Binney J., 2009, MNRAS, 399, 1145
- Seth et al. (2005) Seth A. C., Dalcanton J. J., de Jong R. S., 2005, AJ, 130, 1574
- Shang et al. (1998) Shang Z., Zheng Z., Brinks E., Chen J., Burstein D., Su H., Byun Y., Deng L., Deng Z., Fan X., Jiang Z., Li Y., Lin W., Ma F., Sun W., Wills B., Windhorst R. A., Wu H., Xia X., Xu W., Xue S., Yan H., Zhou X., Zhu J., Zou Z., 1998, ApJ, 504, L23+
- Shao et al. (2007) Shao Z., Xiao Q., Shen S., Mo H. J., Xia X., Deng Z., 2007, ApJ, 659, 1159
- Shaw & Gilmore (1990) Shaw M. A., Gilmore G., 1990, MNRAS, 242, 59
- Sirianni et al. (2005) Sirianni M., Jee M. J., Benítez N., Blakeslee J. P., Martel A. R., Meurer G., Clampin M., De Marchi G., Ford H. C., Gilliland R., Hartig G. F., Illingworth G. D., Mack J., McCann W. J., 2005, PASP, 117, 1049
- Soubiran et al. (2003) Soubiran C., Bienaymé O., Siebert A., 2003, A&A, 398, 141
- Stetson (1987) Stetson P. B., 1987, PASP, 99, 191
- Stetson (1993) Stetson P. B., 1993, in Butler C. J., Elliott I., eds, IAU Colloq. 136, Stellar Photometry - Current Techniques and Future Developments Further Progress in CCD Photometry. pp (Cambridge: Cambridge Univ. Press), 291
- Stetson (1994) Stetson P. B., 1994, PASP, 106, 250
- Stetson & Harris (1988) Stetson P. B., Harris W. E., 1988, AJ, 96, 909
- Tanaka et al. (2011) Tanaka M., Chiba M., Komiyama Y., Guhathakurta P., Kalirai J. S., 2011, ArXiv e-prints
- Tikhonov et al. (2005) Tikhonov N. A., Galazutdinova O. A., Drozdovsky I. O., 2005, A&A, 431, 127
- Tsikoudi (1979) Tsikoudi V., 1979, ApJ, 234, 842
- Vlajić et al. (2009) Vlajić M., Bland-Hawthorn J., Freeman K. C., 2009, ApJ, 697, 361
- Vlajić et al. (2011) Vlajić M., Bland-Hawthorn J., Freeman K. C., 2011, ApJ, 732, 7
- Yoachim & Dalcanton (2006) Yoachim P., Dalcanton J. J., 2006, AJ, 131, 226
- Yun (1999) Yun M. S., 1999, in Barnes J. E., Sanders D. B., eds, IAU Symp. 186, Galaxy Interactions at Low and High Redshift Tidal Interactions in M81 Group. Paris: IAU, p. 81
- Yun et al. (1994) Yun M. S., Ho P. T. P., Lo K. Y., 1994, Nature, 372, 530
- Zaritsky (1999) Zaritsky D., 1999, AJ, 118, 2824
- Zibetti & Ferguson (2004) Zibetti S., Ferguson A. M. N., 2004, MNRAS, 352, L6
- Zibetti et al. (2004) Zibetti S., White S. D. M., Brinkmann J., 2004, MNRAS, 347, 556