Radio Galaxy 3C 230 Observed with Gemini Laser-Adaptive-Optics Integral-Field Spectroscopy
Abstract
The Altair laser-guide-star adaptive optics facility combined with the Near-Infrared Integral Field Spectrometer (NIFS) on Gemini North have been employed to study the morphology and kinematics of 3C 230 at , the first such observations of a high-redshift radio galaxy. These suggest a bi-polar outflow spanning 09 ( kpc projected distance for a standard CDM cosmology) reaching a mean relative velocity of in redshifted H[N II] and [S II] emission. Structure is resolved to 01 (0.8 kpc), well correlated with optical images from the Hubble Space Telescope and Very Large Array radio maps obtained at similar spatial resolution. Line diagnostics suggest that over the yr to yr duration of its AGN activity, gas has been ejected into bright turbulent lobes at rates comparable to star formation, although constituting perhaps only 1% of the baryonic mass in the galaxy.
1 Introduction
Feedback from AGNs is favoured in current models of galaxy formation and evolution to explain the flattened upper end of the galaxy mass spectrum (e.g. Silk & Rees, 1998; Benson et al., 2003; Di Matteo et al., 2005; Bower et al., 2006; Croton et al., 2006). A period of rapid star formation is truncated by the AGN heating or removing cold gas via winds, leaving massive galaxies to passively evolve. Evidence of AGN-driven outflows is found in high-redshift radio galaxies (HzRGs), close to the epoch when the bulk of their stars formed. Initial long-slit optical spectrosopy revealed HzRGs surrounded by halos of broad emission-line gas over 10-100 kpc scales (e.g. McCarthy et al., 1996; Villar-Martin et al., 1999, 2003), although the kinematics of the outer parts of these halos may in some cases be quiescent, rotating, or perhaps even in-falling (e.g. MRC 2104-242; Villar-Martin et al., 2006). But recent work aided with integral-field near-infrared (NIR) spectrographs, have shown high-velocity () outflows at kpc scales for and higher redshift RGs (Nesvadba et al., 2006; Reuland et al., 2007; Nesvadba et al., 2008). These HzRGs are witnessed in the throes of ejecting large fractions of their gas () via AGN-driven winds, based on their H luminosities, estimated timescale of AGN activity, and ionization conditions inferred from diagnostic emission-line ratios. A disadvantage of seeing-limited studies, however, is that they lack the spatial resolution needed to study HzRG substructure on sub-kpc scales (1″ kpc at for a km Mpc, , concordance cosmology, which is adopted throughout). Both HST and ground-based adaptive-optics (AO) imaging shows them to be typically a string of compact knots with separations of a few kpc, aligned with the radio axis, and with colors consistent with a young stellar population (e.g. Steinbring et al., 2002; Stockton et al.,, 2004; Zirm et al., 2005). Probing the kinematics and ionization conditions on these scales could decisively find correlations between the radio core, jet, and gas outflow; integral field-units behind AO being a promising new tool.
3C 230 (, Hewitt & Burbidge, 1991) is an excellent HzRG for such a study: it is a powerful radio source (19.2 Jy at 178 MHz; Kellermann et al., 1969) and particularly bright in the near infrared (; Steinbring et al., 2002). It is at the bright edge of the observed relation (Willott et al., 2003), near a galaxy mass-limit of predicted by models (e.g. Rocca-Volmerange et al., 2004). A star ideal for AO guiding is in nearby projection on the sky, and was used to assist and -band imaging on CFHT (Steinbring et al., 2002). Those 024 resolution images were a good match to archival HST WFPC2 F702W optical images and 04 VLA radio maps at 4.8 and 8.4 GHz (Rhee et al., 1996). It is a wide double-lobed RG, with a greatest angular extent of 59 or approximately 51 kpc in projection. For a typical jet-head velocity of 0.1c (within the range 0.01c to 0.2c; Wellman et al., 1997), AGN activity dates back at least yr, but with de-projection and lower jet speed this could be an order of magnitude higher, up to a few yr. The F702W and images discussed by Steinbring et al. are aligned with the radio axis, comprising three marginally resolved sub-components with total . Even so, the overall color (restframe ) is consistent with a stellar population less than 1 Gyr old. The image is more compact than , which could be explained by dust obscuration, with an color also consistent with a young population - implying that most star formation in 3C 230 was intense and brief.
This paper discusses AO observations of 3C 230 obtained with the Near-Infrared Integral Field Spectrometer (NIFS) combined with the Altair laser facility on Gemini North, a first attempt at providing kinematic and line diagnostic information at the same spatial resolution as previous UV continuum imaging with HST and radio maps from the VLA (Steinbring, 2010). These new results - the first laser-AO assisted integral-field spectroscopy on a HzRG - are presented in Section 2 and analyzed along with the available archival data. An inherent disadvantage of studying high- galaxies with AO, generally with small spatial pixels to sample a diffraction-limited point-spread function (PSF), is poor sensitivity to faint nebulous emission. Here the focus is on bright compact features (where AO is most sensitive) and correlating their kinematics with the radio, along with looking for any trend in diagnostic line ratios. Discussion follows in Section 3, pointing to a case of possible AGN-driven outflow at the core of 3C 230.
2 Archival Data, Observations, Reductions and Combined Analyses
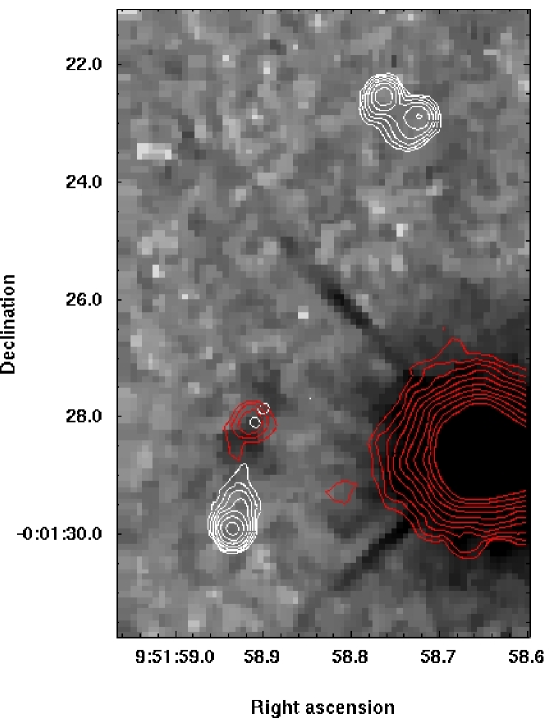
Archival data for 3C 230 are shown in Figure 2; the HST WFPC2 F702W image is overplotted with contours from CFHT -band AO data. The previous AO imaging was facilitated by the relatively bright star ( mag) USNO 0825-07044237 at 09h51m58.554s -00∘01′2819 (J2000.0), 4″ to the west of the galaxy. Comparable resolution VLA A-array maps at 8.4 GHz have since become available (de Koff et al., 2000, data kindly provided by Teddy Cheung) and are overplotted. These radio maps have improved resolution (01) over previous ones and are deeper, detecting the radio core at 9h51m58.90s and -00∘01′2787 (J2000.0), which coincides with the peak of emission in K observed with CFHT. Another, slightly fainter, radio peak 018 away (9h51m58.91,-00∘01′2811) will be discussed in more detail to follow.
2.1 Gemini Laser-Adaptive-Optics Observations
Gemini North observations were obtained on the nights of 23 and 24 April 2008 with the Near-infrared Integral Field Spectrometer (NIFS, McGregor et al., 2003) behind the Altair AO facility in laser-guide-star (LGS) mode (Boccas et al., 2006). During LGS operation, a natural guide star (NGS) is still needed to sense tip and tilt phase errors, although it can be fainter than necessary for full NGS correction (). For 3C 230, the nearby star was ideal for tip-tilt sensing by Altair. Reliable astrometry provided by the previous CFHT AO observations was particularly helpful, as the target faintness and small NIFS field of view (3″ 3″) required offsets to be made “blind.” Individual exposures were 600 s, obtained in a box-dither pattern of 02 diameter, and interleaved with offsets to blank sky, for a total of 6600 s exposure on target. The sky offset was 3″ (to the north of the target) in a sky-target-target-sky pattern. For these small dithers and sky offsets no re-acquisition is necessary, and so overheads are no more than for NGS mode. Non-AO corrected images of standard stars taken immediately before or after observations on both nights indicate near-median seeing conditions ( at ). From previous experience with Altair this is known to translate into stable diffraction-limited performance (-band FWHM of 01 or better) with Strehl ratio - peak intensity relative to that for an ideal diffraction pattern - close to 20%. Anisokinetic error (tip-tilt anisoplanatism) is expected to be negligible due to the small target-to-guidestar offset (Steinbring et al., 2005).
The NIFS grating and filter were used, yielding a spectral resolution of and full-width at half maximum (FWHM) velocity resolution of km . For the faint spectral features observed here, excellent sky subtraction was critical to achieve useful . For a few of the observations no associated sky image was available, due to the telescope being called away for a target-of-opportunity observations. Those observations without an associated sky have been excluded from analysis. The sky-subtracted observations were stacked to produce the data cube using a combination of standard IRAF packages and custom Interactive Data Language (IDL) utilities. Spectra were wavelength calibrated using a spectrum of an arc-lamp, with telluric and flux calibration obtained from spectra of standard stars. Spatial offsets between frames were determined from the commanded telescope offsets. These were found to be repeatable to within an individual pixel (0043) from the observations of standard stars, obtained with an identical dither pattern. Finally, the cube was binned (without any smoothing) in spatial resolution to match the WFPC2 pixels, also very close to the width of a NIFS slice (0103). Smoothing was applied in the spectral dimension, with a Gaussian filter of Å, well matched to the final instrumental resolution.
2.2 Point-Spread Function Comparison
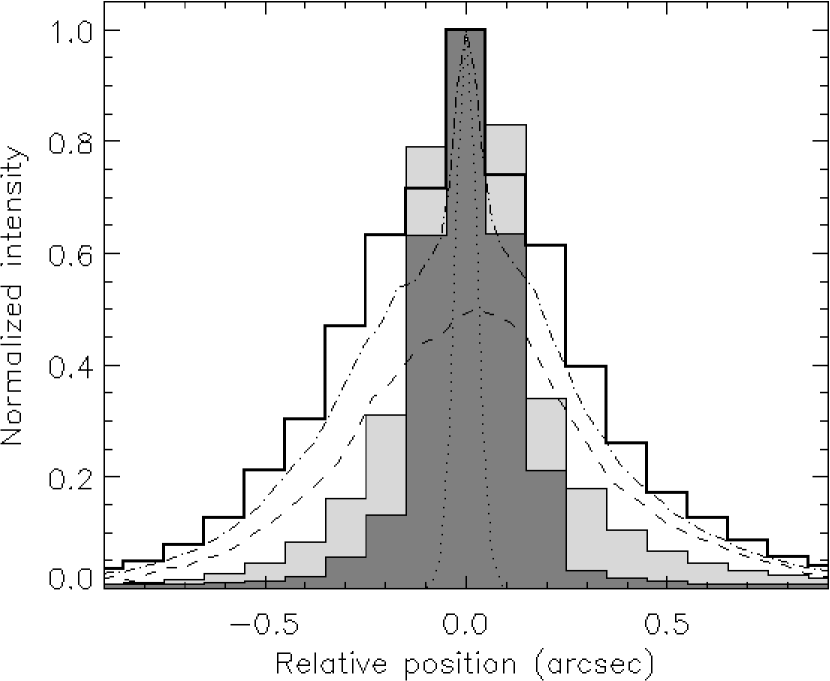
The HST and CFHT point-spread functions (PSFs) were characterized from images of unsaturated stars in the field. For CFHT this was facilitated by short exposures of the AO guide star interleaved with science observations. A difficulty for NIFS is that the field of view was too small for this purpose, which would require repositioning of the telescope back and forth between the science field and the PSF star, thus increasing overhead. Instead, that PSF was estimated from the non-AO observations of the telluric calibration star by employing a simple model of AO correction in which scattered flux is effectively removed from the seeing-limited halo and transferred into a diffraction-limited core.
The following method for applying the AO PSF model was used, comparable to that in Steinbring et al. (2005). The NIFS PSF was assumed to have two parts: a diffraction-limited core represented by a Nyquist-sampled Gaussian distribution, and the observed seeing-limited halo. These were added in proportion, with the diffraction-limted core given a Strehl ratio , and the halo receiving the remainder, . That the broad shape of this halo is not significantly affected by the AO system is a property of the finite number of actuators across the telescope pupil. This limits the greatest angle within which AO can re-direct the light from the halo inwards to be an “outer working angle” of , where is the physical size of an actuator and is the observed wavelength. At m for Altair, with 12 actuators across the pupil giving m, this angle is 025. Outside this angle the AO PSF is therefore well defined by the -band seeing disk. The results for % are shown in Figure 1 as profiles along the central NIFS slice centered on the star, and across the peak pixel of the HST and CFHT PSF (after sub-pixel recentering) all sampled to the HST pixel scale. For comparison, the result for % is shown (at the NIFS pixel scale) which, according to the exposure time calculator available on the Gemini webpage, would be the best correction possible under 20-percentile seeing. The two key implications are that the resolution of NIFS imaging is likely to be as good or better than HST and CFHT, although that is not strongly dependent on Strehl ratio, and that the wings of the PSF are somewhat broader. At least 30% of flux falls outside a radius of , with an upper limit of perhaps 50%.
So although the NIFS PSF core is narrower than one IFU slice, its halo will still lead to cross-talk: contamination in the spectral dimension of the datacube by light from nearby spatial pixels. For the faint galaxy spectra discussed here, a minimal spatial binning of was found to provide sufficient . Although not implemented, improvement might come from employing PSF deconvolution. However, a more sophisticated treatment of the AO system with better constraints on its performance - and the seeing - would be needed to decouple adjacent spectra, especially those separated by more than and less than . It is evident that care is needed in interpreting the photometry and spectroscopy of the AO NIFS data on these spatial scales, and that knowledge guided the analysis to follow.
2.3 Synthetic Narrow-Band Images
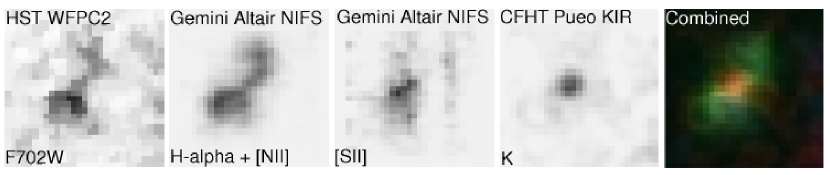
To begin, synthetic narrow-band images, 30 nm wide, were produced from the NIFS datacube. These were centered on the only two prominent redshifted lines in -band: H (later shown to be blended with [N II] 6548 and 6583) and the [S II] 6716, 6731 doublet. These narrow-band images are displayed in Figure 2, along with insets of the archival HST and CFHT AO images. A “true-color” image is also shown, using the combination of H[N II] and [S II] to represent green; HST, blue and CFHT AO, red. The galaxy is clumpy, running along a central spine southwest to northeast aligned with the radio lobes, ending in broader tails with a total span of 24. The emission-line images indicate narrow jet-like structures with bends, possibly shock-fronts at the edge of an expanding bubble, or edge brightening. If due to star formation, then these linear structures would necessarily be young, as they would not be dynamically stable over yrs, and there is no evidence from the image of the galaxy being edge-on.
In general, the UV/optical morphology of 3C 230 exibits the well-known “alignment effect” (McCarthy et al., 1987; Chambers et al., 1987) possibly associated with recent star-formation induced by the jet. Another mechanism contributing to the extended component could be scattered AGN light, either from electrons or dust. The total flux in band from CFHT AO is erg , and the sum of Gemini NB images is erg , or approximately 11% of total H-band flux. Based on the composite spectrum of McCarthy (1993) it seems the -band continuum is typical of other HzRGs, for which H by itself should constitute perhaps 13% of emission in . Another contributor might be nebular thermal continuum, an extreme case of which is represented by 3C 368 in which only 20% of the UV continuum could be due to other sources (Stockton, et al., 1996). But the color of 3C 230 suggests that much of its continuum flux of erg would be from young stars. Of course, for the redshift of 3C 230 F702W falls below the 4000 Å break, and so is subject to emission-line contamination, e.g. by Mg II 2800, which may also contribute. This would also imply the star-formation is not as young as it appears from its color. Even so, the CFHT image shown in Figure 2 would be expected to better map the true stellar content, and its color also suggests a contribution by young stars, with a flux of erg equivalent to 37% of the -band flux, including . Thus 3C 230, as with other HzRGs, has an extended UV/optical morphology which may come from a combination of sources, although it is possibly dominated by stellar light in band.
2.4 Spectra
Next, spectra were extracted from the NIFS datacube. The centroid and width of both H[N II] and [S II] were found with two methods: by the FWHM of the peak spectral pixel, and by attempting multiple Gaussian fits to the line. The results of these methods are comparable, although the first was more robust, probably because binning the pixels spatially and already smoothing with a Gaussian kernel spectrally has improved the , with a good match to the instrumental resolution. Choosing a minimum acceptable of about 50% of peak flux in the entire image worked best.
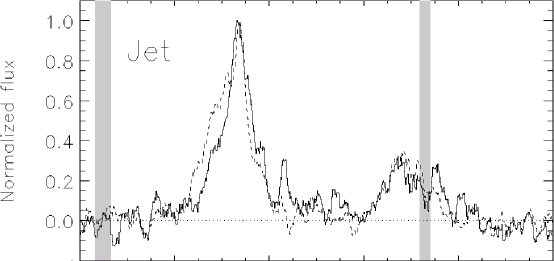
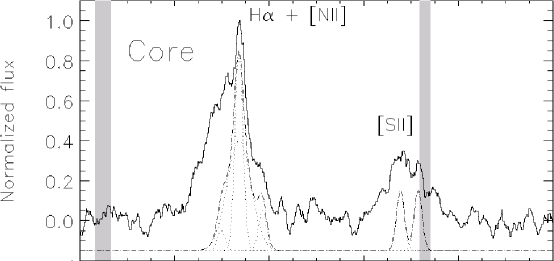
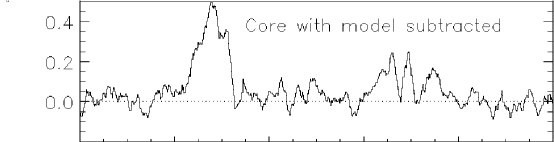
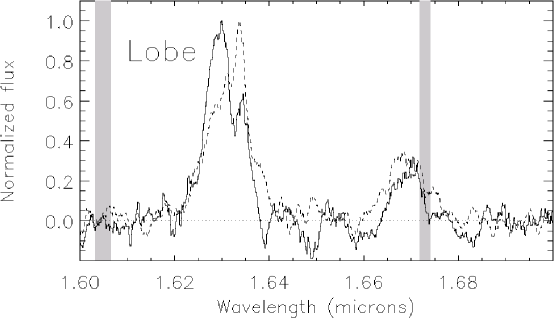
Results are shown in Figure 3, with continuum subtracted. The spectrum for the central pixel (03 03) region centered on the CFHT image is labeled the ‘Core’. The Gaussian model (dot-dashed curve) is overplotted; a composition of unresolved narrow lines [N II] 6548, 6583; and [S II] 6716, 6731 and H; plus a broader (120 km/s) H component (dotted curves) perhaps indicating weak underlying broadline emission. The mean H[N II] centroids gives a systemic galaxy redshift of , corrected to the solar rest frame (using the IRAF task rvcorrect). A maximal line ratio of [N II]/H, determined at the blended “shoulder” (providing total luminosity ) is in the range typical of low-redshift RGs and Seyfert 2s (Veilleux & Osterbrock, 1987), as is the mean [S II] to H[N II] line-ratio of 0.45 ([S II]/H+[N II]), both well above the “maximal starburst” limit for ionization attributable solely to H II regions or a starburst galaxy (-0.4; Kewley et al.,, 2006). The latter is comparable to what Nesvadba et al. (2006) find for the narrow-line region of the RG MRC 1138-262, as is a fit of [S II]/[S II] for the approaching gas, although a strong skyline leads to poor telluric correction in the red tail of the doublet (shaded region). The residual after subtraction of the model is provided below, demonstrating a good fit redward of 1.63 m and an unsubtracted component blueward. Although not shown here, restricting the radius of the ‘Core’ region does not improve this residual. This is expected, however, due to contamination by the brightest H+[N II] emission, which is less than 05 away (See Section 2.2). Spectra at those two individual pixels corresponding to the highest receding and approaching H velocities are displayed in the top and bottom panels, respectively of Figure 3. For comparison, the ‘Core’ spectrum is overplotted as a dashed curve. A feature in the receding spectrum (top) is a narrow line at 1.643 m, which would correspond to [N II] 6583 receding 920 km relative to the systemic galaxy redshift. Possibly this is a secondary, higher velocity component of [N II] emission along that line of sight, and the weaker part of the doublet is masked. That interpretation is adopted here, and due to a direct correlation with the radio structure at this spatial pixel (discussed later) this position is given the label ‘Jet’. In the approaching spectrum (bottom) the shape of H[N II] is broadened due to turbulence, and is here labeled ‘Lobe’.
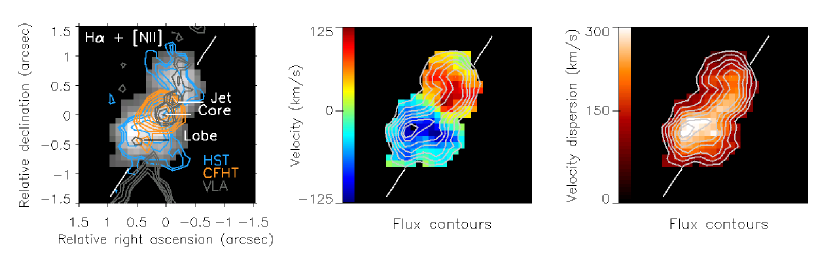
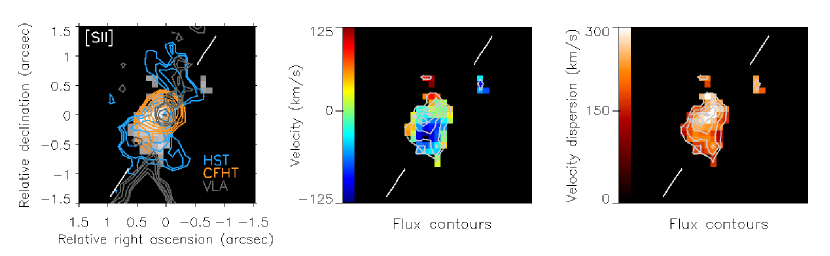
2.5 Pixel-by-Pixel Correlations Between All Datasets
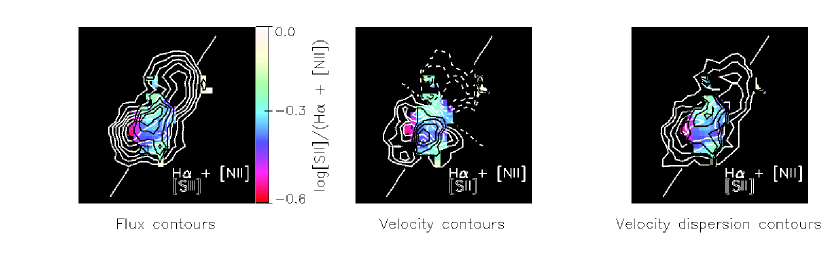
Finally, results are shown in Figure 4 for spectra extracted in every spatial pixel: maps of intensity, velocity and velocity dispersion - the last after subtracting the instrumental resolution in quadrature. The intensity maps are overplotted with contours from HST, CFHT, and VLA. The white hashes indicate the orientation of the radio jet defined by the alignment of the VLA radio core and the next brightest peak. Below are shown the (logarithmic) line ratios of H[N II] and [S II] in each pixel, overplotted with their flux, velocity and velocity dispersion contours. Note the relative fluxes of [S II] and H[N II]. Faint [S II] fluxes at some high recessional velocities (corresponding to the northeast part of the galaxy) are due in part to the superposition of a sky line, but could also be plausibly due to some differential reddening in the galaxy itself, screening weaker [S II] along its receding, northern half.
Correlations between the radio map, kinematics, and line ratios are particularly evident at the three locations discussed above, labeled in Figure 4 as:
-
Jet
The second brightest VLA radio knot, corresponding to the highest recessional velocity observed in H[N II]. From here a fainter radio structure extends to the north, comparable to the HST and Gemini images;
-
Core
The position of the brightest VLA radio knot, which is coincident with the kinematic center in the H[N II] and [S II] emission, and the maximum velocity dispersion in [S II]. It is also the narrowest point along the central spine of the HST image, and corresponds to the centroid of the CFHT image;
-
Lobe
The peak in H[N II] emission, coincident with both its maximum approach velocity and velocity dispersion. Notably, [S II] is weak here, leading to a trough in [S II] to H line ratio. The [S II] maximum approach velocity falls a projected distance of kpc to the west, closer to a faint knot of radio emission, just at the detection limit of the VLA map. This is also the terminus of a “tail” in the CFHT image - components ‘b’ and ‘c’ in Steinbring et al. (2002).
3 Discussion and Summary
A combination of processes are possibly responsible for the strong correlation of UV, optical and radio emission in 3C 230: scattered AGN light, nebular thermal emission, and past or active star formation. Certainly the radio jet plays a role in shaping this morphology. That is consistent with a picture of asymmetric pressure and gas content in RG host galaxies (see e.g. Miley & De Breuck, 2008, and references therein); the asymmetry of the 3C 230 radio source is mirrored in the optical surface brightness, and in the strong turbulence in the direction of the shorter radio arm to the southwest. And in favor of this contributing to star formation is that, despite being a powerful radio source, 3C 230 exhibits a relatively low velocity for the bulk of its gas. Other HzRGs, for example those discussed by Nesvadba et al., generally have higher velocities and line widths.
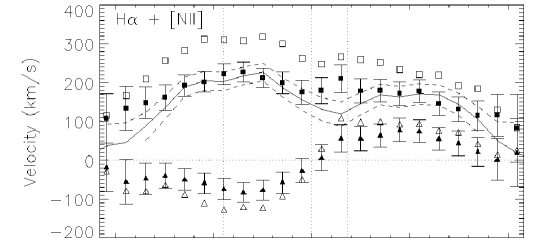
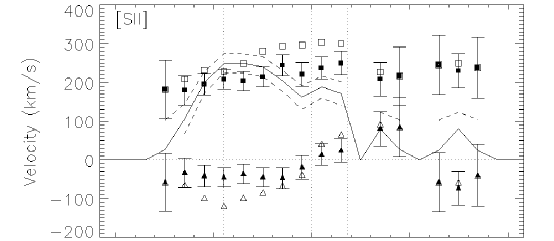
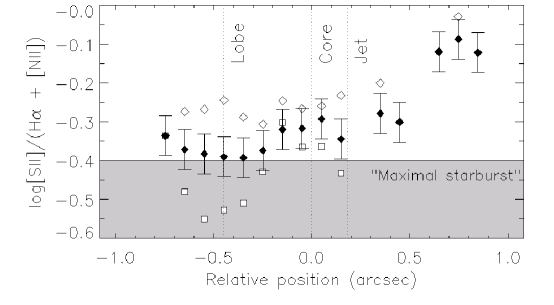
Transitions in velocity and line ratio between the three key locations along the radio axis - ‘Core’, ‘Jet’, and ‘Lobe’ - can be interpreted as AGN-driven outflow. Figure 5 shows the correspondence in more detail. These are the velocities (triangles) and velocity dispersions (squares) averaged in one-pixel-wide bins transverse to the radio axis (the white hash-marks in Figure 4). Error bars indicate 1- uncertainties at each position. Open symbols indicate the maxima at each position. Velocity (measured with H[N II]) increases sharply from rest to a peak at the ‘Jet’ location, to the northwest. Note the symmetry of the velocity field along the radio axis, although less obvious for [S II] at receding velocities. In the opposite direction from the ‘Core’, a narrow ridge of bright emission runs towards the southeast, broadening and smoothly transitioning from high velocity dispersion in [S II] to high velocity dispersion in H[N II]. The end of this ridge is the ‘Lobe’ position, a point where maximum velocity dispersion in H is reached (open squares, after subtracting the velocity dispersion in [S II]) - a stellar clump left in the wake of the passing jet, or possibly by shocks at the edge of an expanding bubble. Note that the position of maximum velocity as seen in [S II] is not coincident with H[N II] (see Figure 4), the impression being that the jet (at least the region with higher [SII]/H[N II] line ratio) has moved to the west. Restframe optical and UV images are consistent with this view: the CFHT image (restframe , stellar continuum) has a faint component near the ‘Lobe’ position, with a bluer knot in the HST F702W (restframe ) to the west.
The kinematics are indicative of a bi-polar flow, which to the southeast possibly ends in a region of young stars at the ‘Lobe’ position. Although the mass distribution is clearly elongated, within a radius of 045 kpc from the position of the ‘Lobe’, a velocity dispersion of km and the virial theorem would imply an enclosed mass of
( for 12, centered at ‘Core’). The K-band flux in the ‘Lobe’ is about 20% of the galaxy total (CFHT AO magnitude of ‘b’; Steinbring et al., 2002) so just as an order of magnitude estimate it represents at most a baryonic mass of , for uniform dark-matter content. This would have an escape velocity of
However, the diluted mass distribution may reduce escape velocities far from the galaxy center. A simple argument for a lower limit is that since the approximately 045-long distribution is resolved, it is no thinner than 1 pixel, which if that mass () were isolated, would have an escape velocity of
Again, it should be emphasized that these are just order of magnitude estimates. But to further illustrate that this provides a plausible picture, overplotted in Figure 5 is the average flux along the radio axis (solid curve, with an arbitrary normalization) and its relative photometric uncertainty (dashed, assuming only Poisson noise). The mean velocity dispersion in H is well matched by a mass-follows-light estimate of the luminosity, with peak velocities in the turbulent regions approaching , but still well below the escape velocity of the galaxy.
It is interesting to calculate a limit to the bulk flow of gas, and compare that to a potential star formation rate in 3C 230. Carrying on with simple order-of-magnitude estimates, neglecting any contribution from (isotropic) stellar winds, and assuming a continuous maximal jet velocity of , the flow has been underway for
comparable to the expected duration of AGN activity based on the separation of the radio lobes. Following closely the analysis in Nesvadba et al. (2006) of MRC 1138-262, also with a ratio of [SII]/[S II], 3C 230 may exhibit a similar “partially ionized zone” case, with electron densities of and temperature K. A luminosity of erg , all from recombination-line flux of hydrogen, might be at most a gas mass of (e.g., Osterbrock, 1989, case-B recombination)
for in units of and in units of . This is roughly of the stellar mass in the ‘Lobe’ (overestimated in Steinbring, 2010, prior to reducing the doublet). The flow is too slow to escape the galaxy entirely, instead redistributing gas during the period of jet activity, and if continuously, at a rate of
Of course, this would be for all H flux coming from AGN-ionized gas. On the other hand, assuming the Kennicutt et al. (1994) relation for star-formation from H luminosity, if it were all from young stars this might be at most
Bringing the argument full circle, this represents at most , less than 1% of the galaxy mass. That the rates in equations 6 and 7 are comparable does not imply a balance between the two H-emission/ionization scenarios (they are both maxima, and so mutually exclusive) although that would be intriguing. But it may at least hint at the close relationship between AGN outflow and star-formation - a mixture of ionization states also being consistent with the trend in line-ratios along the jet axis of 3C 230.
In conclusion, star formation may be on-going in 3C 230 but it does not constitute a significant fraction of the galaxy mass. And as 3C 230 is among those RGs at the bright edge of the relation, and already massive, perhaps this is an example of how AGNs regulate growth: balancing outflow with modest star formation. Further laser-AO spectroscopy in -band - allowing an additional line-ratio of [O III]/H - would help differentiate between ionization scenarios on a pixel-by-pixel basis near the AGN, resolving some of the ambiguity in flow-rate versus stellar content, and star-formation history. Spectropolarimetric measurements could also help in this regard by quantifying the fraction of light scattered into the observed line of sight. This study of 3C 230 is a demonstration, a first attempt at laser-AO 2-dimensional spectroscopy of a high- radio galaxy where existing HST and radio maps are available at comparable spatial resolution. For Gemini Altair NIFS, five other such targets are possible, and data for one of those now in hand (4C+41.17) will be discussed in a later paper.
References
- Benson et al. (2003) Benson, A.J., Bower, R.G., Frenk, C.S., Lacey, C.G., Baugh, C.M., & Cole, S. 2003, ApJ, 599, 38
- Best et al. (1996) Best, P.N., Longair, M.S., & Roettgering, H.J.A. 1996, MNRAS, 280, L9
- Boccas et al. (2006) Boccas, M., Rigaut, F., Bec, M., Irarrazaval, B., James, E., Ebbers, A., d’Orgeville, C., Grace, K., Arriagada, G., Karewicz, S., Sheehan, M., White, J., & Chan, S. 2006, Proc. SPIE, 6272, 114
- Bower et al. (2006) Bower, R.G., Benson, A.J., Malbon, R., Helly, J.C., Frenk, C.S., Baugh, C.M., Cole, S., & Lacey, C.G. 2006, MNRAS, 370, 645
- Chambers et al. (1987) Chambers, K.C., Miley, G.K, & van Breugel, W.J.M. 1987, Nature, 329, 604
- Croton et al. (2006) Croton, D.J., Springel, V., White, S.D.M., De Lucia, G., Frenk, C.S., Gao, L., Jenkins, A., Kauffmann, G., Navarro, J.F., & Yoshida, N. 2006, MNRAS, 365, 11
- de Koff et al. (2000) de Koff, S., Best, P., Baum, S.A., Sparks, W., Röttgering, H., et al. 2000, ApJS, 129, 33
- Di Matteo et al. (2005) Di Matteo, T., Springel, V., & Hernquist, L. 2005, Nature, 433, 604
- Ferrarese & Merritt (2000) Ferrarese, L., & Merritt, D., 2000, ApJ, 539, L9
- Gebhardt et al. (2000) Gebhardt, K., Bender, R., Bower, G., Dressler, A., Faber, S.M., Filippenko, A.V., Green, R., Grillmair, C., Ho, L.C., Kormendy, J., Lauer, T.R., Magorrian, J., Pinkney, J., Richstone, D., & Tremaine, S. 2000, ApJ, 539, 13
- Hewitt & Burbidge (1991) Hewitt, A. & Burbidge, G. 1991, ApJS, 75, 297
- Kellermann et al. (1969) Kellerman, K.I., Pauliny-Toth, I.I.K., & Williams, P.J.S. 1969, ApJ, 157, 1
- Kennicutt et al. (1994) Kennicutt, R.C., Jr., Tamblyn, P., & Congdon, C.E. 1994, ApJ, 435, 22
- Kewley et al., (2006) Kewley, L.J., Groves, B., Kauffmann, G., & Heckman, T. 2006, MNRAS, 372, 961
- Magorrian et al. (1998) Maggorian, J., Tremaine, S., Richstone, D., Bender, R., Bower, G., Dressler, A., Faber, S.M., Gebhardt, K., Green, R., Grillmair, C., Kormendy, J., & Lauer, T. 1998, AJ, 115, 2285
- McCarthy et al. (1987) McCarthy, P.J., van Breugel, W.J.M., Spinrad, H., & Djorgovski, S. 1987, ApJ, 321, L29
- McCarthy (1993) McCarthy, P.J. 1993, ARA&A, 31, 639
- McCarthy et al. (1996) McCarthy, P.J., Baum, S.A., Spinrad, H. 1996, ApJS, 106. 281
- McGregor et al. (2003) McGregor, P.J., Hart, J., Conroy, P.G., Pfitzner, M.L., Bloxham, G.J., Jones, D.J., Downing, M.D., Dawson, M., Young, P., Jarnyk, M., & Van Harmelen, J. 2003, Proc. SPIE, 4841, 1581
- Miley & De Breuck (2008) Miley, G., & De Breuck, C. 2008, The Astron. and Astrophys. Rev., 15 (2), 67
- Nesvadba et al. (2006) Nesvadba, N.P.H., Lehnert, M.D., Eisenhauer, F., Gilbert, A., Tecza, M., & Abuter, R. 2006, ApJ, 650, 693
- Nesvadba et al. (2008) Nesvadba, N.P.H., Lehnert, M.D., De Breuck, C., Gilbert, A.M., & van Breugel, W. 2008, Astron. Astrophys., 491, 407
- Osterbrock (1989) Osterbrock, D.E., 1989, Astrophysics of Gaseous Nebulae and Active Galactic Nuclei (Mill Valley; Univ. Science Books)
- Reuland et al. (2007) Rueland, M., van Breugel, W., de Vries, W., Dopita, M.A., Dey, A., Miley, G., Roettgering, H., Venemans, B., Stanford, S.A., Lacy, M., Spinrad, H., Dawson, S., Stern, D., & Bunker, A. 2007, AJ, 133, 2607
- Rees & Ostriker (1977) Rees, M.J. & Ostriker, J.P. 1977 MNRAS, 179, 541
- Rhee et al. (1996) Rhee, G., Marvel, K., Wilson, T., Roland, J., Bremer, M., Jackson, N., & Webb, J. 1996, ApJS, 107, 175
- Rocca-Volmerange et al. (2004) Rocca-Volmerange, B., Le Borgne, D., De Breuck, C., Fioc, M., & Moy, E. 2004, Astron. Astrophys., 415, 931
- Silk & Rees (1998) Silk, J., & Rees, M. J. 1998, Astron. Astrophys., 331, L1
- Steinbring et al. (2002) Steinbring, E., Hutchings, J.B., & Crampton, D. 2002, ApJ, 569, 611
- Steinbring et al. (2005) Steinbring, E., Faber, S.M., Macintosh, B.A., Gavel, D., Gates, E.L. 2005, PASP, 117, 847
- Steinbring (2010) Steinbring, E. 2010, IAU Symp. 267, 407
- Stockton et al., (2004) Stockton, A., Canalizo, G., Nelan, E. P., & Ridgway, S.E. 2004 ApJ, 600, 626
- Stockton, et al. (1996) Stockton, A., Ridgway, S.E., & Kellogg, M. 1996, AJ, 112, 902
- Veilleux & Osterbrock (1987) Veilleux, S. & Osterbrock, D.E. 1987, ApJS, 63, 295
- Villar-Martin et al. (1999) Villar-Martín, M., Binette, L., & Fosbury, R.A.E. 1999, Astron. Astrophys., 346, 7
- Villar-Martin et al. (2003) Villar-Martín, M., Vernet, J., di Serego Alighieri, S., Fosbury, R., Humphrey, A., & Pentericci, L. 2003, MNRAS, 346, 273
- Villar-Martin et al. (2006) Villar-Martín, M., Sánchez, S. F., De Breuck, C., Peletier, R., Vernet, J., Rettura, A., Seymour, N., Humphrey, A., Stern, D., di Serego Alighieri, S., & Fosbury, R. 2006, MNRAS, 366, 1
- Wellman et al. (1997) Wellman, G.F., Daly, R.A., & Wan, L. 1997, ApJ, 480, 96
- Willott et al. (2003) Willott, C.J., Rawlings, S., Jarvis, M.J., Blundell, K.M. 1993, MNRAS, 339, 173
- Zirm et al. (2005) Zirm, A.W., Overzier, R.A., Blakeslee, J.P., Clampin, M., et al. 2005, ApJ, 630, 68