What are Published X-ray lightcurves telling us about Young Supernova Expansion?
Abstract
Massive stars lose mass in the form of stellar winds and outbursts. This material accumulates around the star. When the star explodes as a supernova (SN) the resulting shock wave expands within this circumstellar medium. The X-ray emission resulting from the interaction depends, among other parameters, on the density of this medium, and therefore the variation in the X-ray luminosity can be used to study the variation in the density structure of the medium. In this paper we explore the X-ray emission and lightcurves of all known SNe, in order to study the nature of the medium into which they are expanding. In particular we wish to investigate whether young SNe are expanding into a steady wind medium, as is most often assumed in the literature. We find that in the context of the theoretical arguments that have been generally used in the literature, many young SNe, and especially those of Type IIn, which are the brightest X-ray luminosity class, do not appear to be expanding into steady winds. Some IIns appear to have very steep X-ray luminosity declines, indicating density declines much steeper than r-2. However, other IIns show a constant or even increasing X-ray luminosity over periods of months to years. Many other SNe do not appear to have declines consistent with expansion in a steady wind. SNe with lower X-ray luminosities appear to be more consistent with steady wind expansion, although the numbers are not large enough to make firm statistical comments. The numbers do indicate that the expansion and density structure of the circumstellar medium must be investigated before assumptions can be made of steady wind expansion. Unless a steady wind can be shown, mass-loss rates deduced using this assumption may need to be revised.
keywords:
circumstellar matter; stars: massive; stars: mass-loss; supernovae: general; stars: winds, outflows; X-rays: ISM1 Introduction
In 1972, in a review article on supernova remnants (SNRs), Woltjer (1972) did not devote much attention to the ambient medium into which the SN was expanding, suggesting that the “importance of the swept-up matter is comparatively minor” in the ejecta-dominated stage, as “everything depends on the details of the explosive process”. Chevalier (1977) also considered the interaction of SNRs only with the interstellar medium. However, by 1982 the idea appears to have been established that core-collapse supernovae (SNe) expand not into the interstellar medium but the wind-blown circumstellar medium (CSM) ejected by the progenitor star. Chevalier (1982a, b) derived self-similar solutions for this interaction. Since then this concept has been widely tested and accepted, so much so that nowadays it is commonly accepted that young core-collapse SNe expand into the wind-blown structures created by their progenitor stars, and the resulting X-ray emission is due to the forward and reverse shocks interacting with the ambient medium (Chevalier & Fransson, 1994).
The wind from a star is defined basically by two parameters, the mass-loss rate and the wind velocity. If these parameters are constant it is referred to as a steady wind. Another common paradigm that frequently now appears in the literature is that young core-collapse SNe are expanding into steady winds. This has been used to compute the mass-loss rates of X-ray supernovae (Immler & Lewin, 2003; Immler & Kuntz, 2005), and especially optical SNe (Smith et al., 2008; Smith et al., 2010; Kiewe et al., 2010). In very few cases has an attempt been made to determine whether the wind is in fact steady, and some of the calculations were shown to be inconsistent in this respect with the results obtained (Dwarkadas, 2011). However, a steady wind is a reasonable approximation that makes analytical calculations possible, whereas the alternative is to do much more complicated calculations which may not even be possible without substantially more data.
A steady wind with a constant mass-loss rate () and wind velocity () results in a density . The density profile thus evolves as r-2. If the wind parameters vary with time, the density profile would deviate from an r-2 evolution. Thus by determining the nature of the density profile into which young core-collapse SNe are expanding, one could infer the variation in wind parameters (if any), and the nature of the progenitor mass-loss. Supernova expansion into the surrounding medium allows a natural probe into the density structure of this medium. Since the SN expansion velocity can be about 10-1000 times the velocity of the surrounding medium, depending on whether the progenitor was a Wolf-Rayet (W-R) star or a red supergiant (RSG) star, the SN ejecta allows us to probe 10-1000 years of wind evolution in 1 year of SN evolution.
The X-ray emission resulting from the circumstellar interaction is proportional to the density structure (see §2), and therefore the evolution of the X-ray light curve can be used to probe the variations in density structure in the ambient medium. Chevalier (1982b) studied the X-ray emission from core-collapse SNe, and formulated an expression for their X-ray luminosity in terms of the evolutionary parameters. This has since been used to describe the X-ray light curves of SNe. Schlegel (1995) reviewed X-ray observations of all 5 X-ray SNe known till that time. The pace of discovery has picked up with the advent of Chandra, XMM-Newton and Swift, with Immler & Lewin (2003) listing 15 SNe, Schlegel (2006) having 25 on his list, and Immler (2007) listing 32 SNe. 111 An extremely useful compilation of X-ray SNe, maintained by Dr. Stefan Immler, is available at the following web site: lheawww.gsfc.nasa.gov/users/immler/supernovae_list.html
In this paper we aim to use published X-ray light-curves of SNe to explore the nature of the medium into which they are evolving. We will explore what can be learned from X-ray light curves in §2, and the limitations of this technique. In the next section 3 we show the lightcurves of X-ray SNe and fits to the data, and discuss the resulting implications. We analyze these results for individual SNe and SNe types in §4. Finally, in §5 we summarize our results and discuss their consequences.
2 What can we learn from X-ray light-curves of SNe?
A very thorough discussion of the evolution of the X-ray light curve from young SNe was carried out by Fransson et al. (1996), in reference to SN 1993J. In this discussion, and throughout this paper, we will make use of many of the results described therein. For the sake of completeness, we present here a simplified analysis with basic results that develops and summarizes the most important ideas. This summary follows the description given in Dwarkadas et al. (2010).
The expansion of a SN shock wave into the ambient medium gives rise to a forward and reverse-shocked structure, separated by a contact discontinuity (Chevalier, 1982a). The shocks heat up the medium to high temperatures, producing X-ray emission. The X-ray luminosity from a source depends on the electron density , the emitting volume and the cooling function
| (1) |
The density of the medium into which the SN shock wave is expanding is assumed to go as , with s=2 for a steady wind. The emission arises from a thin shell of radius in between the forward and reverse shocks, at a mean radius , whose volume can be expressed as . Although the wind may not have been steady, the evolution will be self-similar as long as both the SN ejecta and the circumstellar medium density profiles are described by power-laws (Chevalier, 1982a). In the self-similar case, , and therefore . For a SN in the early stages, the post-shock temperature is going to be much larger than 107K, and the cooling function is assumed to vary as (Chevalier & Fransson, 1994). For a strong shock, , and therefore the cooling function in the self-similar case.
Therefore we get
| (2) |
which gives
| (3) |
For s=2 this gives the well-known result that the emission decreases inversely with time, . This result is inherent in the formula for mass-loss derived by Immler & Lewin (2003).
In the self-similar case, with and , the radius of the SN will evolve as (Chevalier, 1982a)
| (4) |
Using this in equation 8 gives us that in a general case,
| (5) |
This is a general formula that has often been used to describe the evolution of the X-ray luminosity. An important caveat must be pointed out here - this formula considers the total X-ray emission over all temperatures. However X-ray satellites measure the emission only in a very narrow band. ROSAT covered the region between 0.4 - 2.4 keV. Chandra and XMM-Newton cover a slightly larger band, around 0.4-10/15 keV, but the effective area is much higher at lower energies. Therefore, although equation 5 shows how the X-ray luminosity will vary with time over the entire X-ray range, it is doubtful that this variation could be observed. We observe the variation only for that part of the luminosity that falls within a given X-ray mission’s observable band. This would have the same time dependence if and only if the ratio of the luminosity in that discrete band to that of the total X-ray region is constant.
However this is not likely. As the SN expands, we expect that the shock will sweep up more material and decelerate. The post-shock temperature, proportional to the square of the shock velocity, will decrease with time, and the X-ray emission would gradually shift from high to lower temperatures. Since X-ray satellites can detect emission mainly in the softer bands, we would expect that the luminosity in the lower energy range would increase at the expense of that in the higher energy range. Thus, the ratio of X-ray emission we observe to the total should increase over time, leading to a time dependence flatter than the overall time dependence in a steady wind of .
In some cases, this can be derived. From above, for a non-radiative shock, the shock velocity goes as , and the shock temperature therefore decreases as . As shown in Fransson et al. (1996), the luminosity in a given energy band with E will then go as:
| (6) |
Compared to equation 5, note that this gives a flatter time dependence, as expected. For we get that . The index is now always , implying that the time dependence we see will not be but will be flatter, and is now a function of the ejecta density power-law. For , as required by the Chevalier solution, . For commonly used values n=9, , and for n=11, . Therefore, even for a steady wind, we are more likely to see . It should be noted that for , we will not see a steeper luminosity dependence than , or flatter than .
For the situation is more complex. For , we get , i.e. the flux is linearly increasing with time, irrespective of the value of . Thus a decreasing wind density can still give rise to an increasing flux. For we get that is always negative, and therefore that the luminosity is increasing with time, whereas the total X-ray luminosity from equation 5 is actually decreasing with time. Thus this clearly shows the difference between what we would observe with X-ray satellites, and what the total X-ray luminosity is doing.
Since we can get both decreasing and increasing luminosity dependence with time, it follows that for some specific values we could observe a constant luminosity with time, i.e. . This depends on the value of the ejecta density. For we obtain from equation 6 that . Therefore, for the luminosity would be constant with time.
If the temperature of one of the shocks, especially the reverse shock, is lower than about 3 , then the cooling function behavior changes to (Chevalier & Fransson, 1994). For simplicity and to illustrate the difference in evolution, we may assume that the dependence goes as . Then we get, following the argument above, that the dependence can be inverted, giving
| (7) |
which leads to
| (8) |
and therefore, assuming that , we get
| (9) |
The situation becomes more complicated if the shock becomes radiative. This has also been discussed by Fransson et al. (1996). In this case the luminosity goes as
| (10) |
while, as long as the cool shell is optically thick, the luminosity in a band evolves as
| (11) |
where the luminosity is now proportional also to the electron temperature with time. It is interesting to note here that for a density gradient the flux is constant irrespective of the value of the ejecta gradient . For the luminosity is decreasing, while for it is increasing. Note that for a steady wind with the time dependence , i.e. the luminosity evolution has the same time dependence as the radius evolution without cooling, although with the opposite sign.
We emphasize that the light curves of young SNe expanding into a steady wind, observed in a narrow band, would not be expected to have the canonical dependence that so many have postulated (Pooley et al., 2002; Immler et al., 2002; Immler & Lewin, 2003; Immler & Kuntz, 2005; Soria & Perna, 2008), but would have a flatter dependence that is a function of the ejecta power-law. This has been very nicely shown by Fransson et al. (1996) but is routinely ignored.
Even though this approximate theory works nicely in some cases, it is important that we remain cognizant of its limitations. This includes the fact that a power-law profile is assumed for both the ejecta and the surrounding wind medium; that self-similarity is assumed; and that the same cooling function is implied for both forward and reverse shocks. It is possible that one or both of the ejecta and CSM density profiles do not decrease as a power-law; that the solution does not depict self-similar behaviour, and that different temperatures result in different cooling functions at each shock. While in the later case the result for each shock could possibly be worked out in a similar manner, the total X-ray emission from the SN would depend on details such as how much was emanating from each shock in which temperature range, and would not be easy to compute analytically. Finally, such a theory computes the emission due only to circumstellar interaction, and does not consider X-ray emission due to other mechanisms such as Inverse Compton scattering or a central pulsar, or due to other components such as radiative shocks in a clumpy medium. Thus, although there is a wide range over these ideas are applicable, it is prudent to keep the shortcomings in mind.
3 Observed X-ray light curves of young core-collapse SNe
3.1 X-ray Data:
In order to study X-ray SNe light curves, we have compiled data on SNe that was available in the literature, using published values of luminosity/flux. The time after outburst is also taken from the literature, although in cases where different times of explosion were listed for the same SNe in different papers, we have appealed to the optical light curve for clarification. Table 1 lists the various papers from which the data were compiled. In some cases the data were not explicitly listed in a table but had to be read off a figure, which introduced further error in the numbers. In a few cases (SN 2005kd, SN 2006jd), we have downloaded the publicly archived data-set and computed the flux, in order to procure at least one more data-point so that we may construct a light curve. In one case (SN 1993J) the most current data point is from a Chandra observation on which the first author is PI. We have chosen not to include GRB-related SNe in this compilation, as their X-ray emission is not expected to be due purely to circumstellar interaction. We have also not included SN 2008D, a very well observed SN whose early lightcurve at least was attributed to shock breakout (Soderberg et al., 2008) and thus did not fit in with the circumstellar model discussed herein.
| SN Name | Energy Range (kev) | Publication |
|---|---|---|
| 1986J | .5-2.5 | Houck (2005) |
| 1988Z | .2-2.0 | Schlegel & Petre (2006) |
| 1995N | .1-2.4 | Chandra et al. (2005) |
| 1998S | .4-2.0 | Pooley et al. (2002) |
| 1978K | .5-2.0 | Schlegel et al. (2004); Lenz & Schlegel (2007) |
| 1993J | .5-2.4 | Chandra et al. (2009), DG11 |
| 1979C | .3-2.0 | Patnaude et al. (2011) |
| 2002ap | .3-2.0 | Sutaria et al. (2003) |
| 1994W | .1-2.4 | Schlegel (1999) |
| 1996cr | .5-2.0 | Bauer et al. (2008) |
| 1981K | .5-2.0 | Immler et al. (2007) |
| 1987A | .5-2.0 | Hasinger et al. (1996); Park et al. (2007) |
| 2010F | .2-10 | Russell et al. (2010) |
| 2009mk | .2-10 | Russell & Immler (2010) |
| 2009gj | .2-10 | Immler & Russell (2009) |
| 2009dd | .2-10 | Immler et al. (2009) |
| 2008ij | .2-10 | Immler et al. (2009) |
| 2008ax | .2-10 | Immler (2008) |
| 2008M | .2-10 | Immler (2010) |
| 2006jd | .2-10 | Immler et al. (2007), DG11 |
| 2006jc | .2-10 | Immler et al. (2008) |
| 2005kd | .2-10 | Immler et al. (2007); Pooley et al. (2007), DG11 |
| 2005ip | .2-10 | Immler & Pooley (2007) |
| 2004et | .4-8 | Rho et al. (2007) |
| 2004dj | .5-8 | Pooley & Lewin (2004) |
| 2002hi | .5-10 | Pooley & Lewin (2003) |
| 2002hh | .4-8 | Pooley & Lewin (2002) |
| 2001ig | .2-10 | Schlegel & Ryder (2002) |
| 2001gd | .3-5 | Pérez-Torres et al. (2005) |
| 1999em | .5-8 | Pooley et al. (2002) |
| 2003L | .5-5 | Soderberg et al. (2005) |
| 2003bg | .3-10 | Soderberg et al. (2006) |
| 1999gi | .3-10 | Schlegel (2001) |
| 1970G | .3-2 | Immler & Kuntz (2005) |
| 2006bp | .2-10 | Immler & Brown (2006); Immler et al. (2007) |
| 1941C | .3-8 | Soria & Perna (2008) |
| 1959D | .3-8 | Soria & Perna (2008) |
| 1968D | .3-8 | Soria & Perna (2008) |
| 1980K | .5-4 | Schlegel (1995); Soria & Perna (2008) |
| 2010jl | 0.2-10 | Immler et al. (2010) |
| 2010jr | 0.2-10 | Immler et al. (2010) |
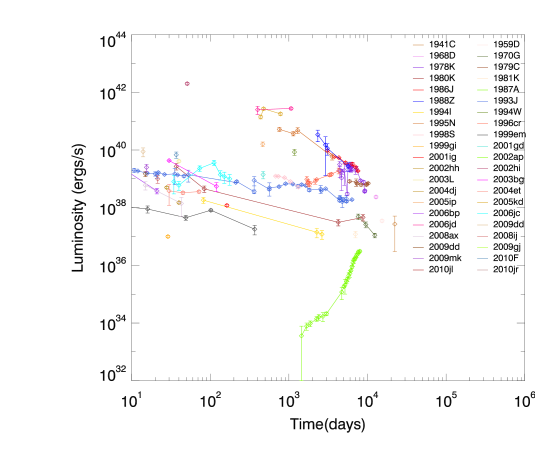
Figure 1 plots the datapoints for all X-ray observed SNe that we found in the literature with at least 1 published data point. The number is only 42, although it is rapidly increasing, thanks mainly to Swift. We plot light curves for almost all published SNe with multiple data points, enabling an X-ray light curve to be constructed. As far as possible we have constructed the light curve in the 0.4-2.4 keV or related energy range, which usually has the most data for SNe that exploded during or before the ROSAT era, and thus ensures the largest duration light curves. In some cases, as mentioned in Table 1, a larger energy band is used. Most of these are SNe observed with Swift. All points on a lightcurve lie in the same energy range, which is given in Table 1. In order to accomplish this using only published data, we had to select the energy range in which the maximum number of SN fluxes were quoted, which sometimes meant not using available flux results lying outside the energy range. Given our intent of assessing what the published light curves are telling us, no attempt was made to interpolate or extrapolate published data from a given energy range to another, which would have required assuming a spectral model that was generally not available.
While the number of SNe is gradually increasing, it is still not very large, with only 20 SNe found in the literature which have flux values at more than one epoch (although large amounts of unpublished data exists in the archives). Given the current availability of Chandra, XMM-Newton and especially Swift, we hope that this situation can be rectified in future. Only one SN (1993J) has been observed regularly since its birth, and has the most complete light curve, although gaps still exist. SN 1987A is probably the most observed X-ray SN, due to its closeness and unique nature. Hard X-ray data exist in the first 1000 days from Ginga (Inoue et al., 1991), with progressively better resolution data thereafter from all the major X-ray observatories, and almost every X-ray telescope, including high-resolution gratings.
The plot shows that very few SNe possess a monotonic light curve in the given X-ray band. This may be partially due to the published error bars being too optimistic, but in some cases it is evident that the light curve tends to jump around.
3.2 Fits to the Light Curves:
Following the discussion in §2, we fitted the light curves of all SNe with multiple data points (Figure 1) using an expression of the form . The fitting was done using the MPFIT routine (Markwardt, 2009) in the IDL programming language. In Figure 2 we show the fits for various SNe. The legend gives the value of the parameter in the expression above, which corresponds to from §2.
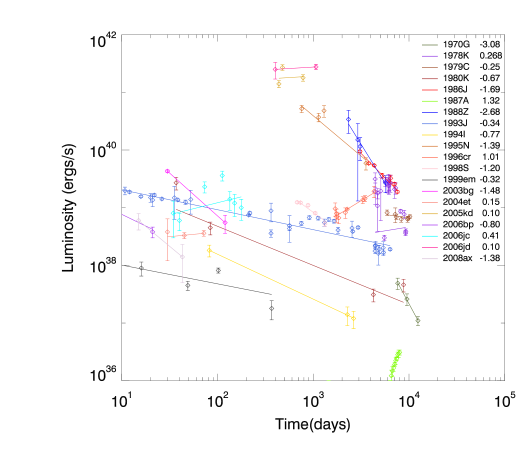
In many cases the use of a simple power-law fitting function does not seem appropriate, as is evident not only from the large values of -squared that were found, but merely by comparing the fit to the data points. It appears that a more complicated function is needed, or perhaps a break is needed in the power-law. In one case, SN 1978K, the fit seems entirely off, and it is clear that something more sophisticated is needed.
3.3 X-ray lightcurves by SN Type:
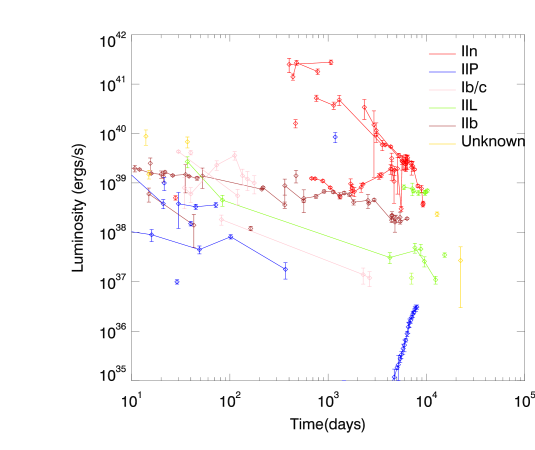
In order to study the variation of the X-ray emission with type of SNe, we show in figure 3 the light curves of all SNe plotted as a function of the type of SN. It is clear from this plot that Type IIn SNe show the highest luminosities, and Type IIP SNe the lowest. These bracket the Type IIL’s, Type IIb’s and Type Ib/c. We caution that we have not included GRB-SNe here, and while the sample is probably enough to make general inferences, it is still not large enough to draw detailed statistical conclusions.
4 Analysis of SN X-ray Lightcurves
A survey of the fits to the data in figure 2 reveals the diversity in the X-ray expansion of SNe. About half the SNe decay with , a necessary (but certainly not sufficient) condition if they are expanding in a steady wind. Two of them (SN 1987A and SN 1996cr) show , displaying X-ray emission that appears to increase over long time-scales, as has been well documented in the past (Chevalier & Dwarkadas, 1995; McCray, 1993; Park et al., 2006; McCray, 2007; Bauer et al., 2008; Dwarkadas et al., 2010). Another two (SN 1979c and SN 2006jd) appear to be relatively constant, although we caution that for SN 2006jd we have only two data points, and are waiting for more data to be published. A few SNe have . In the framework of the theory outlined above, these could not arise from SN expansion into a steady wind. This group consists of 4 Type IIn SNe, which tend to show some of the steepest decreases in X-ray emission. Others in this category include SN 2003bg and 2008ax, which do not have enough time-sampling over even a decade to effective judge their luminosity decrease. The steepest light curve belongs to SN 1970G, which drops as . Interestingly, many of these SNe which have steep drop-off in light curves appear to be those from whom X-ray emission was found only late in their lifetimes, after about 6 years. In this context, we point out that if the X-ray light curve of SN 1993J after 6 years is considered, the fall-off would be much steeper than the gentler overall slope, as has been shown in Chandra et al. (2009).
We discuss some of our results in more details, in the context of either individual SNe or groups of SNe.
4.1 Type IIn Supernovae:
In 1990, a new class of SNe was introduced by Schlegel (1990). The ’n’ denotes narrow lines, which distinguish Type IIn from other SNe. Many of these SNe (but not all) have a high radio and X-ray luminosity. In fact, as is evident from Figure 3, as a class they have the highest X-ray luminosity of all SN types.
As shown in Figure 2, 4 of the Type IIns (SN 1986J, SN 1988Z, SN 1998S and SN 1995N) have a very steep luminosity decline. SN 1986J X-ray flux decreases as . We note here that for 1986J, we have adopted the flux values computed by Houck (2005) rather than those by Temple et al. (2005). We recomputed the values for the Chandra observations and find much closer agreement with the former than the latter.
The steep value of the X-ray decline would suggest that the SN is expanding in a medium with a density that declines faster than . SN 1986J is also well studied in the radio range. VLBI observations (Bietenholz et al., 2010) suggest that the shock radius is expanding as . The luminosity decline and radial expansion then provide two equations which can be used to determine the slope of the ejecta and the slope of the CSM density profile . It is easy to show however, that there is no finite solution for and using equations 4 and 6. In other words, there is no compatible solution for the case of an adiabatic shock in SN 1986J.
If we consider a radiative reverse shock, then it is possible to get a finite solution which gives . This appears to be consistent with the luminosity decline, which indicates a very rapid slope. However, it gives a value of , which is not allowed within the Chevalier solution (Chevalier, 1982a). Such a low value of is inconsistent with most computed models of SN outer ejecta density profiles (Chevalier & Soker, 1989; Matzner & McKee, 1999). That does not completely exclude this solution. The emission could arise from the reverse shocked material colliding with the flatter part of the ejecta density profile (i.e. the self-similar solution is no longer valid). It is also possible to envision scenarios such as the shock becoming suddenly radiative, implying a transition stage, or expanding into a medium that drops steeply in density.
These results seem to point to a complicated emission structure. An alternative solution, as suggested by Chugai (1993), is that there are two components to the emission. The basic idea is that of a SN expanding in a clumpy wind, with the clumps having a low volume filling factor. The expansion of the SN in the interclump wind medium is mainly responsible for the radio emission and the radial expansion measured with VLBI, whereas the X-ray emission arises from radiative shocks within the clumps. However, this still implies that the density of the clumps, or the number of clumps, must decrease faster than in order to get the appropriate decline.
Even if the SN is expanding into a clumpy wind, it is unlikely that it would have been doing so since it exploded. If we assume the current luminosity decline started right from the SN explosion, and extrapolate the soft X-ray luminosity to 10 days after the explosion, we get that it would be about 1.5 ergs s-1. This is an extremely large luminosity, especially just in the soft X-ray band, given that we would expect the hard X-ray luminosity to be much larger at this stage (indeed, at the last Chandra observation, the soft and hard luminosities were comparable). Note that if the SN really was emitting in X-rays with this luminosity, it would have lost all its kinetic energy in a year at that rate. Even given the rate of luminosity decline it would have lost all its energy in a few years. It is clear that such a high luminosity would be unsustainable.
The first X-ray detection of SN 1986J was made 8.43 years after explosion, when the luminosity was almost 1040 ergs s-1. If we assume that the SN maintained this constant luminosity since explosion, it would mean that in the first 8.43 years it would have lost a total of 2.5 ergs just in the soft X-ray band. The amount lost in hard X-rays would most likely be greater since the temperature would be higher. The flux at infra-red wavelengths can be up to a factor of 100 larger than that in X-rays, especially at higher temperatures (Dwek et al., 2008), thus leading to an improbably high broadband flux. However it is possible that for SNe expanding in a very dense medium, some of the dust may be destroyed, and the IR flux may be only a few times larger than X-rays. The broad-band flux would still be high, but not impossibly so.
A plausible inference is that the average luminosity of SN 1986J over the first 8.43 years was lower than at 8.43 years, and perhaps orders of magnitude lower. At some point before 8 years the X-ray luminosity increased. In terms of the clumpy wind model, this could mean that there were fewer to no clumps in the first few years, and that the number of clumps increased after a few years. An alternative is that the SN shock was evolving in a much lower density region earlier, and started interacting with a higher density region at a later time. This would imply a sudden deceleration in the shock velocity when it began expanding into the high density region, which is not seen in the radio VLBI data. We will explore the X-ray emission from SN 1986J in detail in a future paper.
SN 1988Z has an X-ray luminosity that decreases even faster than that of SN 1986J. Following the arguments above, a plausible model appears to be that of a SN shock wave interacting with a clumpy wind, as suggested by Chugai & Danziger (1994). Not surprisingly, extrapolating back to 10 days, we get an X-ray luminosity of 6.5 ergs s-1. At this luminosity, the SN would lose all its energy in one day, so its clear that the soft X-ray lightcurve could not have had the recorded decline right from the time of explosion. Following the line of reasoning above for SN 1986J, it appears most likely that SN 1988Z also had a lower X-ray luminosity in the early years, which increased at a later time. This then further suggests a lower density medium, or lack of clumps in the ambient medium, during the first few years.
SN 1995N and SN 1998S also have luminosity declining faster than t-1, although not as fast as 1986J or 1988Z. Nonetheless, it does suggest a medium that decreases faster than r-2. Extrapolating SN 1995N luminosity back to 10 days gives a luminosity of , still larger than the observed X-ray luminosity of any known X-ray SN, and unlikely (although not impossible), following the arguments given above for SN 1986J. SN 1998S extrapolated back gives a luminosity of , approaching the upper limit of known X-ray luminosities. In the case of 1998S the decline is not so steep, and it is possible that the luminosity could have declined with this slope since the time of explosion.
The above slopes suggest that the density into which the SN is expanding, whether it be due to clumps or a wind, falls faster than r-2. While most Type IIns show a very high luminosity, not all of them decline so rapidly. SN 2005kd appears to rise and fall, over a time-period of only a few 100 days. SN 2006jd appears to be more or less constant over 2 data points separated by a few 100 days. Neither of these would be consistent with an r-2 density in the ambient medium. SN 1996cr, which has been studied in detail (Bauer et al., 2008; Dwarkadas et al., 2010; Dewey et al., 2011), was increasing in X-ray luminosity for several years, before turning over, and is thought to have expanded in a low density region surrounded by a dense shell.
It is clear that although there is great diversity, none of the Type IIn appear to be evolving into a steady wind with constant parameters.
4.2 SN 1993J:
This SN has more X-ray data than any other except SN 1987A. The X-ray and radio emission has been studied in detail by several authors, but no consensus reached on what kind of medium the SN is expanding in. One of the earliest papers which studied the X-ray light-curve (Suzuki & Nomoto, 1995) suggested that the density immediately around the SN was decreasing as r-1.7. A similar result, of a density slope flatter than r-2, was found by Fransson et al. (1996). Following up on a seminal paper that interpreted the radio emission of 1993J in the context of a steady wind (Fransson & Björnsson, 1998), Fransson & Björnsson (2005) asserted that both the X-ray and radio lightcurves could be fit by a self-similar expansion for SN 1993J, with a power-law ejecta expanding into an r-2 medium. They criticized the hydrodynamic modelling of Suzuki & Nomoto (1995) for using an ejecta profile that was hydrodynamically unstable. However, Nymark et al. (2009), citing the same hydrodynamic models, suggested that the X-ray emission was coming partly from an adiabatic shock expanding into CNO-enriched ejecta (which was not described simply by a power-law), and partly from a radiative shock, with no contribution from the circumstellar shock. The calculations of Chandra et al. (2009) were consistent with the fact that the emission was dominated by a reverse shock component, but did not need two emitting components, although they did not study the spectra. The radio and VLBI data has always been contentious, and the two different views are summarized in Bartel et al. (2007) and Martí-Vidal et al. (2011).
The soft X-ray light-curve for the first 700 days is well fit by a slope . This could fit an solution if , but such an ejecta profile is inconsistent with explosion models (Suzuki & Nomoto, 1995). Otherwise it cannot be fitted with a steady wind expansion. As Fransson et al. (1996) have shown, for the fit is good with a radiative shock solution. However, the behaviour after 700 days is much more complex and does not appear to fit a constant value of , thus suggesting that the slope is changing at this time. A changing density slope was used in Chandra et al. (2009) to fit the hard X-ray light curve. Overall, SN 1993J does not appear to fit the expansion pattern of a shock expanding in a steady wind, especially since the slope of the X-ray decay steepens at later times.
4.3 SN 1979C:
This SN appears to be expanding with a more or less constant luminosity for several years. Patnaude et al. (2011) interpret this steady luminosity as evidence for emission from a central black-hole component. Although without a detailed inspection of the spectra, we cannot validate or dispute their assertion, we do wish to mention here that having a more or less constant lightcurve is not inconsistent with the circumstellar interaction model. In section 2 we have shown that for adiabatic shocks for example, n=9, s=1.62 gives a constant luminosity in the soft X-ray band, while for radiative shocks, gives a constant flux. Therefore having a constant flux over an extended period in SN 1979C (and perhaps SN 2006jd) does not contradict the circumstellar interaction model, although it does indicate that the evolution is not into a steady wind.
4.4 Other SNe:
SN 2006jc is an unusual SN that experienced a mass ejection about two years before becoming a SN (Pastorello et al., 2007; Foley et al., 2007). The X-ray emission (Immler et al., 2008) is consistent with the SN ejecta rising as it impacts the dense shell resulting from this mass-loss, followed by a decline as the shock crosses the dense region (see for instance Dwarkadas, 2005). If it was interacting with an r-2 wind, it was only for an extremely short period, but for the most part the profile deviates significantly from a steady wind.
SN 1987A has been very well studied in the literature. Its proximity, and the availability of the Hubble Space Telescope, has allowed us for once to optically observe the interaction. Analysis of the optical, x-ray and radio data have shown that the SN evolved into a low density medium before impacting a higher density ionized HII region (Chevalier & Dwarkadas, 1995; Park et al., 2005, 2006, 2007; Dwarkadas, 2007a, b) followed by a dense shell, part of a bipolar circumstellar nebula. The evolution, and X-ray emission, is summarized in reviews by McCray (1993, 2003, 2007).
SN 1978K also seems to be continually bright in X-rays. Its luminosity could be considered constant on average, but appears to fluctuate by factors of a few, making it difficult to get a good linear fit. Schlegel (2006) asserts that although there may not be too much luminosity evolution, spectral evolution does exist. The current X-ray light curve though appears inconsistent with a steady wind.
SN 1970G was discovered only several thousand days after explosion. Although it currently has the steepest luminosity slope , it is not clear what the slope was over the first 20+ years. Currently the slope does not appear consistent with interaction with an r-2 medium.
Schlegel (2001) analysed the X-ray emission from Type IIP SNe, and suggested that they would not be strong X-ray sources. This is consistent with the lightcurves in figure 3, which shows that Type IIPs have a low X-ray luminosity. The fits to the slopes of many of these, as well as other SNe not explicitly mentioned above, are theoretically consistent with expansion within a steady wind. The closest to that of a steady wind is that of SN 1994I. In most of these cases, there are either too few datapoints, or the fits are not statistically good, so it is hard to judge if they are evolving in a steady wind over an extended time period. However, Chevalier et al. (2006) have studied the X-ray emission from Type IIP’s assuming they evolve in a steady wind, and their calculations tend to match the observations. It must be kept in mind that IIP’s evolve from RSGs, which do not have a very high wind velocity, and thus the wind will not extend very far out from the star, perhaps a few parsecs at most. Thus we would expect that even if the SN shocks were interacting with winds, at some point early in their evolution (few hundred years or less) they would run out of wind material to expand in.
5 Discussion
In this paper we have plotted the X-ray lightcurves of almost all published X-ray SNe, in the narrow energy ranges in which they were observed. Furthermore, we have fitted these lightcurves to a function that goes as , and derived the value of , which we have compared to theoretical expectations. In many of the cases, and especially for Type IIn SNe, we find that the light-curve data in this simple theory are not consistent with evolution into a steady wind whose density decreases as r-2. There are of course several limitations to this theory. Chevalier & Fransson (2006) suggest that the x-ray luminosities of type Ib/c SNe can only be explained by a non-thermal mechanism, either X-ray synchrotron or inverse Compton. Our sample does not include any GRB related 1b/c, and only a few non-GRB 1b/c SNe that have published data. It is thus possible for scenarios to exist where the light curve slopes, although not within the range outlined in §2, may be consistent with a steady wind. Although such exceptions are possible, it would be unusual to assume that they would apply to all, or even most, SNe. Furthermore, if the latter is indeed true, then it suggests that the many tens of papers in the literature that have used this theory need to be re-evaluated.
Our plotted lightcurves are consistent with those of Schlegel (2006) in those cases where overlap is possible. They are inconsistent with those of Immler (2007), who plotted light curves of all SNe known till then with just the first and last data point, while asserting that “all other X-ray data points are along the extrapolated lines”. As is evident from figure 1, this does not seem to represent the available data. Using that assertion, Koss & Immler (2007) went a step further, calculating the density profile of the medium into which the SN is evolving, and showing that the results are consistent with a density decline corresponding to a steady wind. Inherent in their calculation is that the SN luminosity is decreasing as t-1, which they take to mean that the ambient density is going as , although as emphasized in §2 this is not necessarily true. Therefore, it is not surprising that their final result matches that initial assumption. Given the arguments above, and the light curves plotted in Figure 1 and fitted in Figure 2, we do not agree with their results.
Often in the literature, the X-ray lightcurve, or even a single X-ray datapoint, has been measured, and used to compute a mass-loss rate, assuming that the light curve decreases as (Pooley et al., 2002; Immler et al., 2002; Immler & Lewin, 2003; Immler & Kuntz, 2005; Immler, 2007; Koss & Immler, 2007; Soria & Perna, 2008; Miller et al., 2010). As shown above, and most clearly in Fransson et al. (1996), the dependence for a steady wind is only valid over the total X-ray range, not the narrow bands in which SNe are generally observed. Even if it were valid in the narrow range, none of the published lightcurves are actually decreasing in luminosity as t-1, and very few are even close. We caution therefore that the resulting mass-loss rates obtained in this manner from the X-ray lightcurves may be incorrect, and not reflective of the true nature of the CSM. If, as the lightcurves appear to indicate, the SNe are not evolving in an r-2 medium, then the calculated mass-loss rates would need to be re-calibrated. Unfortunately, if the wind is not steady, then the generally used expressions to measure the mass-loss rates are no longer valid, and there is no simple way to compute the mass-loss rate. Most techniques usually yield the combination - disentangling the magnitude, and time evolution, of either or both parameters is a difficult task. If the deviation from a steady wind is not large, a mass-loss rate obtained by assuming a steady wind may be a good approximation early on, but the difference increases gradually with increasing radius from the center of the explosion.
An r-2 density decline is often assumed in calculations of mass-loss rates from optical observations (Smith et al., 2008; Smith et al., 2010; Kiewe et al., 2010). Kiewe et al. (2010) have used this in fact to compute the mass-loss rates for 15 type IIn SNe, and suggest that they are consistent with LBV progenitors. It has not been shown that such a density decline is warranted. Salamanca (2003) pointed out many years ago that the medium around Type IIn SNe does not necessarily decrease as r-2; this assertion was repeated for specific individual cases by Dwarkadas (2011). If the nature of the density distribution plays such an important part in determining the mass-loss rate and thereby categorizing the SN progenitor, it is important that the assumption of a steady wind density decreasing as r-2 not be made without accompanying proof.
There exist suggestions from other sources that the circumstellar medium in the immediate vicinity of massive stars does not have an r-2 density profile, or that such a profile does not extend far out. In their analysis of GRB afterglows, Schulze et al. (2011) find that only a quarter of them appear to be evolving in a freely expanding wind, with the rest appearing to expand in a constant density medium. Furthermore, in all cases except two, they place limits on the freely expanding wind region of less than 1 pc, and 0.1pc for about half the observed GRBs. Radio observations of SNe appear to imply density modulations in the circumstellar medium (Ryder et al., 2004; Soderberg et al., 2006; Wellons & Soderberg, 2011), although its not clear how large a deviation from a standard r-2 profile is indicated.
X-ray emission from young SNe, which is mainly thermal, has the simplest and most direct dependence on the density structure of the surrounding medium, and can be used therefore to most easily infer this density structure. In order to improve this analysis and make more detailed calculations from SN X-ray lightcurves, it is imperative that we have detailed lightcurves, with much better time sampling, and over as wide an energy range as possible. Given the availability of Chandra, XMM-Newton , Suzaku, and Swift, and that they should continue operating for many more years, it is urgent that we observe as many SNe as possible, and for as long as possible, in X-rays.
Acknowledgments
VVD would like to profusely thank John Houck and Dan Dewey (MKI) for help with learning to use the ISIS software, and Dan for sharing many of his scripts. A lot of the early observations listed herein are due to Eric Schlegel, and many of the later ones to Dave Pooley and Stefan Immler, to all of whom we are indebted. We thank the anonymous referee for a thorough reading of the manuscript and many insightful comments. We are grateful to R. Chevalier for comments on an earlier version of the paper. VVD’s research is supported by grants TM9-0004X (SN 1987A) and GO1-12095A (SN 1993J), both provided by the National Aeronautics and Space Administration through Chandra Awards issued by the Chandra X-ray Observatory Center, which is operated by the Smithsonian Astrophysical Observatory for and on behalf of the National Aeronautics Space Administration under contract NAS8-03060. JG was supported by the UChicago NSF REU program in summer 2010.
References
- Bartel et al. (2007) Bartel N., Bietenholz M. F., Rupen M. P., Dwarkadas V. V., 2007, ApJ, 668, 924
- Bauer et al. (2008) Bauer F. E., Dwarkadas V. V., Brandt W. N., Immler S., Smartt S., Bartel N., Bietenholz M. F., 2008, ApJ, 688, 1210
- Bietenholz et al. (2010) Bietenholz M. F., Bartel N., Rupen M. P., 2010, ApJ, 712, 1057
- Chandra et al. (2009) Chandra P., Dwarkadas V. V., Ray A., Immler S., Pooley D., 2009, ApJ, 699, 388
- Chandra et al. (2005) Chandra P., Ray A., Schlegel E. M., Sutaria F. K., Pietsch W., 2005, ApJ, 629, 933
- Chevalier (1977) Chevalier R. A., 1977, ARAA, 15, 175
- Chevalier (1982a) Chevalier R. A., 1982a, ApJ, 258, 790
- Chevalier (1982b) Chevalier R. A., 1982b, ApJ, 259, 302
- Chevalier & Dwarkadas (1995) Chevalier R. A., Dwarkadas V. V., 1995, ApJL, 452, L45
- Chevalier & Fransson (1994) Chevalier R. A., Fransson C., 1994, ApJ, 420, 268
- Chevalier & Fransson (2006) Chevalier R. A., Fransson C., 2006, ApJ, 651, 381
- Chevalier et al. (2006) Chevalier R. A., Fransson C., Nymark T. K., 2006, ApJ, 641, 1029
- Chevalier & Soker (1989) Chevalier R. A., Soker N., 1989, ApJ, 341, 867
- Chugai (1993) Chugai N. N., 1993, ApJL, 414, L101
- Chugai & Danziger (1994) Chugai N. N., Danziger I. J., 1994, MNRAS, 268, 173
- Dewey et al. (2011) Dewey D., Bauer F. E., Dwarkadas V. V., 2011, ArXiv e-prints
- Dwarkadas (2005) Dwarkadas V. V., 2005, ApJ, 630, 892
- Dwarkadas (2007a) Dwarkadas V. V., 2007a, in Immler S., McCray R., eds, American Institute of Physics Conference Series Vol. 937 of American Institute of Physics Conference Series, SN Shock Evolution in the Circumstellar Medium surrounding SN 1987A. pp 120–124
- Dwarkadas (2007b) Dwarkadas V. V., 2007b, in Revista Mexicana de Astronomia y Astrofisica Conference Series Vol. 30 of Revista Mexicana de Astronomia y Astrofisica Conference Series, Supernova Explosions in Winds and Bubbles, with Applications to SN 1987A. pp 49–56
- Dwarkadas (2011) Dwarkadas V. V., 2011, MNRAS, 412, 1639
- Dwarkadas et al. (2010) Dwarkadas V. V., Dewey D., Bauer F., 2010, MNRAS, 407, 812
- Dwek et al. (2008) Dwek E., Arendt R. G., Bouchet P., Burrows D. N., Challis P., Danziger I. J., De Buizer J. M., Gehrz R. D., Kirshner R. P., McCray R., Park S., Polomski E. F., Woodward C. E., 2008, ApJ, 676, 1029
- Foley et al. (2007) Foley R. J., Smith N., Ganeshalingam M., Li W., Chornock R., Filippenko A. V., 2007, ApJL, 657, L105
- Fransson & Björnsson (1998) Fransson C., Björnsson C., 1998, ApJ, 509, 861
- Fransson & Björnsson (2005) Fransson C., Björnsson C.-I., 2005, in J.-M. Marcaide & K. W. Weiler ed., IAU Colloq. 192: Cosmic Explosions, On the 10th Anniversary of SN1993J Modeling the Radio and X-ray Emission of SN 1993J and SN 2002ap. pp 59–+
- Fransson et al. (1996) Fransson C., Lundqvist P., Chevalier R. A., 1996, ApJ, 461, 993
- Hasinger et al. (1996) Hasinger G., Aschenbach B., Truemper J., 1996, AA, 312, L9
- Houck (2005) Houck J. C., 2005, in L. O. Sjouwerman & K. K. Dyer ed., X-Ray and Radio Connections Monitoring X-ray Emission From SN 1986J
- Immler (2007) Immler S., 2007, in S. Immler, K. Weiler, & R. McCray ed., Supernova 1987A: 20 Years After: Supernovae and Gamma-Ray Bursters Vol. 937 of American Institute of Physics Conference Series, X-Ray Emission from Supernovae. pp 246–255
- Immler (2008) Immler S., 2008, The Astronomer’s Telegram, 1420, 1
- Immler (2010) Immler S., 2010, The Astronomer’s Telegram, 2478, 1
- Immler & Brown (2006) Immler S., Brown P. J., 2006, Central Bureau Electronic Telegrams, 476, 1
- Immler et al. (2007) Immler S., Brown P. J., Filippenko A. V., Pooley D., 2007, The Astronomer’s Telegram, 1290, 1
- Immler et al. (2007) Immler S., Brown P. J., Milne P., Dessart L., Mazzali P. A., Landsman W., Gehrels N., Petre R., Burrows D. N., Nousek J. A., Chevalier R. A., Williams C. L., Koss M., Stockdale C. J., Kelley M. T., Weiler K. W. e. a., 2007, ApJ, 664, 435
- Immler & Kuntz (2005) Immler S., Kuntz K. D., 2005, ApJL, 632, L99
- Immler & Lewin (2003) Immler S., Lewin W. H. G., 2003, in Weiler K., ed., Supernovae and Gamma-Ray Bursters Vol. 598 of Lecture Notes in Physics, Berlin Springer Verlag, X-Ray Supernovae. pp 91–111
- Immler et al. (2007) Immler S., Li B., Yang Y., Wilson A., 2007, Central Bureau Electronic Telegrams, 828, 1
- Immler et al. (2010) Immler S., Milne P., Pooley D., 2010, The Astronomer’s Telegram, 3012, 1
- Immler et al. (2008) Immler S., Modjaz M., Landsman W., Bufano F., Brown P. J., Milne P., Dessart L., Holland S. T., Koss M., Pooley D., Kirshner R. P., Filippenko A. V., Panagia N., et al. C., 2008, ApJL, 674, L85
- Immler & Pooley (2007) Immler S., Pooley D., 2007, The Astronomer’s Telegram, 1004, 1
- Immler et al. (2007) Immler S., Pooley D., Brown P. J., 2007, The Astronomer’s Telegram, 981, 1
- Immler et al. (2009) Immler S., Pooley D., Brown P. J., Milne P., 2009, The Astronomer’s Telegram, 1918, 1
- Immler & Russell (2009) Immler S., Russell B. R., 2009, The Astronomer’s Telegram, 2111, 1
- Immler et al. (2009) Immler S., Russell B. R., Brown P. J., 2009, The Astronomer’s Telegram, 2106, 1
- Immler et al. (2010) Immler S., Russell B. R., Roming P. W. A., Pooley D., 2010, The Astronomer’s Telegram, 3045, 1
- Immler et al. (2002) Immler S., Wilson A. S., Terashima Y., 2002, ApJL, 573, L27
- Inoue et al. (1991) Inoue H., Hayashida K., Itoh M., Kondo H., Mitsuda K., Takeshima T., Yoshida K., Tanaka Y., 1991, PASJ, 43, 213
- Kiewe et al. (2010) Kiewe M., Gal-Yam A., Arcavi I., Leonard D. C., Emilio Enriquez J., Cenko S. B., Fox D. B., Moon D., Sand D. J., Soderberg A. M., 2010, ArXiv e-prints
- Koss & Immler (2007) Koss M., Immler S., 2007, in S. Immler, K. Weiler, & R. McCray ed., Supernova 1987A: 20 Years After: Supernovae and Gamma-Ray Bursters Vol. 937 of American Institute of Physics Conference Series, Using X-ray Emission from Core-Collapse Supernova Shocks to Probe Circumstellar Environments. pp 436–439
- Lenz & Schlegel (2007) Lenz E., Schlegel E. M., 2007, AJ, 134, 1821
- Markwardt (2009) Markwardt C. B., 2009, in D. A. Bohlender, D. Durand, & P. Dowler ed., Astronomical Data Analysis Software and Systems XVIII Vol. 411 of Astronomical Society of the Pacific Conference Series, Non-linear Least-squares Fitting in IDL with MPFIT. pp 251–+
- Martí-Vidal et al. (2011) Martí-Vidal I., Marcaide J. M., Alberdi A., Guirado J. C., Pérez-Torres M. A., Ros E., 2011, AA, 526, A143+
- Matzner & McKee (1999) Matzner C. D., McKee C. F., 1999, ApJ, 510, 379
- McCray (1993) McCray R., 1993, ARAA, 31, 175
- McCray (2003) McCray R., 2003, in K. Weiler ed., Supernovae and Gamma-Ray Bursters Vol. 598 of Lecture Notes in Physics, Berlin Springer Verlag, Supernova 1987A. pp 219–240
- McCray (2007) McCray R., 2007, in S. Immler, K. Weiler, & R. McCray ed., Supernova 1987A: 20 Years After: Supernovae and Gamma-Ray Bursters Vol. 937 of American Institute of Physics Conference Series, Supernova 1987A at Age 20. pp 3–14
- Miller et al. (2010) Miller A. A., Silverman J. M., Butler N. R., Bloom J. S., Chornock R., Filippenko A. V., Ganeshalingam M., Klein C. R., Li W., Nugent P. E., Smith N., Steele T. N., 2010, MNRAS, 404, 305
- Nymark et al. (2009) Nymark T. K., Chandra P., Fransson C., 2009, AA, 494, 179
- Park et al. (2007) Park S., Burrows D. N., Garmire G. P., McCray R., Racusin J. L., Zhekov S. A., 2007, in S. Immler, K. Weiler, & R. McCray ed., Supernova 1987A: 20 Years After: Supernovae and Gamma-Ray Bursters Vol. 937 of American Institute of Physics Conference Series, Chandra Observations of Supernova 1987A. pp 43–50
- Park et al. (2006) Park S., Zhekov S. A., Burrows D. N., Garmire G. P., Racusin J. L., McCray R., 2006, ApJ, 646, 1001
- Park et al. (2005) Park S., Zhekov S. A., Burrows D. N., McCray R., 2005, ApJL, 634, L73
- Pastorello et al. (2007) Pastorello A., Smartt S. J., Mattila S., Eldridge J. J., Young D., Itagaki K., Yamaoka H., Navasardyan H., Benetti S., Cappellaro E., Boles T., Bonnet-Bidaud J.-M., Botticella M. T., 2007, Nature, 447, 829
- Patnaude et al. (2011) Patnaude D. J., Loeb A., Jones C., 2011, New Astronomy, 16, 187
- Pérez-Torres et al. (2005) Pérez-Torres M. A., Alberdi A., Marcaide J. M., Guerrero M. A., Lundqvist P., Shapiro I. I., Ros E., Lara L., Guirado J. C., Weiler K. W., Stockdale C. J., 2005, MNRAS, 360, 1055
- Pooley et al. (2007) Pooley D., Immler S., Filippenko A. V., 2007, The Astronomer’s Telegram, 1023, 1
- Pooley & Lewin (2002) Pooley D., Lewin W. H. G., 2002, IAU Circular, 8024, 2
- Pooley & Lewin (2003) Pooley D., Lewin W. H. G., 2003, The Astronomer’s Telegram, 116, 1
- Pooley & Lewin (2004) Pooley D., Lewin W. H. G., 2004, IAU Circular, 8390, 1
- Pooley et al. (2002) Pooley D., Lewin W. H. G., Fox D. W., Miller J. M., Lacey C. K., Van Dyk S. D., Weiler K. W., Sramek R. A., Filippenko A. V., Leonard D. C., Immler S., Chevalier R. A., Fabian A. C., Fransson C., Nomoto K., 2002, ApJ, 572, 932
- Rho et al. (2007) Rho J., Jarrett T. H., Chugai N. N., Chevalier R. A., 2007, ApJ, 666, 1108
- Russell & Immler (2010) Russell B. R., Immler S., 2010, The Astronomer’s Telegram, 2389, 1
- Russell et al. (2010) Russell B. R., Immler S., Milne P., 2010, The Astronomer’s Telegram, 2618, 1
- Ryder et al. (2004) Ryder S. D., Sadler E. M., Subrahmanyan R., Weiler K. W., Panagia N., Stockdale C., 2004, MNRAS, 349, 1093
- Salamanca (2003) Salamanca I., 2003, in E. Perez, R. M. Gonzalez Delgado, & G. Tenorio-Tagle ed., Star Formation Through Time Vol. 297 of Astronomical Society of the Pacific Conference Series, The Dense Circumstellar Material Around Type IIn Supernovae. pp 429–+
- Schlegel (1990) Schlegel E. M., 1990, MNRAS, 244, 269
- Schlegel (1995) Schlegel E. M., 1995, Reports on Progress in Physics, 58, 1375
- Schlegel (1999) Schlegel E. M., 1999, ApJL, 527, L85
- Schlegel (2001) Schlegel E. M., 2001, ApJL, 556, L25
- Schlegel (2006) Schlegel E. M., 2006, in E. J. A. Meurs & G. Fabbiano ed., Populations of High Energy Sources in Galaxies Vol. 230 of IAU Symposium, Young X-ray-Emitting Supernovae in Galaxies. pp 252–258
- Schlegel et al. (2004) Schlegel E. M., Kong A., Kaaret P., DiStefano R., Murray S., 2004, ApJ, 603, 644
- Schlegel & Petre (2006) Schlegel E. M., Petre R., 2006, ApJ, 646, 378
- Schlegel & Ryder (2002) Schlegel E. M., Ryder S., 2002, IAU Circular, 7913, 1
- Schulze et al. (2011) Schulze S., Klose S., Björnsson G., Jakobsson P., Kann D. A., Rossi A., Krühler T., Greiner J., Ferrero P., 2011, AA, 526, A23+
- Smith et al. (2008) Smith N., Chornock R., Li W., Ganeshalingam M., Silverman J. M., Foley R. J., Filippenko A. V., Barth A. J., 2008, ApJ, 686, 467
- Smith et al. (2010) Smith N., Chornock R., Silverman J. M., Filippenko A. V., Foley R. J., 2010, ApJ, 709, 856
- Soderberg et al. (2008) Soderberg A. M., Berger E., Page K. L., Schady P., Parrent J., Pooley D., Wang X.-Y., Ofek E. O., Cucchiara A., Rau A., 2008, Nature, 453, 469
- Soderberg et al. (2006) Soderberg A. M., Chevalier R. A., Kulkarni S. R., Frail D. A., 2006, ApJ, 651, 1005
- Soderberg et al. (2005) Soderberg A. M., Kulkarni S. R., Berger E., Chevalier R. A., Frail D. A., Fox D. B., Walker R. C., 2005, ApJ, 621, 908
- Soria & Perna (2008) Soria R., Perna R., 2008, ApJ, 683, 767
- Sutaria et al. (2003) Sutaria F. K., Chandra P., Bhatnagar S., Ray A., 2003, AA, 397, 1011
- Suzuki & Nomoto (1995) Suzuki T., Nomoto K., 1995, ApJ, 455, 658
- Temple et al. (2005) Temple R. F., Raychaudhury S., Stevens I. R., 2005, MNRAS, 362, 581
- Wellons & Soderberg (2011) Wellons S., Soderberg A. M., 2011, in American Astronomical Society Meeting Abstracts #217 Vol. 43 of Bulletin of the American Astronomical Society, Radio Observations Reveal the Mass Loss History of Type Ibc Supernova Progenitors. pp #337.15–+
- Woltjer (1972) Woltjer L., 1972, ARAA, 10, 129