Star Cluster Complexes and the Host Galaxy in Three H ii Galaxies: Mrk 36, UM 408, and UM 461
Abstract
We present a stellar population study of three H ii galaxies (Mrk 36, UM 408, and UM 461) based on the analysis of new ground-based high resolution near-infrared J, H and Kp broad-band and Br narrow-band images obtained with Gemini/NIRI. We identify and determine relative ages and masses of the elementary star clusters and/or star cluster complexes of the starburst regions in each of these galaxies by comparing the colors with evolutionary synthesis models that include the contribution of stellar continuum, nebular continuum and emission lines. We found that the current star cluster formation efficiency in our sample of low luminosity H ii galaxies is 10%. Therefore, most of the recent star formation is not in massive clusters. Our findings seem to indicate that the star formation mode in our sample of galaxies is clumpy, and that these complexes are formed by a few massive star clusters with masses 104M⊙. The age distribution of these star cluster complexes shows that the current burst started recently and likely simultaneously over short time scales in their host galaxies, triggered by some internal mechanism. Finally, the fraction of the total cluster mass with respect to the low surface brightness (or host galaxy) mass, considering our complete range in ages, is less than 1%.
1 Introduction
H ii galaxies are dwarf galaxies undergoing an intense episode of star formation (SF) that dominates their total optical luminosity. Most H ii galaxies overlap in their observed properties, with Blue Compact Dwarf (BCD) galaxies; indeed, many are found in both samples. Typically, they have relatively small physical sizes (with a few kpc in size), and the starburst regions spatially cover the visible extent of the galaxy, making it difficult to access the presence of an underlying (or host galaxy) stellar population. Originally, their low heavy element abundance and the non-detection of an old population have given rise to the question of whether they may be presently forming their first generation of stars (Sargent & Searle, 1970). Recent works, however, have shown that most H ii galaxies seem to present an underlying population from previous episodes of SF (e.g., Telles, 1995; Papaderos et al., 1996; Telles & Terlevich, 1997; Cairós et al., 2003). So, the integrated light observed in H ii galaxies is formed by the contribution of two main components, the young stellar population with ages of a few Myr to tens Myr and an underlying population of intermediate (with ages of hundreds Myr) to old stars (with ages 1 Gyr).
The structure of the Interstellar Medium (ISM) found in H ii galaxies (Lagos et al., 2007, and references therein) have profound implications for the origin of the present starburst and the dominant large scale mode of SF. While many high luminosity H ii galaxies show evidence of morphological disturbances that may be associated with interactions or ongoing minor mergers (e.g., Telles et al., 1997; Bergvall & Östlin, 2002), less luminous and compact H ii galaxies defy our attempt to find morphological signatures of an external triggering agent (Telles et al., 1997). In fact, H ii galaxies seem to be typically isolated and not associated with giant galaxies (Telles & Terlevich 1995), and their clustering properties seem to be similar to those of normal galaxies (Telles & Maddox, 2000). There have been, however, many attempts to search for HI companions (Taylor, 1997) and intrinsically faint optical companions (Noeske et al., 2001; Pustilnik et al., 2001). In these studies, it was concluded that galaxy interactions with both massive and dwarfs are probably the main mechanism that triggers SF bursts in BCD progenitors. Although interactions are often invoked to explain burst of SF in H ii/BCD galaxies, it is possible that internal processes (e.g., gravitational cloud collapse and/or infall in conjunction with small perturbations) have been responsible for triggering the present episode of SF in at least a significant fraction of dwarf galaxies (see Hunter & Elmegreen, 2004; Pelupessy et al., 2004; Telles, 2009; Simpson et al., 2011, and references therein).
It has been apparent for over a decade now, with the advent of the HST, that the starburst regions in these galaxies are composed of a myriad of star clusters (e.g., Billett et al., 2002), with masses 104-5 M⊙ and sizes of a few pc, that are typically more massive than normal clusters in our Galaxy (Meurer et al., 1995; Conti & Vacca, 1994). These Super Star Cluster (SSCs) or Young Massive Clusters (YMCs) were found originally in classical starburst galaxies and in galaxies with evident signs of interaction or merger such as in the Antennae NGC 4038/4039 (Whitmore et al., 1999), dwarf irregular galaxies such as NGC 1569 and NGC 1705 (O’Connell et al., 1994), and other star-forming dwarf galaxies or BCD galaxies such as M82 (Melo et al., 2005) and SBS 0335-052 (Thuan et al., 1997; Papaderos et al., 1998). The formation of these massive clusters and the cluster mass function (CMF) is directly connected to the SF processes in the galaxies, in the sense that different physical factors, in these galaxies, put constrains on the mass of the star clusters. The CMF appears to be a single power law (with index -2), which implies the same SF mechanism for the massive clusters and their lower mass analogues. This type of young and massive clusters were possibly formed in high pressure conditions (e.g., Elmegreen & Efremov, 1997; Billett et al., 2002), hence the extremely high pressure regions give rise to more massive and compact clusters. We know that SF in clusters is a common phenomenon in starburst galaxies, and that the massive clusters play an important role on the evolution of the ISM of their host galaxies, producing large scale structures such as supershells (or bubbles) and creating galactic winds that cause, in some cases, the blowout of freshly produced metals from the galaxy into the intergalactic medium (IGM). The similarity in mass and size between SSCs and Milky Way globular clusters (GCs; MM⊙, Harris, 1991) suggests the possibility of an evolutionary connection in the sense that SSCs are proto-globular cluster systems. The classic example of a YMC is R136 at the center of the 30 Doradus nebula in the Large Magellanic Cloud. This cluster has a diameter of 1.6 pc, an age of 1–2 Myr (Massey & Hunter, 1998) and an estimated mass of 2104 M⊙ (Walborn et al., 2002, and references therein).
Apart from evidence for massive star clusters and its effect on the surrounding medium, H ii galaxies show an underlying low surface brightness (LSB) component likely to represent their host galaxies, whose stellar population is a product of previous episodes of SF. This underlying stellar host generally extends a few kpc from the central star-forming regions, showing regular and elliptical isophotes with red colors indicative of an evolved stellar population. The host galaxy in H ii galaxies has been studied in the literature based on the analysis of both optical (e.g., Telles & Terlevich, 1997) and near infrared (near-IR) images (e.g., Cairós et al., 2003; Noeske et al., 2003, 2005) and spectroscopy (e.g., Raimann et al., 2000; Westera et al., 2004). Thuan (1983) observed, in the near-IR, a sample of BCD galaxies and showed that the light in these galaxies is due to the presence of K- and M-giant stars. The study of the structural parameters of the host galaxy (exponential scale length () and central surface brightness ()) has been commonly used in the literature to evaluate the evolutionary relations between the different types of dwarf galaxies (e.g., Papaderos et al., 1996; Telles et al., 1997; Gil de Paz & Madore, 2005, and references therein). The derivation of the ages and spatial distribution of these stellar populations is the first step towards establishing the evolutionary state and the SF history of these galaxies.
We present near-IR broad-band J, H and Kp and Br narrow-band images of three low luminosity H ii galaxies: Mrk 36, UM 408, and UM 461. Our aim is to describe the properties of the star clusters or complexes which are distinguishable with our superb ground-based high spatial resolution images with NIRI on the Gemini North telescope as well to determine the structural properties of the underlying galaxy using surface photometry. These observations in combination with a proper assessment of recent stellar population synthesis models allow us to put some constraints on the recent and past history, and the dominant large scale mode of SF in these galaxies.
2 Sample, observations and data reduction
2.1 Our sample
We targeted two galaxies Mrk 36 and UM 461, that are particularly rich in giant star-forming knots and one compact H ii galaxy, UM 408, with less evidence of multiple knots of SF. The light collecting power of the Gemini North telescope and the high spatial resolution permitted by NIRI are an excellent combination for resolving the star cluster or/and star cluster complex populations in these compact galaxies. In the following paragraphs we describe the main properties of our sample of galaxies.
Mrk 36 (Haro 4, UGCA 225) is a compact H ii galaxy showing at least two large star-forming knots (Lagos et al., 2007) in the south-eastern part of the galaxy. Thuan (1983) reports integrated near-IR colors (de-reddened) of and , while Hunter & Elmegreen (2006) reports integrated colors of and . The regions of largest H line emission (Lagos et al., 2007) and HI maps (Bravo-Alfaro et al., 2004) coincide, indicating that the current SF is restricted to the dense region of the parental cloud. Bravo-Alfaro et al. argue that a transient encounter between Mrk 36 and the neighboring spiral Haro 26 could explain both the SF in the former and the pronounced warp in the latter. Finally, recent radio observations with the VLA in 1.4, 4.9 and 8.4 GHz by Rosa-González et al. (2007) have shown that Mrk 36 has a nearly flat radio spectrum dominated by thermal emission, similar to the regions detected by Johnson & Kobulnicky (2003) in Henize 2-10. This may be an indication that the first contribution of the synchrotron emission to the low frequency emission, due to the first supernova (SN) explosions, has not yet appeared. These integrated properties show definite evidence of a very young starburst.
UM 408 is a compact galaxy with a projected size of 1kpc. Although this galaxy was resolved as a single H ii region in previous studies (e.g., Gil de Paz et al., 2003), two giant regions in the central part of the galaxy were detected by Lagos et al. (2009), with ages of 5 Myr and stellar masses of 104M⊙. Using GMOS-IFU observations Lagos et al. (2009) showed that the metal content in the ISM of this galaxy is well mixed and homogeneously distributed throughout the galaxy, in the same way as in other dwarf galaxies.
UM 461 (PGC 037102) is a well studied H ii galaxy. This object has a very compact and bright off-center nucleus, some small regions spread along the galaxy (Noeske et al., 2003), and an external envelope that is strongly distorted towards the south-west. Doublier et al. (2001) and Noeske et al. (2003) have obtained integrated near-IR colors that differ significantly from each other, with J-H=0.99 and H-K=-0.68 and J-H=0.47 mag and H-K=0.2 mag, respectively. Taylor et al. (1995) proposed that UM 461 was formed together with UM 462 by tidal interaction. But the HI maps of UM 461 and UM 462 do not show that these galaxies are tidally interacting, therefore it is unlikely that these objects induced the star formation on each other (Van Zee et al., 1998).
Finally, the presence of He ii 4686 emission bump of Wolf–Rayet (WR) stars has been reported in the integrated spectra of Mrk 36 and UM 461 (Conti, 1991).
2.2 Observations, data reduction, and calibration
Broad-band J(1.25), H(1.65), Kp(2.12), and narrow-band Br(2.17) images were obtained using the NIRI instrument on the Gemini North telescope on 2005 August 02 (UM 408), November 24 (Mrk 36), and December 29 (UM 461). We used the f/6 camera which provides a field of view of 120″120″using the 10241024 pixels ALLADIN InSb detector, with a pixel scale of 0″.116 on side. The observations were performed under photometric conditions. Table 1 lists all observational parameters and values adopted in this work. In this Table, Column (1) gives the object name. Columns (2) and (3) give the and coordinates (J2000), respectively. Column (4) gives the observed heliocentric velocity (vel.) and the 3K CMB (Cosmic Microwave Background radiation) corrected distance from NED. Columns (5) and (6) give the oxygen abundance and extinction c(H) for these galaxies obtained from the literature. Column (7) gives the galactic extinction E(B-V) from the extinction maps of Schlegel et al. (1998). In Column (8) we present the date of observation. Column (9) shows the filter used in each observation and Columns (10) and (11) give the exposure time in seconds, considering the different coadd exposures and the mean air mass of each observation, respectively. Finally, Column (12) shows the instrumental constants Cλ of the transformation equation for flux calibration as described below in this section.
The data were reduced following the standard procedures for near-IR imaging using the Gemini/NIRI package version 1.8 inside IRAF111IRAF: the Image Reduction and Analysis Facility is distributed by the National Optical Astronomy Observatories, which is operated by the Association of Universities for Research in Astronomy, In. (AURA) under cooperative agreement with the National Science Foundation (NSF).. For each filter, a normalized flat was constructed from the flat images observed with the calibration unit with the shutter closed (lamps off) and with the shutter open (lamps on). The bad pixel mask was constructed by identifying the bad pixels in the flat images with shutter off. The sky images were constructed from the raw science images by identifying all objects in each frame, masked out, and averaging the remaining good pixels (images were observed with a dither offsets of 10″ and 20″ for all galaxies). The raw science images were processed by subtraction the sky on a frame-by-frame basis and dividing by the normalized flat field images. The final flat-fielded, sky subtracted images were then registered to a common pixel position and median combined.
In order to obtain a photometric calibration, we observed two standard stars: FS130 (GSPC P264-F) and FS21 (GD140) for the observing run of Mrk 36, FS4 (SA93-317) and FS6 (Feige 22) for UM 408, and FS19 (G162-66, LTT 3870) and FS20 (G163-50, LTT 4099) for the observations of the galaxy UM 461. For each filter, the photometric calibration was obtained using the following equations:
| (1) |
| (2) |
where m is the magnitude in the standard system, is the instrumental magnitude with c the number of counts and the exposure time, the air mass, Kλ the extinction coefficient and Cλ the instrumental constant (=J, H, Kp). The instrumental constant Cλ was calculated as the average value from the standard stars. Given the limited number of standard stars observed, we have used the average value of extinction to the “Mauna Kea” observatory (MKO) =0.1, 0.06 and 0.09 (Krisciunas et al., 1987) to the filters J, H and K, respectively. The instrumental Cλ constants used for each galaxy are listed in the last column of Table 1. To compare the observed Kp measures with evolutionary synthesis models, we transformed the Kp into K magnitudes using the relation Kp= K + 0.22(H-K) (Wainscoat & Cowie, 1992). We selected star clusters/complexes by visual inspection of the images and using daofind in DAOPHOT. We fitted the detection threshold properly, with a value of 2.5 above the local background, in order to detect sources in the starburst region that in the case of H ii/BCD galaxies spatially cover the visible extent of the galaxies. All the clusters or complexes in this study have been detected in the J, H and Kp band. The final catalog of objects is shown in § 3.1.
The Br images were calibrated using a procedure similar to that described in Lagos et al. (2007). We convolved the stellar Spectral Energy Distribution (SED) with the response of the narrow-band filter. To do this we used the SED, appropriately scaled, of stars with the same spectral type as our standard stars obtained from the literature. Finally, we subtracted the continuum, estimating their contribution from the modeled SED for a given age of the regions obtained below in § 3.1.2.
Table 2 shows the observed integrated magnitudes for all the galaxies, uncorrected for Galactic extinction. The magnitudes were calculated by measuring the flux inside fixed apertures of radii 14″, 6″, and 12 for the galaxies Mrk 36, UM 408, and UM 461, respectively. Foreground objects have been masked out.
2.3 Completeness limits
We quantified our detection limits and test the reliability of the derived magnitudes using a series of completeness tests by adding artificial extended objects to our images. First, we created an empirical point spread function (PSF) for isolated point-like sources in the NIRI images. Given that the observed field of view (FOV) is relatively small (120″120″), there is a possibility that these point-like sources are non-stellar. So these objects were selected by eye and we ruled out sources with irregular PSF shapes. Using this information we added 20–50 artificial extended objects distributed in a regular square array. Models of these extended sources were generated using mksynth in BAOLAB (Larsen, 1999) and were added to the science images. Magnitudes were randomly assigned to each position from 16.00 mag to 23.00 mag with an interval of 0.5 mag. Finally, we compared the number of added and recovered sources in each galaxy. The estimated completeness fraction for objects as a function of magnitude for the Kp band is shown in Figure 1. The completeness goes down to 20.2 mag in Mrk 36, 21.5 mag in UM 408 and 22.03 mag in UM 461 with 90 % of the objects recovered in the Kp band.

3 Results
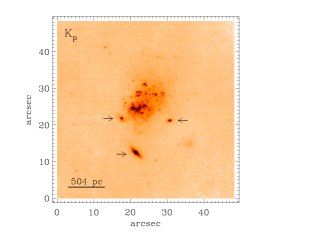
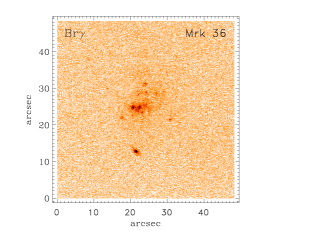
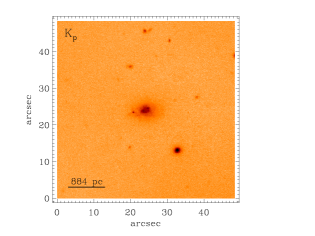
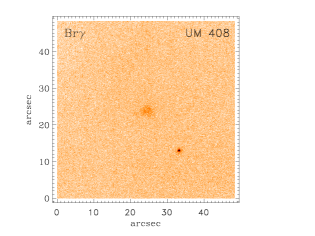
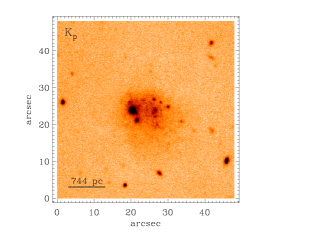
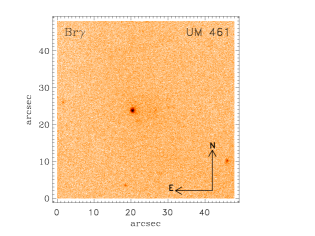
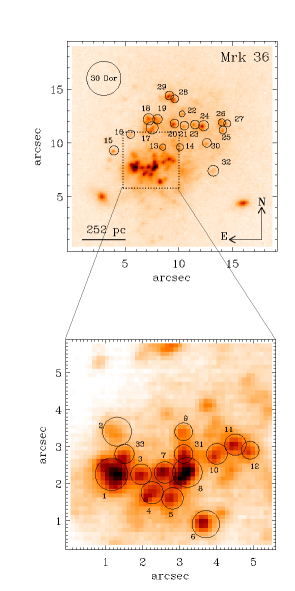
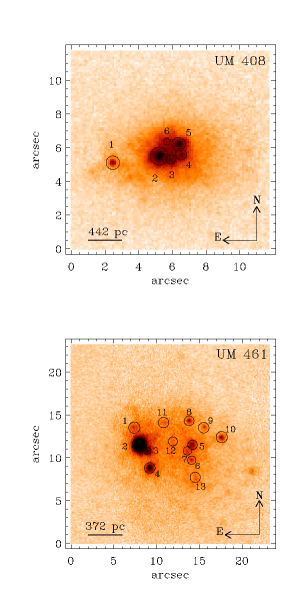
Figure 2 shows the three galaxies observed and studied in this work (Mrk 36, UM 408, and UM 461) in the Kp and Br bands, respectively. All galaxy images reveal the presence of bright regions and/or star cluster complexes, given the apparent sizes of these regions in Figure 2, surrounded by LSB envelopes. Br emission is detected in all galaxies, but only the brightest regions show clear evidence of intense emission given by our detection limit. The unprecedented high spatial resolution images obtained for Mrk 36 allow us to identify, for the first time using ground-based telescopes, the elementary structures within the starburst. Mrk 36 shows a plethora of small clusters, distributed over the entire extension of the galaxy, but with a previously unresolved concentration in the central knot. The Br emission shows a peak in this region, indicating the young nature of these clusters. We also observed the presence of other groups of bright clusters in the Kp image located in the northern region of the galaxy with weaker Br emission. Here we named these two groups of regions as complex I and complex II, respectively. The galaxy UM 408 appears quite compact and regular, and the Kp-band image shows that the star-forming regions are distributed in a clearly defined ring-like geometry, composed of five almost regularly spaced regions where the current SF is occurring. The largest region is located in the eastern part of the galaxy. We observe the presence of another region outside the central part of the galaxy. The Br emission in this galaxy is very regular and weak. Finally, the Kp-band morphology of UM 461 is similar to that reported in previous works (e.g., Noeske et al., 2003). The brightest region is off-center and located in the eastern part of the galaxy. This region is extremely compact and bright in Br. We detected a number of regions spread throughout the body of the galaxy.
3.1 Properties of the star clusters/complexes
3.1.1 Near-IR colors
For the color analysis we considered the objects obtained from our catalog in § 2 that are brighter than m21 mag. We detected 33 regions in Mrk 36, 6 in UM 408 and 13 in UM 461, respectively. All regions identified in the Kp-band images of the galaxies are shown in Figure 3. Given the seeing of 04–05 we expect these regions to have diameters less than 25 pc in Mrk 36, 88 pc in UM 408, and 37 pc in UM 461. So these diameters are upper limits, and the elementary cluster population in our samples of galaxies are barely resolved. Many of the detected regions are not individual star clusters but rather blends of several individual star clusters with sizes similar to that in other star cluster complexes in the literature (e.g., Melena et al., 2009). In the case of Mrk 36 the detected regions are compatible with the sizes of some young star clusters detected in other H ii/BCD galaxies (e.g., M82; Melo et al., 2005), so these regions can be considered as individual star clusters, although likely some of these sources are blended. In any case, young clusters are not formed in isolation but rather are found in cluster complexes (Zhang et al., 2001; Larsen, 2004). Hence, the properties derived are the luminosity-weighted mean value of the complex. We have to bear in mind this caveat in our analysis but we are still able to derive the light weighted properties of these knots of SF and evaluate the clumpiness properties of the large scale mode of SF in these galaxies. In Figure 3 we also show the size (200 pc; Walborn, 1991) of the whole nebular region of 30 Doradus to compare with the sizes of the clusters in Mrk 36.
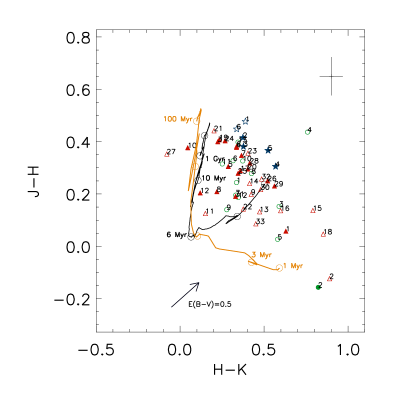
We measured the flux of the individual star cluster/complexes in all filters (including Br) using circular apertures with the program APER in IDL (an adapted version of the task DAOPHOT in IRAF). For each aperture, we considered only pixels with 3 flux above the background. For each cluster we calculated the colors J-H and H-K (after the transformation of Kp into K magnitudes). Figure 4 shows the color–color diagram (J-H vs. H-K) for all star clusters/complexes. In this figure we illustrate the evolutionary tracks of these colors using STARBURST99 (black line; Leitherer et al., 1999) and GALEV (orange line; Kotulla et al., 2009) single stellar population (SSP) models, for a Kroupa IMF, and metallicity Z=0.004 (more details in § 3.1.2). The triangles represent the observed values for clusters in Mrk 36, the stars represent the values for the star cluster complexes in UM 408, and circles represent the values for the star cluster complexes in UM 461. Filled symbols indicate the detection of Br in these regions. Finally, we compare our observed apparent magnitudes with the ones found in the literature. The only one cluster/complex found in the literature is the region #2 in UM 461 where Noeske et al. (2003) obtained mJ=17.30 mag, that agree within the errors with our value of mJ=17.34 mag.
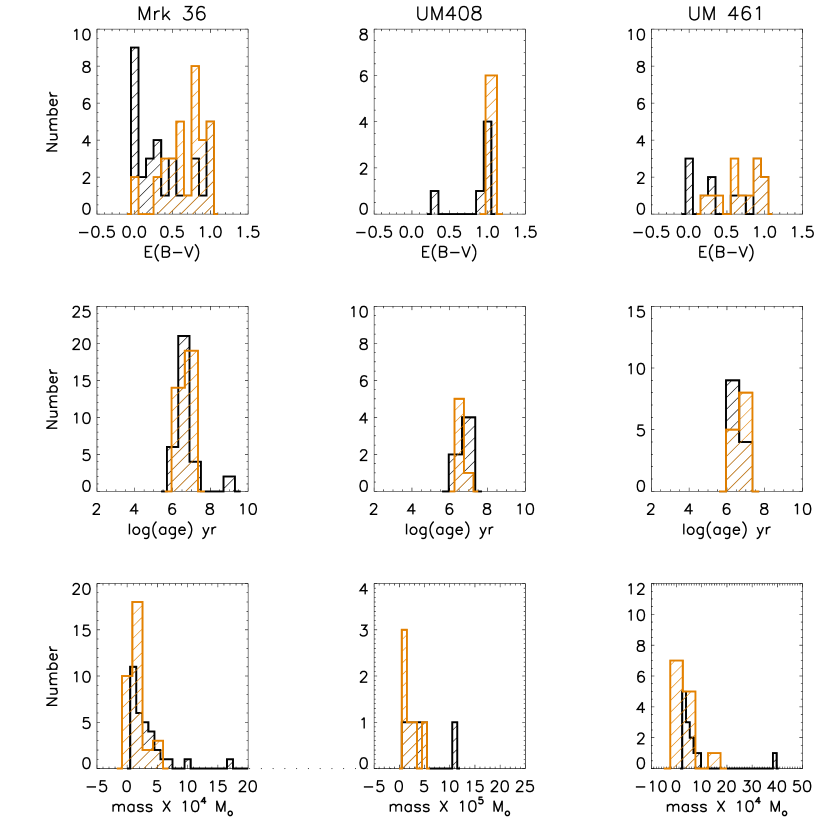
Table 3 lists the photometric values for each star cluster/complex identified in our sample of galaxies (see Figure 3). In this Table, Column (2) shows the identification number. Column (3) shows the aperture considered to obtain the photometry in arcsec. Columns (4), (5), and (6) give the observed photometry in the J, H, and Kp bands for each cluster, respectively. The † symbol over the identification number indicates that Br emission was measured. Finally, Columns (7), (8), and (9) give the extinction E(B-V), age in units of Myr, and the stellar mass in units of 104M⊙ of each star cluster or complex derived from the best fit comparison of the observed colors with chosen evolutionary synthesis models as described below in § 3.1.2.
3.1.2 Obtaining the physical properties of the star cluster/complex population
Models
Absolute age dating of young star clusters in starburst galaxies has proven to be a very challenging task, due to the additional emission by dust plus gas, as well as the effects of extinction and metallicity. In relative terms the determination of ages and masses of the star cluster population within these galaxies can show some insight on the overall dominant mode of recent SF. In order to show these effects we derived the extinction and ages using our color–color diagrams (see Figure 4) by comparing the near-IR colors for each star cluster or star cluster complex with two independent SSP models: STARBURTS99 models (model I; this model includes pure stellar and nebular continuum) and GALEV (model II; this model includes stellar continuum, nebular continuum, and emission lines from warm ionized gas) for an instantaneous burst of SF. So we derived the ages by calculating the best fit of the models (using the chi-square method) to the observed colors for the model, varying the extinction E(B-V) from 0 to 1 in steps of 0.05 mag. We used the Galactic extinction curve given by Cardelli et al. (1989) assuming RV=3.1. The star cluster/complex masses were derived using the absolute magnitudes Mk of each cluster as compared with the models. In the following paragraphs we describe the main properties of the models used in this work.
Model I: We considered the STARBURST99 model, which includes pure stellar and nebular continuum, for metallicity Z=0.004 (1/5Z⊙), and Geneva evolutionary stellar tracks, assuming a Kroupa IMF (M-α) with =1.3 for stellar masses between 0.1 to 0.5M⊙ and =2.3 for masses between 0.5 and 100M⊙ for a total mass of 106M⊙. More details about the physics of the model in Leitherer et al. (1999).
Model II: We compared our data with the GALEV evolutionary track for metallicity Z=0.004 and a Kroupa IMF (0.1-100M⊙) including stellar continuum, nebular continuum, and gas emission. The GALEV models used in this work were kindly provided to us by Ralf Kotulla. These models were run using the Geneva evolutionary tracks with a minimum age and time resolution of 0.1 Myr, unlike the models available on the GALEV website which use the Padova isochrones and have a minimum age and time step of 4 Myr. The models also use a fraction of visible mass, which is used for the standard models available on the Web page, and which are thus twice as bright as the Padova models for the same mass. This does not affect any of the colors, but we must keep this in mind when comparing masses. The flux of the hydrogen lines were computed using atomic physics and the production rate of ionizing photons, whereas non-hydrogen line strengths are computed using metallicity-dependent line ratios relative to H. More details about the input physics is given in Kotulla et al. (2009).
Extinction, masses and cluster/complex ages
The two models (model I and II) displayed on the J-H versus H-K color–color diagram (Figure 4) show a different path for ages 6 Myr. The track for model I and the extinction vector, in the corner of this figure, are perpendicular to the model II. Therefore, estimates of extinction could be significantly different when we use the two cases. In Columns (7), (8), and (9) of Table 3 we show the E(B-V), age and mass of the star clusters/complexes, using the two different models described above. In Figure 5 we show the distribution of E(B-V), ages, and masses for the star clusters/complexes detected in this work. In this Figure, the black distribution corresponds to the results obtained using STARBURST99 and the orange distribution to the those obtained using GALEV. From this figure it is clear that the extinction distribution is shifted to higher values when we use the model that include the contribution of nebular emission lines, meanwhile, the ages estimated using this model (model II) appear to be slightly younger and less massive than those obtained using model I.
We can ask now, what is the most appropriate model to represent the ages and masses of our sample of star clusters/complexes? The SED of the observed star clusters/complexes in some H ii/BCD galaxies show a clear excess in the near-IR, that is reflected in red H-K colors with respect to the models. This observed red excess had been reported earlier by Vanzi et al. (2000, 2002); Hunt et al. (2003), Johnson et al. (2004), and more recently by Reines et al. (2008) and Adamo et al. (2010, 2011) in the star cluster population of other H ii/BCD galaxies. In fact Adamo et al. (2010) showed that the I and H bands are significantly affected by a similar excess. Reines et al. (2010) and Adamo et al. (2010) showed that this red excess clearly introduces a systematic offset in all of the derived parameters when all filters, from UV-optical to near-IR are included in the determination of the observed SEDs. This suggests that the models commonly used in the literature to calculate the properties of the clusters, models that include pure stellar continuum, are inadequate for age-dating studies (Papaderos et al., 1998; Anders & Fritze-v. Alvensleben, 2003; Reines et al., 2010).
Some of the causes analyzed in the literature that have been proposed to explain this excess are: i) there may be an important contribution from nebular continuum and line emission (e.g., Papaderos et al., 1998; Vanzi et al., 2002; Reines et al., 2010), ii) hot dust emission (e.g., Vanzi et al., 2000; Reines et al., 2008), iii) the presence of young Red Super Giant (RSG) stars in older clusters, not properly modeled at low metalicity (Maeder & Meynet, 2001; Vázquez et al., 2007, and references therein), and iv) other sources as for example extended red emission (ERE; Witt & Vijh, 2004), produced by photoluminescence process and the presence of a population of young stellar objects (YSOs; Adamo et al., 2011) still surrounded by circumstellar disks.
Since there is no degeneracy in the color space between age and extinction at young ages (Figure 4), at least qualitatively, model II explains the colors of young star clusters (Reines et al., 2010) given that only this model is able to reproduce the trend seen in the data, in Figure 4, at young ages.
The presence of nebular continuum and emission lines in the near-IR can have a large impact on the inferred properties (affecting the mass determination) of the star clusters in H ii/BCD galaxies, and models that include this effect are the most appropriate in the study of young stellar population with ages 6 Myr. In fact, near-IR spectra of Tol 35, Tol 3, and UM 462 presented by Vanzi et al. (2002) clearly show recombination lines of HeI and HI (Br, Br and Pa), and excited lines. The line emission detected by Vanzi et al. is sufficient to produce their observed broad-band excess. Although hot dust and the presence of RSGs may be important factors that can contribute to the near-IR excess, we assume that the excess in the SF regions in our sample of H ii galaxies is mainly produced by nebular continuum and emission lines, hence we can use our near-IR photometric bands and model II, that include this contribution, in order to estimate the properties of the detected star clusters/complexes.
3.1.3 Uncertainties in the age determination
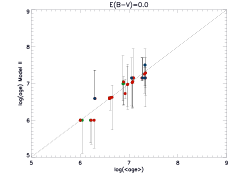
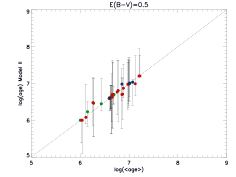
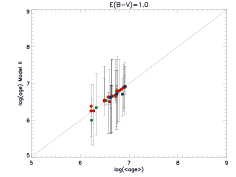
In order to estimate the uncertainties in our age calculation procedure, we calculate the best fit ages while varying the colors by their typical observational errors (as listed in Table 2). In Figure 6 we show the ages obtained from model II for three different extinctions E(B-V)=0.0, 0.5 and 1.0 as a function of the mean age (age) obtained varying the colors by their errors. We showed that in the worst case (if all the errors conspire), they can modify the solutions, but not changing significantly the properties of the sample. In this figure, we can see that for high extinction the clusters/complexes are better fitted than for lower extinctions, producing that the best fits are obtained at higher values of reddening. This is an indication that the starburst regions or complexes are dominated by highly extinguished and very young star clusters.
A major concern in our method stems from the fact that we are using near-IR bands to obtain the properties of the star cluster/complexes. The determination of absolute ages/masses of star clusters and star cluster complexes using near-IR colors, alone, could be highly uncertain and highly model dependent. It seems that better constraints of the properties of the star clusters/complexes are obtained with a large broad band coverage plus emission line equivalent widths. However, we depend on the improvement of population synthesis models and the contraints of the input parameters and ingredients, as stellar tracks, libraries at different metallicities, and inclusion of the effects of nebular emission, dust, etc. Given these uncertainties, we cannot obtain absolute ages, but our analysis, based on these observations give us a qualitative view of a rather homogeneous star cluster population. Relative ages and masses can, however, be useful in order to indicate the mode of SF at galactic scales.
We note that future high-resolution ground-based or space telescope observations using UV-UBVRIJHK broad bands are needed in order to obtain the SED of each star cluster or/and complex in our sample of galaxies and then constrain absolute ages and quantify the near-IR excess produced by other mechanism, e.g., hot dust, ERE, YSOs, RSGs in metal poor ambients, etc.
3.1.4 Summary of the obtained properties
In summary, we found that the star cluster population in Mrk 36 is massive with estimated masses of 104-5M⊙. We detected, in this galaxy, a few clusters with masses of 103M⊙. Given our detection limits, lower mass clusters are likely not to be detectable. Meanwhile, the star clusters complexes in UM 408 and UM 461 have masses from 104M⊙ to 106M⊙. The age distribution shows that the detected star clusters/complexes are very young with ages less than 10 Myr in Mrk 36 and 5 Myr in UM 408 and UM 461, respectively. The two star clusters with colors consistent with ages 10-100 Myr, in Mrk 36, are likely old star clusters as is, likely, the case of the cluster #27. Other possibility, is that these objects are field galaxies not properly resolved. As we mentioned previously, some of the star cluster complexes are highly extinguished and young. In Mrk 36, the less extinguished clusters, in most cases, are the youngest star clusters (mainly in complex I). This feature is less clear in UM 408 and UM 461, where our resulting properties are averaged over a wider region. In the case of UM 408, our results agree with the ones obtained by Lagos et al. (2009), where using GMOS–IFU spectroscopy they found that the highest values of extinction in the c(H) map are displaced from the peaks of H emission. The position of the peaks of extinction found by Lagos et al. are correlated with the position of our detected star cluster complexes. This feature suggests that the current starburst episode is sweeping the gas and dust out of the center into the surrounding regions.
Finally, from a comparison of our results with the ages and masses of other star clusters in H ii/BCD galaxies studied in the literature, we see that the ranges are similar. For example, the analysis of the cluster population in UM 462 has revealed ages between 4.7 and 10 Myr (Vanzi, 2003) with masses range from 1.2 to 7.2105M⊙. In the case of Haro 11 Adamo et al. (2010) found that 30% of the clusters have masses 105M⊙, arguing that these clusters qualify as SSCs. Using HST Imaging Spectrograph (STIS) long-slit far- and near-ultraviolet spectra, Chandar et al. (2004) studied a local sample of SSCs in WR starburst galaxies, including Mrk 36. They estimated an age 1 Myr for the SSC that coincides with the position of our cluster #1, the most luminous cluster in Mrk 36. Given that WR features has been reported for Mrk 36 and UM 461 in the literature and since long slit spectra are taken centered on the brightest regions, we expect the brightest clusters in Mrk 36 to be really young clusters with upper age limit in the range 2-5 Myr (Garcia-Vargas et al., 1995). If the detected clusters, in Mrk 36, are really young, and given that their ages, masses and sizes (with diameters less than 25 pc) are similar to the properties obtained in other star clusters, particularly in interacting and star forming galaxies, we suppose that some of the most massive star clusters, found in Mrk 36, can be considered candidates to be SSCs. The sizes of the regions in the other two H ii galaxies studied here are characteristic of star cluster complexes. High spatial resolution observations in space are needed in order to resolve the elementary entities that constitute the starburst population in UM 408 and UM 461.
3.1.5 The spatial distribution of the star cluster/complexes
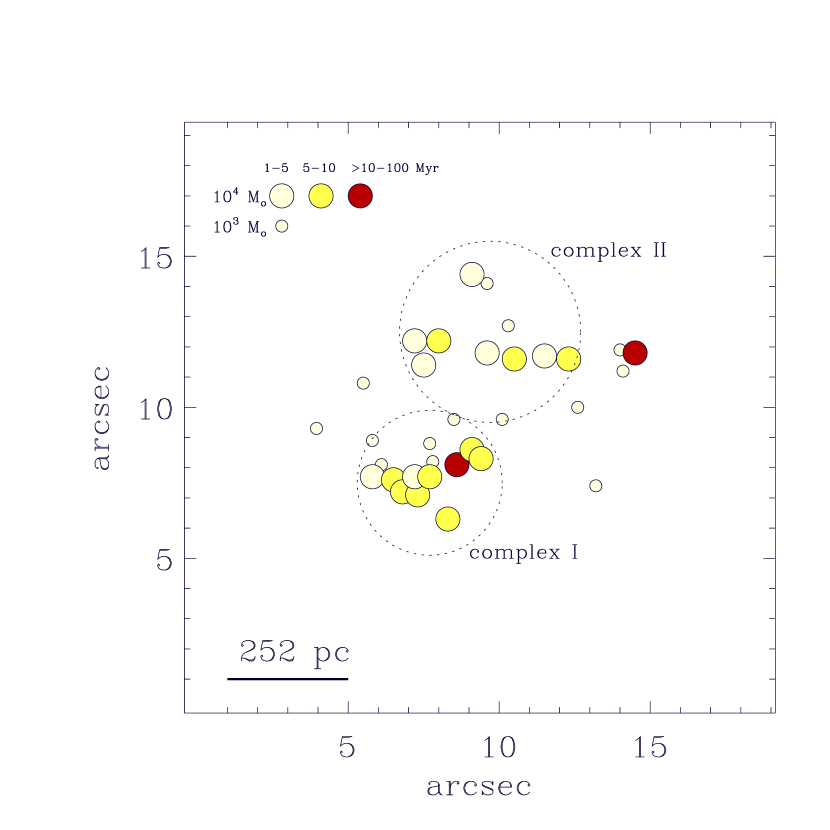
In a self-propagating SF model (Gerola & Seiden, 1978) the gas expansion caused by stellar-wind and SNe shock waves will triger the next generation of stars. If this scenario of SF is plausible, we must derive an age trend of the star clusters, or age sequence of some groups of star clusters with respect to the spatial position. To illustrate this, we show in Figure 7 the position of the clusters in the galaxy Mrk 36. The star clusters, in this figure, are divided into two groups with masses 103M⊙ and 104M⊙, considering three ranges in age: 1-5, 5-10 and 10-100 Myr. The spatial distribution of the star clusters/complexes, their relative ages and spatial position in the host galaxy show that there is no clear age trend, meaning that the young regions were not triggered by the action of the older ones.
In order to estimate the propagating timescale of the feedback from the star-formation activities, we calculate the crossing time tcross=R/vprop, where R is the size of the system and vprop the propagation or expansion velocity. Typically, this velocity varies from 10 kms-1 to 100 kms-1 in dwarf galaxies (e.g., van Eymeren et al., 2007). Denoting by R the distance between the central or brightest cluster or complex to the other clusters, we found that the propagation of SF is possible within the complexes in Mrk 36, for high expansion velocities, given that the tage (with a mean tcross and age3 Myr in Mrk 36), but not on galactic scales because tage. For low velocities the difference between the ages of the central region (in complex I) with respect to the more distant clusters (in complex II) are agetcross (with a mean t30 Myr in Mrk 36), suggesting that the propagation of SF between the complexes is improbable.
Given that the star clusters/complexes are practically coeval, the star formation was produced simultaneously within time scales of the order of age on galactic scales. More likely a global SF mechanism is responsible for the present SF activity in galactic scales in some H ii galaxies, whereas, self propagating SF on scales of 100 pc is still possible within the individual complexes.
3.2 Properties of the LSB component
3.2.1 Surface Brightness Profiles and Structural parameters
In order to obtain the surface brightness profile, for each galaxy, we fitted ellipses to the isophotes using the IRAF task ellipse. First, we manually masked the bright regions identified in the Kp-band images, except the central ones, and replacing the values by the average of the adjacent regions. Then, we approximated the initial ellipse centers, ellipticities, and position angles, allowing these parameters to vary freely with radius during the fitting process. When the routine cannot proceed in the iterations as it reaches the lowest surface brightnesses, the ellipse task stops, and we fix the center, ellipticity, and the position angle with these values to produce our light profiles.


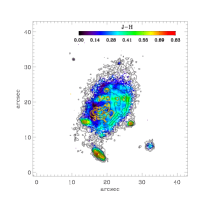
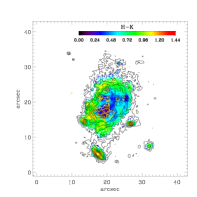
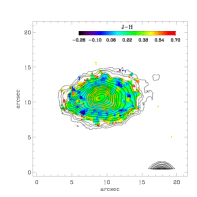
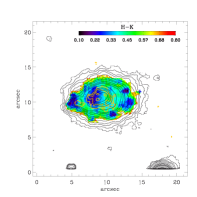
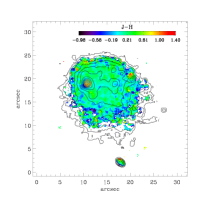
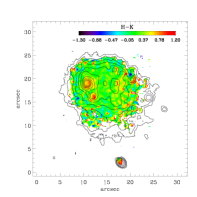
Figure 8 shows the surface brightness profiles (upper panels) of the isophotal mean intensity of each galaxy in the sample, considering pixels with 1 above the background, for the J, H, Kp and Br filters. Br is in arbitrary units. We measure the fainter level limits to be 23.50, 23.10 and 23.50 mag arcsec-2, 23.00, 23.10 and 23.40 mag arcsec-2, and 22.30, 22.50 and 23.00 mag arcsec-2 for Mrk 36, UM 408, and UM 461, respectively. The J-H and H-Kp color profiles are shown in the lower panels of Figure 8. We note that the color profiles show relatively constant underlying values at intermediate radii with a color gradient at large radii, indicating that their stellar populations must be fairly homogeneous in the main body of the galaxy with the presence of a old stellar population at large radii. In Figure 9 we show the pixel-to-pixel color map of the galaxies in order to compare the color spatial distribution of these galaxies with the profiles previously obtained. Again, we note that the color spatial distributions are relatively constant through the main body of the galaxies. The surface photometry of the galaxies were corrected only for Galactic extinction using the relation with RV=AV/E(B-V)=3.1 (Cardelli et al., 1989) and adopting the values from the extinction map of Schlegel et al. (1998) showed in Table 1 Column (7). We did not apply any smoothing procedure to our data in order to obtain the surface brightness at large radii.
We see that the outer part of the light profiles in Figure 8 are well represented by an exponential model (e.g., Papaderos et al., 1996; Telles & Terlevich, 1997; Cairós et al., 2003; Noeske et al., 2003, 2005) thus other functions are not necessary. We can express this profile in terms of the surface brightness, so we can find that =+(1.086/)r, where corresponds to the central surface brightness and the scale length with =J, H and Kp. Column (1) of Table 4 gives the name of the galaxies. Columns (2), (3) and (4) give the , parameters and m magnitudes of the LSB component described below in § 3.2.2, respectively. These parameters will be used in § 3.2.2 in order to calculate the integrated properties of the LSB component.
3.2.2 The integrated properties of the LSB component
The total apparent magnitude of the LSB component can be obtained using that mLSB = - 5 log() - 1.995 - 2.5 log(1-), where correspond to the ellipticity derived from the surface brightness profile (with constant values of =0.40, 0.30 and 0.33 for the galaxies Mrk 36, UM 408 and UM 461, respectively). So, we calculated the J-H and H-K colors of the LSB component from the results of the exponential fits. The colors of the LSB component in Mrk 36 are similar to those obtained previously in the literature by Cairós et al. (2003) with J-H=0.37 and H-Ks=0.28 from exponential fits. For UM 461, Noeske et al. (2003) found J-H and H-Ks colors, of the LSB component, that disagree and agree with our values at 1 level, respectively. The reason for this disagreement could be the uncertainties in the sky estimation and/or the aperture differences in both studies causing the surface brightness profile obtained by Noeske et al. (2003) to be deeper with the radius compared with our profiles, thus producing higher slopes of the profiles at large radii. In summary, the LSB component of our sample of galaxies show blue J-H colors and red H-K that suggest a photometrically dominant stellar population of ages 108 yr. Our interpretation agrees with the age estimates given by Raimann et al. (2000) and Westera et al. (2004) for a sample of H ii galaxies (in which they include UM 408 and UM 461 in their analysis) by means of spectral population synthesis.
Finally, we estimated the stellar mass (M∗) of the LSB component for each galaxy using the ML relationship for the H-band (see López-Sánchez, 2010). We found that the stellar mass for our sample of galaxies are log(M∗)= 7.89, 8.33, and 7.88 M⊙ for Mrk 36, UM 408, and UM 461, respectively. These stellar masses are typical for BCD galaxies calculated using different photometric bands, and dominated by the contribution of the intermediate to old stellar population (e.g., 3107M⊙ for Mrk 36; Amorín et al., 2009).
4 Discussion
Star formation occurs when the local molecular gas density exceeds a certain threshold (see Leroy et al., 2008, and references therein), given first possibly by collisions of gas clouds, due to turbulence or gravity, and then triggered by the action of massive star evolution, e.g. stellar winds from star clusters and SNe. In many cases, the current star-formation may be triggered by external agents, as in the case of the tidal forces by a neighboring galaxy or mergers. However, for a fraction of isolated, less luminous and compact H ii galaxies, this star-formation activity may occur solely by internal processes.
The SF activity may form a fraction of bound star clusters that will survive their infant mortality and evolve. Bastian (2008) has defined the value of the present cluster formation efficiency in a host galaxy as CFR/SFR, where CFR = Mtot/t is the present cluster formation rate at which the galaxy produces a total cluster mass Mtot in a given age interval t. On the other hand, Goddard et al. (2010) found a correlation between the value of the present cluster formation efficiency and the SF density of the host galaxy in a sample of starburst galaxies, (%)=29 M⊙ yr-1 kpc-2, where is the total SFR per unit of area.
The first step in the determination of the star cluster formation efficiency in our sample of galaxies is the determination of the total SF rate (SFR). We calculate the total SFR222We multiplied the SFR by a factor 0.67 obtained from the comparison between the SFR of our galaxies using the Kennicutt (1998) and Calzetti et al. (2007) relationships This due to differences in the stellar IMF assumptions given that the Kennicutt (1998) relationship is based on a Salpeter IMF and the models which we adopted are based on a Kroupa IMF using the Kennicutt (1998) relationship for L(H). We use the integrated H flux obtained using continuum-free emission line broad band images, with L(H)/L(H)=2.87, by Lagos et al. (2007) for Mrk 36 and UM 461, and integrated integral field unit H flux obtained by Lagos et al. (2009) for UM 408. So we find that the total SFR(H) 0.078 M⊙ yr-1 in Mrk 36, 0.017 M⊙ yr-1 in UM 408, and 0.085 M⊙ yr-1 in UM 461. The SFR in our sample of galaxies is very low compared with other dwarf galaxies, such as Haro 11 (22 M⊙ yr-1; Adamo et al., 2010) and NGC 1519 (0.3626 M⊙ yr-1; Goddard et al., 2010) and in fact with respect to more irregular and luminous H ii/BCD galaxies, such as Tol 9 with a SFR(H)= 1.82 M⊙ yr-1 (López-Sánchez, 2010). Assuming a starburst area of 2 kpc2 in Mrk 36, 8.16 kpc2 in UM 408 and 1.62 kpc2 in UM 461, we found that the integrated SFR per unit of area in Mrk 36 is =0.039 M⊙ yr-1 kpc-2, in UM 408 is =0.002 M⊙ yr-1 kpc-2 and in UM 461 is =0.052 M⊙ yr-1 kpc-2, respectively. We can now calculate the expected value of using the correlation found by Goddard et al. (2010). Thus, we obtain that the cluster formation efficiency is 13% in Mrk 36, 7% in UM 408 and 14% in UM 461, respectively. Hence, the star cluster efficiency in our low luminosity H ii galaxies is approximately 10%. This current SF efficiency is lower than the ones found in more luminous BCD galaxies as Haro 11 (Adamo et al., 2010) with an efficiency of 38%.
Using the properties of our detected star clusters/complexes showed in Table 3, we calculate a total cluster/complex mass, by summing the masses, of 54.50104M⊙ in Mrk 36 (with a total mass in clusters 104M⊙ of 44.69104 M⊙), 13.81105M⊙ in UM 408 and 43.09104M⊙ in UM 461. So, we calculate that the fraction of the total cluster mass with respect to the LSB host galaxy mass in Mrk 36, considering our complete range in ages, is equal to 0.007, 0.006 in UM 408 and 0.006 in UM 461. This implies that the inferred total current SF mass is of the order of 1% of the underlying galaxy mass, in agreement with the estimate of Westera et al. (2004) that the past history of SF in the galaxies were more active than the present one. Additionally, we calculate the SFR per unit of area for the individual star clusters/complexes using our measured Br emission. From these, we obtain that in the brightest regions (clusters #1 and #5 in Mrk 36 and complex #5 in UM 461) the SFR per unit of area is compatible with the values observed in starburst galaxies with values 0.1 M⊙ yr-1 kpc-2 (Bastian et al., 2005, and references therein). While, the majority of the star clusters/complexes have values of the order of 0.01 M⊙ yr-1 kpc-2. If we use only the total mass in clusters 104M⊙ to calculate SF efficiency, we obtain that in Mrk 36 for an age of 20 Myr our result agree, within the uncertainties, with the one obtained using the relationship of Goddard et al. (2010). However, in the case of UM 408 and UM 461 the value of is extremely high, indicating that in these cases the star forming complexes are not resolved into individual clusters, resulting in a overestimation of the parameter.
We can also calculate the gas consumption time scale () or how long it would take before all the gas in the galaxies will be consumed at the current SFR. The consumption time scale is defined as the ratio between the available gas and the current SFR, = Mgas/SFR. Assuming the total amount of gas Mgas = MHI+MHe+M 2MHI (Leroy et al., 2005), we obtain that 0.5 Gyr in Mrk 36 (with MHI=2.0107M⊙; Thuan & Martin, 1981; Bravo-Alfaro et al., 2004), 77 Gyr in UM 408 (with MHI=6.53108M⊙; Salzer et al., 2002) and 2 Gyr in UM 461 (with MHI=0.98108M⊙; Smoker et al., 2000). The consumption timescales in Mrk 36 and UM 461 are significantly less than a Hubble time and comparable with the times observed in spiral galaxies (Kennicutt et al., 1994). So the SF cannot be sustained for the entire history of the galaxies, which indicates that these objects undergo a few or several short bursts of SF. While UM 408 has a gas consumption timescale longer than a Hubble time, indicating that likely the SF is relatively constant through the history of the galaxy or the HI halo may not be spatially available for the current SF.
Our findings also seem to indicate that the SF mode in our sample of low luminosity H ii galaxies is clumpy, similar to other dwarf galaxies (e.g., NGC 1569 and SBS 0335-052). These complexes or star-forming knots are formed by a few massive star clusters with masses 104M⊙ and high SFR per unit of area. Melena et al. (2009) found that the observed trends in the number and mass of the SF regions, in a sample of dwarf galaxies, is independent of the local environment and even the surrounding galaxy mass and is given by a mass function which stochastically favored SF in clusters (Adamo et al., 2010). Billett et al. (2002) show that SSCs may require special (or fortunate) circumstances to form in dwarf galaxies, but when they do, they are very massive (104-5M⊙) and form clumps or groups of similar ages. This suggests that these clumps are likely formed in localized regions of high pressure triggered by large scale ambient gravitational instabilities, given that in dwarf galaxies most of the ISM is at low pressure (Elmegreen & Hunter, 2000). The lack of external perturbers in the most compact and isolated galaxies indicates that an additional mechanism other than tidal interactions must be considered to explain this current SF activity. This mechanism may be related to the overall physical conditions of the ISM, particularly the gas surface densities, in conjunction with stochastic effects, that allow SF to take place. Alternatively, the low current SFR implies that a burst or a triggering is not necessary, simply that the SFR has been relatively constant. However, tidal interactions or mergers are likely the primary agent to trigger the current SF in luminous and more disturbed H ii galaxies as suggested by their morphology (e.g., Telles & Terlevich, 1995; Lagos et al., 2007; López-Sánchez & Esteban, 2008).
5 Conclusions
In this paper, a sample of three H ii galaxies (Mrk 36, UM 408, and UM 461) has been analyzed in order to study their stellar populations (star cluster complexes and the underlying host galaxy or LSB component) using new near-IR high spatial resolution images obtained on the Gemini North telescope. In our analysis we used models that include the contribution of stellar continuum, nebular continuum and emission lines. Our conclusions can be summarized as follows:
-
1.
The presence of nebular continuum and emission lines in the near-IR produces an excess in the observed SED in young star cluster/complexes. This excess, can have a large impact in the inferred properties of the star clusters in H ii/BCD galaxies and models that include this effect are the most appropriate in the study of young stellar population with ages 6 Myr.
-
2.
We found that the star cluster population in Mrk 36 shows masses of 104-5M⊙ with a few detected star clusters with masses of 103M⊙ distributed in the main body of the galaxy. The star cluster complexes in UM 408 and UM 461 have masses from 104M⊙ to 106M⊙. The age distribution shows that the detected star clusters/complexes are very young with ages of a few Myr. Two likely old star clusters with colors consistent with ages 10-100 Myr have been detected in Mrk 36. The fraction of recent SF in bound clusters and/or complexes more massive than 104M⊙ is compared to the current total SFR is about 10% in our sample of galaxies.
-
3.
The spatial distribution and ages of the star cluster/complex population seems to indicate that SF is clumpy and simultaneous. We propose that the current SF activity in our sample of low luminosity H ii galaxies is triggered by some internal mechanism instead of tidal interactions. This mechanism of SF may be related to the overall physical conditions of the ISM that produce the increase of surface densities in conjunction with stochastic effects within a time scale comparable to the mean age differences of the massive star cluster complexes.
-
4.
The LSB component of our sample of galaxies have near-IR colors representative of evolved stellar population of at least 108 yr. We found that the stellar mass of this component for our sample of galaxies are log(M∗)= 7.89, 8.33, and 7.88 M⊙ for Mrk 36, UM 408, and UM 461, respectively. The fraction of the total cluster mass with respect to the LSB hosting galaxy mass in our sample of galaxies, considering our complete range in ages, is less than 1%.
References
- Adamo et al. (2010) Adamo, A., Östlin, G., Zackrisson, E., Hayes, M., Cumming, R. J., & Micheva, G. 2010, MNRAS, 407, 870
- Adamo et al. (2011) Adamo, A., Östlin, G., Zackrisson, E., & Hayes, M. 2011, MNRAS, 414, 1793
- Amorín et al. (2009) Amorín, R., Aguerri, J. A. L., Muñoz-Tuñón, C., & Cairós, L. M. 2009, A&A, 501, 75
- Anders & Fritze-v. Alvensleben (2003) Anders, P., & Fritze-v. Alvensleben, U. 2003, A&A, 401, 1063
- Bastian et al. (2005) Bastian, N., Gieles, M., Efremov, Yu. N., & Lamers, H. J. G. L. M. 2005, A&A, 443, 79
- Bastian (2008) Bastian, N. 2008, MNRAS, 390, 759
- Bergvall & Östlin (2002) Bergvall, N., & Östlin, G. 2002, A&A, 390, 891
- Billett et al. (2002) Billett, O. H., Hunter, D. A., & Elmegreen, B. G. 2002, AJ, 123, 1454
- Bravo-Alfaro et al. (2004) Bravo-Alfaro, H., Brinks, E., Baker, A. J., Walter, F., & Kunth, D. 2004, AJ, 127, 264
- Cairós et al. (2003) Cairós, L. M., Caon, N., Papaderos, P., Noeske, K., Vílchez, J, M., Lorenzo, B. G., & Muñoz-Tuñón, C. 2003, ApJ, 593, 312
- Calzetti et al. (2007) Calzetti, D. et al. 2007, ApJ, 666, 870
- Chandar et al. (2004) Chandar, R., Leitherer, C., & Tremonti, C. A. 2004, ApJ, 604, 153
- Cardelli et al. (1989) Cardelli, J. A., Clayton, G. C., & Mathis, J. S. 1989, ApJ, 345, 245
- Conti (1991) Conti, P. S. 1991, ApJ, 377, 115
- Conti & Vacca (1994) Conti, P. S., & Vacca, W. D. 1994, ApJ, 423, 97
- Doublier et al. (2001) Doublier, V., Caulet, A., & Comte, G. 2001, A&A, 367, 33
- Elmegreen & Efremov (1997) Elmegreen, B. G., & Efremov, Y. N. 1997, ApJ, 480, 235
- Elmegreen & Hunter (2000) Elmegreen, B. G., & Hunter, D. A. 2000, ApJ, 540, 814
- Garcia-Vargas et al. (1995) Garcia-Vargas, M. L., Bressan, A., & Diaz, A. I. 1995, A&AS, 112, 13
- Gerola & Seiden (1978) Gerola, H., & Seiden, P. E. 1978, ApJ, 223, 129
- Gil de Paz et al. (2003) Gil de Paz, A., Madore, B. F., & Pevunova, O. 2003, ApJS, 147, 29
- Gil de Paz & Madore (2005) Gil de Paz, A., & Madore, B. F. 2005, ApJS, 156, 345
- Goddard et al. (2010) Goddard, Q. E., Bastian, N., & Kennicutt, R. C. 2010, MNRAS, 405, 857
- Harris (1991) Harris, W. E. 1991, ARA&A, 29, 543
- Hunt et al. (2003) Hunt, L. K., Thuan, T. X., & Izotov, Y. I. 2003, ApJ, 588, 281
- Hunter & Elmegreen (2004) Hunter, D. A. & Elmegreen, B. G. 2004, AJ, 128, 2170
- Hunter & Elmegreen (2006) Hunter, D. A., & Elmegreen, B. G. 2006, ApJS, 162, 49
- Izotov & Thuan (1998) Izotov, Y. I., & Thuan, T. X. 1998, ApJ, 500, 188
- Johnson & Kobulnicky (2003) Johnson, K. E., & Kobulnicky, H. A. 2003, ApJ, 597, 923
- Johnson et al. (2004) Johnson, K. E., Indebetouw, R., Watson, C., & Kobulnicky, H. A. 2004, AJ, 128, 610
- Kennicutt et al. (1994) Kennicutt, R. C., Tamblyn, P., & Congdon, C. W. 1994, ApJ, 435, 22
- Kennicutt (1998) Kennicutt, R. C. 1998, ARA&A, 36, 189
- Kotulla et al. (2009) Kotulla, R., Fritze, U., Weilbacher, P., & Anders, P. 2009, MNRAS, 396, 462
- Krisciunas et al. (1987) Krisciunas, K., Sinton, W., Tholen, K., Tokunaga, A., Golisch, W., Griep, D., Kaminski, C., Impey, C., & Christian, C. 1987, PASP, 99, 887
- Lagos et al. (2007) Lagos, P., Telles, E., & Melnick, J., 2007, A&A, 476, 89
- Lagos et al. (2009) Lagos, P., Telles, E., Muñoz-Tuñón, C., Carrasco, E., Cuisinier, F., & Tenorio-Tagle, G. 2009, AJ, 137, 5068
- Larsen (1999) Larsen, S. S. 1999, A&AS, 139, 393
- Larsen (2004) Larsen, S. S. 2004, A&A, 416, 537
- López-Sánchez & Esteban (2008) López-Sánchez, Á. R., & Esteban, C. 2008, A&A, 491, 131
- López-Sánchez (2010) López-Sánchez, Á. R. 2010, A&A, 521, 63
- Leitherer et al. (1999) Leitherer, C., Schaerer, D., Goldader, J. D., Delgado, R. M. G., Robert, C., Kune, D. F., de Mello, D. F., Devost, D., & Heckman, T. M. 1999, ApJS, 123, 3
- Leroy et al. (2005) Leroy, A., Bolatto, A. D., Simon, J. D., & Blitz, L. 2005, ApJ, 625, 763
- Leroy et al. (2008) Leroy, A. K., Walter, F., Brinks, E., Bigiel, F., de Blok, W. J. G., Madore, B., & Thornley, M. D. 2008, AJ, 136, 2782
- Massey & Hunter (1998) Massey, P., & Hunter, D. A. 1998, ApJ, 493, 180
- Maeder & Meynet (2001) Maeder, A., & Meynet, G. 2001, A&A, 373, 555
- Melena et al. (2009) Melena, N.W., Elmegreen, B. G., Hunter, D. A., & Zernow, L. 2009, AJ, 138, 1203
- Melo et al. (2005) Melo, V. P., Muñoz-Tuñón, C., Maiz-Apellaniz, J., & Tenorio-Tagle, G. 2005, ApJ, 619, 270
- Meurer et al. (1995) Meurer, G. R., Heckman, T. M., Leitherer, C., Kinney, A., Robert, C., & Garnett, D. R. 1995, AJ, 110, 2665
- Noeske et al. (2001) Noeske, K. G., Iglesias-Páramo, J., Vilchez, J. M., Papaderos, P., & Fricke, K. J. 2001, A&A, 371, 806
- Noeske et al. (2003) Noeske, K. G., Papaderos, P., Cairós, L. M., & Fricke, K. J. 2003, ApJ, 410, 481
- Noeske et al. (2005) Noeske, K. G., Papaderos, P., Cairós, L. M., & Fricke, K. J. 2005, ApJ, 429, 115
- O’Connell et al. (1994) O’Connell, R. W., Gallagher, J. S., & Hunter, D. A. 1994, ApJ, 433, 65O
- Papaderos et al. (1996) Papaderos, P., Loose, H. H., Thuan, T. X., & Fricke, K. J 1996, A&AS, 120, 207
- Papaderos et al. (1998) Papaderos, P., Izotov, Y. I., Fricke, K. J., Thuan, T. X., & Guseva, N. G. 1998, A&A, 338, 43
- Pelupessy et al. (2004) Pelupessy, F. I., van der Werf, P. P., & Icke, V. 2004, A&A, 422, 55
- Pustilnik et al. (2001) Pustilnik, S. A., Kniazev, A. Y., Lipovetsky, V. A., & Ugryumov, A. V. 2001, A&A, 373, 24
- Raimann et al. (2000) Raimann, D., Storchi-Bergmann, T., Bica, E., Melnick, J., & Schmitt, H. 2000, MNRAS, 316, 559
- Reines et al. (2008) Reines, A. E., Johnson, K. E., & Hunt, L. K. 2008, AJ, 136, 1415
- Reines et al. (2010) Reines A. E., Nidever D. L., Whelan D. G., & Johnson K. E. 2010, ApJ, 708, 26
- Rosa-González et al. (2007) Rosa-González, D., Schmitt, H. R., Terlevich, E., & Terlevich, R. 2007, ApJ, 654, 226
- Sargent & Searle (1970) Sargent, W. L. W., & Searle, L. 1970, ApJ, 162, 155
- Salzer et al. (2002) Salzer, J. J., Rosenberg, J. L., Weisstein, E. W., Mazzarella, J. M., & Bothun, G. D. 2002, ApJ, 124, 191
- Schlegel et al. (1998) Schlegel, D. J., Finkbeiner, D. P., & Davis, M. 1998, ApJ, 500, 525
- Smoker et al. (2000) Smoker, J. V., Davies, R. D., Axon, D. J., & Hummel, E. 2000, A&A, 361, 19
- Simpson et al. (2011) Simpson, C. E. et al. 2011, AJ, 142, 82
- Taylor (1997) Taylor, C. L. 1997, ApJ, 480, 524
- Taylor et al. (1995) Taylor, C. L., Brinks, E., Grashuis, R. M., & Skillman, E. D. 1995, ApJS, 99, 427
- Telles (1995) Telles, E. 1995, Ph.D thesis, Univ. Cambridge
- Telles & Terlevich (1995) Telles, E., & Terlevich, R. 1995, MNRAS, 275, 1
- Telles & Terlevich (1997) Telles, E., & Terlevich R. 1997, MNRAS, 286, 183
- Telles et al. (1997) Telles, E., Melnick, J., & Terlevich, R. 1997, MNRAS, 288, 78
- Telles & Maddox (2000) Telles, E., & Maddox, S. 2000, MNRAS, 311, 307
- Telles (2009) Telles, E. 2009, arXiv:0908.2966v1
- Thuan et al. (1997) Thuan, T. X., Izotov, Y. I., & Lipovetsky, V. A. 1997, ApJ, 477, 661
- Thuan & Martin (1981) Thuan, T. X., & Martin, G. E. 1981, ApJ, 247, 823
- Thuan (1983) Thuan, T. X. 1983, ApJ, 268, 667
- Van Zee et al. (1998) Van Zee, L., Skillman, E. D., & Salzer, J. J. 1998, AJ, 116, 1186
- van Eymeren et al. (2007) van Eymeren, J., Bomans, D. J., Weis, K., & Dettmar, R.-J. 2007, A&A, 474, 67
- Vanzi et al. (2000) Vanzi, L., Hunt, L. K., Thuan, T. X., & Izotov, Y. I. 2000, ApJ, 363, 493
- Vanzi et al. (2002) Vanzi, L., Hunt, L. K., & Thuan, T. X. 2002, ApJ, 390, 481
- Vanzi (2003) Vanzi, L. 2003, ApJ, 408, 523
- Vázquez et al. (2007) Vázquez, G. A., Leitherer, C., Schaerer, D., Meynet, G., & Maeder, A. 2007, ApJ, 663, 995
- Wainscoat & Cowie (1992) Wainscoat, R. J., & Cowie, L. L. 1992, AJ, 103, 332
- Walborn (1991) Walborn, N. R. 1991, IAUS, 148, 145
- Walborn et al. (2002) Walborn, N. R., Maíz-Apellániz, J., & Barbá, R. H. 2002, AJ, 124, 1601
- Westera et al. (2004) Westera, P., Cuisinier, F., Telles, E., & Kehrig, C. 2004, A&A, 423, 133
- Whitmore et al. (1999) Whitmore, B. C., Zhang, Q., Leitherer, C., Fall, S. M., Schweizer, F., & Miller, B. W. 1999, AJ, 118, 1551
- Witt & Vijh (2004) Witt, A. N., & Vijh, U. P. 2004, Astrophysics of Dust, 309, 115
- Zhang et al. (2001) Zhang, Q., Fall, S. M., & Whitmore, B. C. 2001, ApJ, 561, 727
| Object | 12+log(O/H) | c(H) | E(B-V)Gal | Date of | Filter | Exposure | Air mass | Cλ | |||
|---|---|---|---|---|---|---|---|---|---|---|---|
| (J2000) | (J2000) | (km/s) | Observation | Time (s) | (mag) | ||||||
| (1) | (2) | (3) | (4) | (5) | (6) | (7) | (8) | (9) | (10) | (11) | (12) |
| Mrk 36 | 11:04:44.0 | +29:07:48 | 646 | 7.81aaIzotov & Thuan (1998) | 0.02aaIzotov & Thuan (1998) | 0.031 | 2005-11-24 | ||||
| (12.95 Mpc) | J | 6(360) | 1.37 | 23.930.05 | |||||||
| H | 6(465) | 1.27 | 24.010.05 | ||||||||
| Kp | 12(375) | 1.15 | 23.570.06 | ||||||||
| Br | 6(340) | 1.08 | |||||||||
| UM 408 | 02:11:23.4 | +02:20:30 | 3598 | 7.87bbLagos et al. (2009) | 0.93bbLagos et al. (2009) | 0.037 | 2005-08-02 | ||||
| (45.70 Mpc) | J | 6(360) | 1.26 | 23.910.05 | |||||||
| H | 6(465) | 1.19 | 23.970.03 | ||||||||
| Kp | 12(375) | 1.10 | 23.490.04 | ||||||||
| Br | 6(340) | 1.06 | |||||||||
| UM 461 | 11:51:33.1 | -02:22:22 | 1039 | 7.78aaIzotov & Thuan (1998) | 0.12aaIzotov & Thuan (1998) | 0.018 | 2005-12-29 | ||||
| (19.20 Mpc) | J | 6(360) | 1.62 | 23.950.07 | |||||||
| H | 6(465) | 1.46 | 24.050.05 | ||||||||
| Kp | 12(375) | 1.28 | 23.540.02 | ||||||||
| Br | 6(340) | 1.18 |
Note. — Column (1) galaxy name. Columns (2) and (3) and coordinates (J2000), respectively. Column (4) heliocentric velocity (vel.) and the 3K CMB corrected distance from NED. Columns (5) and (6) oxygen abundance and extinction adopted in this work. Column (7) date of observation. Column (8) Galactic extinction obtained from the extinction maps of Schlegel et al. (1998). Column (9) filter used in each observation and finally columns (10) and (11) exposure time in s and the mean air mass of each observation, respectively. Column (12) shows the instrumental zero points Cλ with = J, H and Kp obtained for each run of observation.
| Object | J | H | Kp |
|---|---|---|---|
| (mag) | (mag) | (mag) | |
| (1) | (2) | (3) | (4) |
| Mrk 36 | 14.460.05 | 14.230.05 | 13.700.06 |
| UM 408 | 15.940.07 | 15.720.06 | 15.280.05 |
| UM 461 | 15.040.09 | 14.730.07 | 14.530.05 |
| Name | Cluster | Aperture radii | J | H | Kp | E(B-V) | Age | Mass | Log L(Br) |
|---|---|---|---|---|---|---|---|---|---|
| (arcsec) | (mag) | (mag) | (mag) | (mag) | (Myr) | (104M⊙) | (erg s-1) | ||
| (1) | (2) | (3) | (4) | (5) | (6) | (7) | (8) | (9) | (10) |
| Mrk 36 (catalog Mrk 36) | |||||||||
| 1† | 0.44 | 18.640.05 | 18.580.05 | 18.090.06 | 0.00 – 0.40 | 1.99 – 2.8 | 5.46 – 2.53 | 36.256 | |
| 2 | 0.39 | 20.010.05 | 20.130.05 | 19.440.06 | 0.00 – 0.35 | 1.25 – 1.1 | 1.73 – 0.64 | ||
| 3† | 0.28 | 19.980.05 | 19.580.05 | 19.400.06 | 0.50 – 0.75 | 10.11– 8.6 | 4.08 – 3.62 | 35.268 | |
| 4† | 0.30 | 19.880.05 | 19.510.05 | 19.240.06 | 1.00 – 1.00 | 5.07 – 5.5 | 3.49 – 1.77 | 35.818 | |
| 5† | 0.29 | 19.990.05 | 19.680.05 | 19.460.06 | 0.95 – 0.75 | 6.09 – 5.5 | 3.56 – 1.33 | 35.912 | |
| 6† | 0.37 | 19.840.05 | 19.450.05 | 19.190.06 | 1.00 – 1.00 | 5.07 – 5.5 | 3.66 – 1.86 | 35.314 | |
| 7† | 0.29 | 19.870.05 | 19.520.05 | 19.230.06 | 1.00 – 0.90 | 4.89 – 5.0 | 3.81 – 1.64 | 35.538 | |
| 8† | 0.40 | 18.830.05 | 18.620.05 | 18.450.06 | 0.60 – 0.50 | 5.62 – 5.9 | 6.78 – 3.60 | 35.072 | |
| 9 | 0.24 | 20.740.05 | 20.540.05 | 20.210.06 | 0.20 – 0.65 | 2.95 – 4.2 | 0.97 – 0.62 | ||
| 10 | 0.28 | 19.990.05 | 19.610.05 | 19.570.06 | 0.00 – 0.00 | 1000 – 19.3 | 45.62 – 4.50 | 35.523 | |
| 11 | 0.29 | 19.740.05 | 19.620.05 | 19.500.06 | 0.30 – 0.25 | 5.43 – 6.5 | 2.18 – 1.70 | ||
| 12† | 0.24 | 20.480.05 | 20.280.05 | 20.190.06 | 0.20 – 0.25 | 7.85 – 8.3 | 1.18 – 1.44 | 34.273 | |
| 13 | 0.29 | 20.570.05 | 20.430.05 | 20.060.06 | 0.00 – 0.45 | 2.78 – 4.0 | 0.99 – 0.70 | ||
| 14 | 0.32 | 20.620.05 | 20.370.05 | 20.050.06 | 0.45 – 0.75 | 3.67 – 4.3 | 1.37 – 0.71 | ||
| 15 | 0.43 | 20.970.05 | 20.830.05 | 20.210.06 | 0.30 – 0.75 | 1.25 – 1.0 | 0.91 – 0.36 | ||
| 16 | 0.38 | 21.100.05 | 20.970.05 | 20.500.06 | 0.00 – 0.65 | 1.64 – 3.5 | 0.60 – 0.42 | ||
| 17† | 0.56 | 19.390.05 | 19.100.05 | 18.820.06 | 0.75 – 0.80 | 4.46 – 4.8 | 5.52 – 2.26 | 35.374 | |
| 18 | 0.52 | 19.590.05 | 19.540.05 | 18.870.06 | 0.20 – 0.65 | 1.25 – 1.0 | 3.08 – 1.21 | ||
| 19† | 0.44 | 19.800.05 | 19.390.05 | 19.210.06 | 0.50 – 0.80 | 10.23 – 8.5 | 4.77 – 4.40 | 33.516 | |
| 20† | 0.40 | 19.990.05 | 19.700.05 | 19.390.06 | 0.70 – 0.70 | 4.16 – 4.5 | 3.03 – 1.33 | 35.497 | |
| 21 | 0.40 | 20.400.05 | 19.960.05 | 19.800.06 | 0.25 – 0.55 | 26.92– 9.6 | 3.39 – 2.26 | ||
| 22 | 0.27 | 21.190.05 | 21.050.05 | 20.760.06 | 0.00 – 0.50 | 2.95 – 4.3 | 0.54 – 0.34 | ||
| 23 | 0.41 | 20.280.05 | 19.920.05 | 19.610.06 | 1.00 – 1.00 | 4.57 – 4.8 | 2.90 – 1.18 | ||
| 24† | 0.47 | 19.750.05 | 19.350.05 | 19.140.06 | 0.85 – 0.95 | 15.85 – 7.9 | 9.72 – 4.79 | 35.060 | |
| 25† | 0.36 | 20.680.05 | 20.400.05 | 20.130.06 | 0.75 – 0.75 | 4.57 – 4.8 | 1.64 – 0.66 | 34.859 | |
| 26† | 0.33 | 20.750.05 | 20.500.05 | 20.100.06 | 0.05 – 0.85 | 1.25 – 4.1 | 0.89 – 0.77 | 34.829 | |
| 27 | 0.33 | 20.890.05 | 20.540.05 | 20.610.06 | 0.00 – 0.00 | 1000 – 17.9 | 17.20– 1.61 | ||
| 28† | 0.36 | 20.390.05 | 20.070.05 | 19.740.06 | 0.80 – 0.95 | 4.21 – 4.5 | 2.31 – 0.98 | 35.261 | |
| 29† | 0.40 | 19.990.05 | 19.760.05 | 19.320.06 | 0.10 – 0.80 | 1.25 – 4.0 | 1.87 – 1.60 | 33.584 | |
| 30 | 0.41 | 20.520.05 | 20.300.05 | 19.930.06 | 0.00 – 0.70 | 2.39 – 4.1 | 0.99 – 0.85 | ||
| 31† | 0.25 | 20.110.05 | 19.920.05 | 19.660.06 | 0.25 – 0.55 | 3.84 – 4.6 | 1.74 – 0.92 | 34.916 | |
| 32 | 0.50 | 20.570.05 | 20.310.05 | 19.930.06 | 0.35 – 0.85 | 2.88 – 4.2 | 1.32 – 0.86 | ||
| 33† | 0.26 | 20.140.05 | 20.060.05 | 19.710.06 | 0.00 – 0.35 | 2.88 – 4.0 | 1.44 – 0.95 | 34.997 | |
| UM 408 | |||||||||
| 1 | 0.40 | 20.520.05 | 20.050.03 | 19.740.04 | 1.00 – 1.00 | 9.66 – 5.1 | 43.69 – 13.48 | ||
| 2† | 0.53 | 18.950.05 | 18.530.03 | 18.240.04 | 1.00 – 1.00 | 5.07 – 5.2 | 110.22 – 54.26 | 36.087 | |
| 3† | 0.27 | 20.490.05 | 20.110.03 | 19.820.04 | 1.00 – 1.00 | 4.78 – 5.1 | 28.63 – 12.56 | 35.457 | |
| 4† | 0.33 | 20.190.05 | 19.880.03 | 19.440.04 | 0.25 – 1.00 | 1.25 – 4.1 | 21.88 – 18.57 | 35.495 | |
| 5† | 0.40 | 19.770.05 | 19.400.03 | 18.990.04 | 0.90 – 1.00 | 3.67 – 4.2 | 53.64 – 27.05 | 35.762 | |
| 6 | 0.17 | 21.630.05 | 21.180.03 | 20.920.04 | 1.00 – 1.00 | 7.94 – 8.2 | 9.81 – 12.21 | ||
| UM 461 | |||||||||
| 1 | 0.66 | 19.870.07 | 19.630.05 | 19.370.02 | 0.60 – 0.70 | 4.4 – 4.7 | 6.94– 2.85 | ||
| 2† | 0.86 | 17.340.07 | 17.500.05 | 16.860.02 | 0.00 – 0.15 | 2.0 – 1.0 | 38.74 – 14.33 | 37.206 | |
| 3 | 0.42 | 20.000.07 | 19.850.05 | 19.390.02 | 0.00 – 0.65 | 1.3 – 3.7 | 3.74 – 2.88 | ||
| 4 | 0.62 | 19.880.07 | 19.440.05 | 18.850.02 | 0.85 – 1.00 | 1.3 – 2.9 | 8.40 – 3.50 | ||
| 5 | 0.55 | 19.860.07 | 19.830.05 | 19.380.02 | 0.00 – 0.30 | 2.7 – 2.9 | 3.96 – 1.65 | ||
| 6 | 0.49 | 20.570.07 | 20.250.05 | 20.000.02 | 1.00 – 0.85 | 5.5 – 5.4 | 3.98 – 1.82 | ||
| 7 | 0.50 | 20.270.07 | 20.080.05 | 19.820.02 | 0.30 – 0.60 | 3.9 – 4.6 | 3.53 – 1.79 | ||
| 8 | 0.57 | 20.330.07 | 20.050.05 | 19.720.02 | 0.65 – 0.85 | 3.1 – 4.4 | 3.33 – 2.16 | ||
| 9 | 0.62 | 20.150.07 | 20.010.05 | 19.790.02 | 0.15 – 0.40 | 4.1 – 4.7 | 3.71 – 1.73 | ||
| 10 | 0.66 | 20.140.07 | 19.810.05 | 19.520.02 | 0.90 – 0.90 | 4.6 – 4.9 | 6.65 – 2.75 | ||
| 11 | 0.61 | 20.340.07 | 20.030.05 | 19.830.02 | 0.85 – 0.80 | 7.2 – 7.0 | 5.32 – 4.10 | ||
| 12 | 0.53 | 20.480.07 | 20.300.05 | 20.030.02 | 0.25 – 0.60 | 3.8 – 4.5 | 2.73 – 1.46 | ||
| 13 | 0.60 | 20.600.07 | 20.200.05 | 19.930.02 | 1.00 – 1.00 | 5.1 – 5.5 | 4.06 – 2.07 |
Note. — Column (1) galaxy name. Column (2) identification number of the star clusters/complexes. The † symbol indicates that Br emission were measured in the cluster. Column (3) aperture considered to obtain the photometry. Columns (4), (5) and (6) observed photometry in magnitude of each star cluster/complex in the filters J, H and Kp, respectively. Columns (7), (8) and (9) extinction E(B-V), age in units of Myr and the mass in units of M⊙ for models I and II, respectively. Finally Colum (10) give the Br luminosity.
| Object | |||
|---|---|---|---|
| (mag arcsec-2) | (mag arcsec-2) | (mag arcsec-2) | |
| (arcsec) | (arcsec) | (arcsec) | |
| mLSB,J | mLSB,H | m | |
| (mag) | (mag) | (mag) | |
| (1) | (2) | (3) | (4) |
| Mrk 36 | 18.64 | 18.25 | 18.38 |
| 3.79 | 3.75 | 4.43 | |
| 14.31 | 13.94 | 13.70 | |
| UM 408 | 18.90 | 18.03 | 18.19 |
| 1.91 | 1.48 | 1.84 | |
| 15.89 | 15.58 | 15.27 | |
| UM 461 | 19.51 | 19.02 | 19.11 |
| 3.69 | 3.37 | 3.84 | |
| 15.11 | 14.82 | 14.62 |