Short and Long GRBs: same emission mechanism?
Abstract
We study the spectral evolution on second and sub–second timescales in 11 long and 12 short Gamma Ray Bursts (GRBs) with peak flux 8.5 erg/cm2 s (8 keV–35 MeV) detected by the Fermi satellite. The peak flux correlates with the time–averaged peak energy in both classes of bursts. The peak energy evolution, as a function of time, tracks the evolution of the flux on short timescales in both short and long GRBs. We do not find evidence of an hard–to–soft spectral evolution. While short GRBs have observed peak energies larger than few MeV during most of their evolution, long GRBs can start with a softer peak energy (of few hundreds keV) and become as hard as short ones (i.e. with larger than few MeV) at the peak of their light curve. Six GRBs in our sample have a measured redshift. In these few cases we find that their correlations between the rest frame and the luminosity are less scattered than their correlations in the observer frame between the peak energy and the flux . We find that the rest frame of long bursts can be as high or even larger than that of short GRBs and that short and long GRBs follow the same correlation, despite the fact that they likely have different progenitors.
keywords:
Gamma-ray: bursts — Radiation mechanisms: non thermal1 Introduction
Since the discovery of the existence of the two classes of short and long GRBs, extensive studies of their prompt and afterglow properties have been finalized to outline similarities and differences. Short GRBs have optical and X–ray afterglows similar to those of long GRBs (e.g. Gehrels et al. 2008, Nysewander, Fruchter & Pe’er 2009) but, although still in a handful of cases, they are typically associated with galaxies of almost all types (e.g. Berger et al. 2009) at preferentially lower redshifts with respect to those of long events. The leading idea is that short and long GRBs have different progenitors although the mechanism producing their prompt and afterglow emission should be similar (e.g. see Lee & Ramirez Ruiz 2007 for a recent review).
The comparison of the prompt –ray emission showed that short GRBs are harder than long ones, if the hardness ratio is used as a proxy of the spectral hardness (Kouveliotou et al. 1993). Considering the time integrated spectra of samples of short and long GRBs in the BATSE population, Ghirlanda et al. (2009) found that short GRBs have a harder low energy spectral index while they have similar peak energy compared to long bursts. Both in short and long GRBs, correlations are found between and the fluence () and between and the peak flux () (Lloyd & Petrosian 1999, Ghirlanda et al. 2009, Nava et al. 2008, Nava et al. 2011b). In particular, while the - correlation is different for short and long GRBs (with short events having lower fluences for the same of long bursts), they follow the very same correlation. Fluence and peak flux are the properties commonly used to select samples of long and short bursts in comparative studies. Different selections, based on or , influence the resulting distributions of of the selected samples and lead to different conclusions on the short-long comparison. Selection based on the peak flux (Ghirlanda et al. 2009) results in similar distributions for long and short GRBs, while a selection based on the fluence leads to the conclusion that short bursts have on average larger peak energies (see Nava et al. 2011b for a detailed discussion of this effect).
Recently, Nava et al. (2011a) analysed the time integrated spectral properties of 438 GRBs detected by the Fermi satellite. Through this catalog, Nava et al. (2011b - N11b hereafter) confirmed previous results, based on the BATSE GRB population, of the existence of an and an correlation also in the Fermi sample and of the different spectral properties of short and long GRBs. Thanks to the wider energy range explored by the Gamma Burst Monitor (GBM, 8keV–35MeV) on board Fermi, N11b also found that the peak energy of Fermi short bursts can reach very high values (confirming, with a larger population of short GRBs, what found for the three brightest short events detected by Fermi – Guiriec et al. 2010). Such high values of are not so common in long bursts. However, these comparisons are typically done in terms of observed peak energies. It is still possible that the different redshift distribution of the two classes of GRBs (e.g. Guetta & Piran 2005) is at the origin of the difference in their distributions.
It was known that long BATSE GRBs show a strong spectral evolution (Ford et al. 1995; Ghirlanda, Celotti & Ghisellini 2002; Kaneko et al. 2006). This was confirmed also through time resolved spectral analysis of Swift bursts (Firmani et al. 2009). The study of the spectral evolution of Fermi long GRBs with measured redshifts (Ghirlanda et al. 2010, G10 hereafter) showed that a similar time resolved correlation exists within these sources. Such a positive correlation means that the observed peak energy tracks the flux during the lifetime of the GRB. The knowledge of for these events allowed to verify that a correlation in the rest frame similar to the (so called ”Yonetoku” correlation - originally discovered considering the GRB time–integrated spectra - Yonetoku et al. 2004) exists within individual bursts. A similar study on a sample of Fermi short GRBs (Ghirlanda et al. 2011, G11 hereafter) confirmed that also in this class there exists a time resolved correlation. These results suggest that a mechanism could be responsible for this internal (i.e. time dependent) correlation between the peak energy and the flux and that this mechanism is similar in long and short GRBs.
However, the sample of G10 considered 12 long Fermi bursts with measured redshifts (until the end of July 2009) while the sample of G11 considered short Fermi bursts selected on the basis of their peak flux and fluence (collected from the GCN circulars). Moreover, the analysis of G10 considered only the low energy NaI detectors (8 keV–1 MeV) of the GBM instrument, missing the possibility to measure high , while the spectral analysis of short GRBs of G11 included also the BGO detectors that extend the spectral coverage to 35 MeV.
A direct comparison of the spectral evolution of short and long GRBs detected by Fermi requires a similar selection of the two samples (see e.g. Nava et al. 2011b for a discussion of the different selection criteria adopted in the literature to construct short and long GRB samples) and an homogeneous spectral analysis over the wider energy spectral range accessible by the GBM instrument, i.e. 8 keV–35 MeV.
2 The sample
The first compilation of the spectral properties of GRBs detected by Fermi was recently published in Nava et al. (2011a, N11a hereafter). They analyzed the public data of 438 GRBs detected by the Fermi GBM up to March 2010. For 318 cases they could reliably constrain the peak energy of the spectrum by analyzing the time integrated spectrum between 8 keV and 35 MeV. Among these 318 GRBs, 274 are long and 44 are short. Long GRBs have a typical peak energy 160 keV and low energy photon spectral index . Short GRBs have harder peak energy (490 keV) and harder low energy spectral index ().
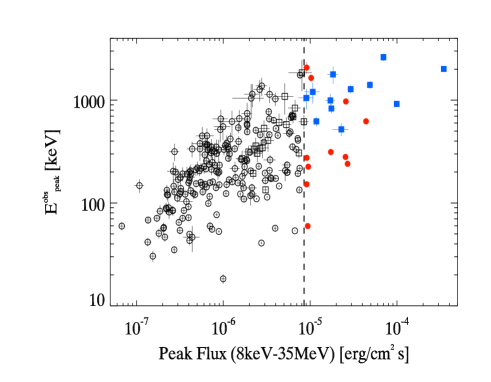
N11a also analyzed the spectrum corresponding to the peak flux of each GRB and in 235 (out of 438) cases they could constrain the peak energy . Among these (shown in Fig. 1) there are 31 short (squares in Fig. 1) and 204 long (circles in Fig. 1) events. The peak spectrum of a burst typically corresponds to the time interval of the maximum of the flux in the light curve. If the spectral evolution of the GRB peak energy is correlated with the flux (as found independently for short and long Fermi bursts in G10 and G11) then the selection on the peak flux ensures that we are considering the hardest short and long GRBs in the analyzed sample. Moreover, the typical selection of samples of long and short GRBs present in the literature adopts the peak count rate which is a rather poor proxy for the actual energy flux. The knowledge of the spectral shape for all bursts in the sample allows us to directly use the peak flux in physical units (8 keV–35 MeV energy flux in erg/cm2/s) which accounts for the shape of the spectrum and for the peak energy and ensures to select at the same time the brightest and the hardest bursts both in the short and long population.
We show in Fig. 1 the two selected samples of short (filled blue squares) and long (filled red circles) GRBs with (8 keV–35 MeV)8.5 erg/cm2 s. The names of the selected bursts are reported in Tab. 1 together with their duration. The latter is taken from the table of N11a. We note that this is not the parameter typically used to characterize the GRB duration, but the time interval over which the spectrum was accumulated and analyzed in N11a. This time was selected by–eye from the light curve of each GRB as the time interval in which the signal was above the background. We caution that this criterion may result in a duration which is smaller than the . However, all the short GRBs selected (except the short/hard burst 090510 detected by the Large Area Telescope on board Fermi - Abdo et al. 2009) have a duration much smaller than 2 seconds which is the empirical dividing line between short and long GRBs.
| GRB | Duration (s) | # Detectors | Max. res (ms) |
|---|---|---|---|
| 080802(386) | 0.384 | N4,N5,B0 | 32 |
| 080916(009) | 88.58 | N4,N3,B0 | 640 |
| 081209(981) | 0.320 | N8,N10,B1 | 16 |
| 081215(784) | 9.468 | N9,N10,B1 | 128 |
| 081216(531) | 0.768 | N8,N11,B1 | 8 |
| 090227(772) | 0.704 | N0,N1,N2,N5,B0 | 4 |
| 090228(204) | 0.512 | N0,N1,N2,N3,N5,B0 | 4 |
| 090328(713) | 0.192 | N0,N1,N2,N3,N5,B0 | 16 |
| 090424(592) | 34.046 | N8,N11,B1 | 64 |
| 090510(016) | 1.536 | N3,N6,N7,N8,N9,B0,B1 | 8 |
| 090617(208) | 0.256 | N3,N5,B0 | 16 |
| 090618(353) | 182.275 | N4,N7,B0,B1 | 2048 |
| 090719(063) | 19.709 | N7,N8,B1 | 1024 |
| 090820(027) | 32.769 | N2,N5,B0 | 64 |
| 090829(672) | 93.186 | N6,N10,B1 | 1024 |
| 090902(462) | 30.207 | N0,N1,N2,B0 | 192 |
| 090926(181) | 19.709 | N3,N7,B0,B1 | 192 |
| 091012(783) | 0.832 | N10,N11,B1 | 32 |
| 091127(976) | 13.054 | N7,N9,B1 | 64 |
| 100116(897) | 47.104 | N0,N3,B0 | 1024 |
| 100206(563) | 0.256 | N3,N5,B0 | 8 |
| 100223(110) | 0.384 | N7,N8,B1 | 16 |
| 100328(141) | 0.768 | N6,N11,B1 | 32 |
3 Spectral analysis
The GBM (Meegan et al. 2009) comprises 12 thallium sodium iodide [NaI(Tl)] and two bismuth germanate (BGO) scintillation detectors which cover the energy ranges 8 keV–1 MeV and 300 keV–40 MeV, respectively. The GBM acquires different data types for the spectral analysis (Meegan et al. 2009) among which the “TTE” event data files containing individual photons with time and energy tags. Here we analyze TTE data for both short and long GRBs111For the very long GRB 090618 we use the CSPEC data. because they allow to perform a time resolved spectral analysis on sub–second timescales for short GRBs. CSPEC data, with a maximum time resolution of 1.024s, are not suitable for time resolved spectral analysis of short GRBs with typical duration 2 s.
For the time resolved spectral analysis we used the recently released software RMFIT222http://fermi.gsfc.nasa.gov/ssc/data/analysis/user/ (v33pr7). In order to model the background spectrum for the time resolved spectral analysis, we selected two time intervals before and after the burst. The sequence of background spectra in the two selected intervals were fitted with a first order polynomial to account for the possible time variation of the background spectrum. Then the background spectrum was extrapolated to the time intervals selected for the time resolved spectroscopy of individual GRBs.
We jointly fitted the spectra from at least 2 NaI and 1 BGO detector which had the largest illumination by the GRB. The inclusion of the BGO data extends the spectral coverage of the NaI detectors from 1 MeV to 35 MeV. Particularly bright short bursts (090227, 090228, 090328) were analyzed including more than 2 NaI (and for 090510 both BGO detectors) as done by Guirec et al. (2010). We performed a time resolved spectral analysis by progressively reducing the time bin duration. For the brightest GRBs of our sample (i.e. GRB 090510 and GRB 090227 both of the short class) we performed a time resolved spectral analysis down to 4 ms. In general the time resolution within a GRB is higher near the peak and lower along the tails of the burst. This was determined by the requirement that all the parameters of the fitted model to each time resolved spectrum could be constrained (i.e. their associated statistical errors determined with an accuracy 100 %). In order to have a reasonable number of time resolved spectra and to make the plot of Fig. 2 readable, we limited the time resolution to 1024 or 2048 ms for particularly long GRBs. In Tab. 1 (last column) we report for each GRB analyzed the shortest time bin on which their spectrum was analyzed.
The model adopted for the time resolved spectral analysis is a power law with an exponential cutoff whose free parameters are the low energy spectral index , the peak energy (i.e the peak of the spectrum), and the normalization. The choice of this model is motivated by the fact that at high energies the response of the BGO rapidly decreases for increasing energy so that it is hard, in single time resolved spectra, to constrain the possible presence of a power law component of e.g. the Band function (Band et al. 1993) which is instead typically fitted to the time integrated spectra of long GRBs (see also N11b for a discussion on the model choice). The choice of the same model for the time resolved analysis of short and long GRB spectra ensures that if the model is introducing any systematic effect in the estimate of some of its spectral parameters, this is common to all the analyzed spectra. Note that if short and long GRBs spectra have intrinsically different shapes (e.g. a Band model for long and a cutoff–powerlaw for short) our choice would introduce a systematic effect, i.e. an overestimate of the peak energy of long GRBs (e.g. Kaneko et al. 2006). Still it is hard, in time resolved spectra, to distinguish between a cutoff–powerlaw model and a Band function given the lower response of the instrument at high energies and the low fluxes of single time resolved spectra.
4 Results
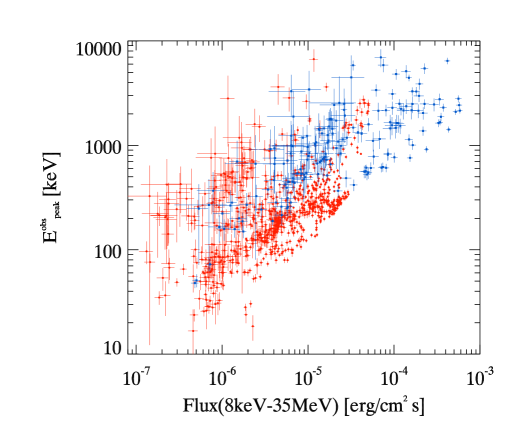
By considering the evolution of the peak energy of the spectrum and the energy flux (integrated over the 8 keV–35 MeV energy range), we find that in most bursts there is a tracking pattern. This is shown by the strong correlation between and shown in Fig. 2. This correlation is shown for both short (filled blue squares) and long (filled red circles) GRBs and extends over four and three decades in and respectively. By considering long and short GRBs separately, the Spearman correlation coefficient is =0.54 (with a chance probability of ) and =0.74 (with a chance probability of ) for long and short GRBs, respectively.
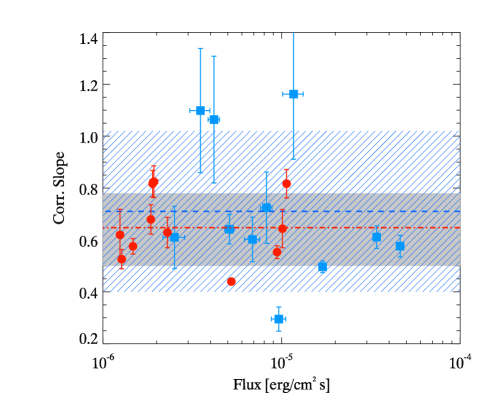
We also fitted the correlation within the 12 short and 11 long GRBs considered individually. The slopes of the correlation for individual bursts are shown in Fig. 3 with different symbols for long (filled red circles) and short (filled blue squares) GRBs. Fig. 3 also shows the slope (dashed and dot–dashed lines) obtained by averaging the slopes of short and long GRBs. The slopes of the correlation in the sample of short GRBs are more scattered, with also one case (i.e. GRB 081209) having a very flat correlation. In general the correlation slopes of short and long GRBs are similar (as shown by their average values) and consistent with a typical slope of 0.5 also found within the sample of Fermi GRBs by considering the time integrated spectra (N11b). Moreover, this is also consistent with the slope of the “classical” Yonetoku correlation, , (which is computed in the rest frame for bursts with measured redshifts) obtained considering the time integrated spectra of long and short GRBs (see e.g. G10 for a recent compilation of this correlation).
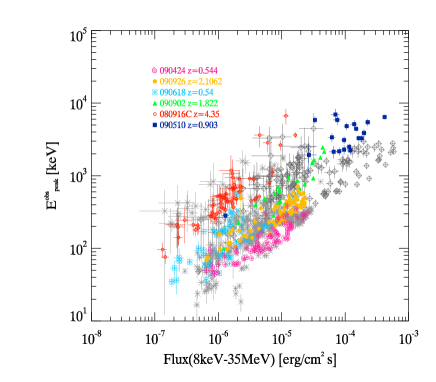
Short and long GRBs follow the same correlation but they are slightly displaced in Fig. 2, with short GRBs having larger fluxes and peak energies with respect to long GRBs, similarly to what found with the time integrated spectral properties of Fermi and BATSE long and short GRBs (N11b). However, among the sample of long GRBs there is GRB 080916C whose peak energy reaches values of few tens of MeV at the peak and becomes as hard as short GRBs (better shown in Fig. 4 - left panel).
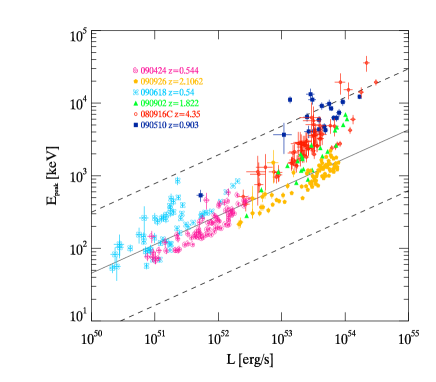
The quantities plotted in Fig. 2 are in the observer frame. Since the average redshift of long GRBs is larger than that of short ones, the displacement shown by Fig. 2 between short and long is probably reduced in the rest frame. In our samples of bursts there are 6 bursts with known . Among these one is the short GRB 090510 at z=0.903. In Fig. 4 we highlight with colors and different symbols these bursts in the observer frame (left panel) and in the rest frame (right panel). We notice that when transforming from the observer frame to the rest frame the scatter of the correlations of these 6 bursts is evidently reduced. Moreover, in the rest frame (right panel in Fig.4) the long GRB 080916C (at ) has the largest peak energies (i.e. larger than the short GRB 090510).
5 Discussion and Conclusions
Compared to previous analysis (G10, G11 and Guiriec et al. 2010) that considered separately short and long GRBs selected for their peak flux or fluence, here we ensure to have a complete sample down to our selection threshold. Moreover, we performed a homogeneous time resolved analysis of these bursts over the 8 keV – 35 MeV energy range by combining the NaI and BGO detectors of the GBM instrument on board Fermi.
We find that both short and long GRBs follow a strong correlation in the observer frame (Fig. 2). Considering single bursts, the slopes of the correlation are consistent with a 0.5 (with short GRBs having a larger scatter of the values of than long ones, see Fig. 3).
The existence of a correlation in short and long GRBs indicates that the typical spectral evolution in both classes of events is tracking rather than hard–to–soft. This result is different from the dominating hard–to–soft spectral evolution found in a sample of BATSE bursts (Hakkila & Preece 2011) and in agreement with past studies based on the time resolved spectral modeling of bright BATSE GRBs (Ford et al. 1996, Ghirlanda et al. 2003). A possible reason could be that here we model the single time resolved spectra in each GRB with a spectral model (the cutoff–power law function) and use the resulting as a proxy of the GRB hardness instead of the count hardness ratio as done in Hakkila & Preece (2011).
Only 6 GRBs in our sample have measured reshifts and, among these, we have only one short GRB. Fig. 4 shows that in the plane these bursts have a reduced scatter with respect to the plane. Moreover, in the rest frame plane, long bursts can reach values of as large as those of the only short one with known , contrary to what occurs for the observed values (see e.g. Guirec et al. 2010). If these results, now based on a very limited number of events, would be confirmed by the addition of short and long GRBs with measured redshifts with a time resolved spectral analysis, it could indicate that short bursts appear harder (i.e. larger ), than long GRBs, only because of their different average redshift. Interestingly, the 6 GRBs with measured redshift have individual time resolved correlations which are all consistent with the correlation (solid line in Fig.3) found with the time integrated spectra of a much larger sample of GRBs.
Several interpretations of the correlations have been proposed so far: (a) kinematic interpretations in which the link between and is established by the configuration of the emission region (Yamazaki et al. 2004; Nakamura 2000; Kumar & Piran 2000; Toma et al. 2005; Eichler & Levinson 2004); (b) radiative interpretations in which it is the emission mechanism of the prompt phase to link and , as in the case of a spectrum dominated by a thermal component (Ryde et al. 2006; Thompson, Meszaros & Rees 2007) or in the case of magnetic reconnection (Giannios & Spruit, 2007) or (c) both radiative and geometric effects (Lazzati et al. 2010) . All these interpretations however considered the time integrated correlation found in the population of long GRBs. Here we have shown that two new ingredients should be considered: (1) that a time resolved correlation exists within individual GRBs and that (2) this is similar in the population of long and short GRBs. Among the above mentioned models, Giannios & Spruit (2007) predict that a time resolved correlation should exists within single GRBs and that more luminous GRBs should have a larger baryon loading.
Our results indicate that both short and long GRB have in common a similar physical mechanism that link the flux and the peak energy within individual bursts as a function of time. If short and long GRBs have a different progenitor (the merger of two compact objects and the death of a massive star respectively) the similar correlation found in both populations should arise from the similar emission mechanisms (independent of the type of progenitor). We have shown that within individual GRBs (when considering time resolved spectra) there is strong correlation between the peak energy and the peak flux (or luminosity for the few events with measured redshifts) and this correlation has the same slope of the correlation defined among different GRBs (by considering their time integrated spectral properties - either the peak energy–peak flux correlation or the peak energy–luminosity Yonetoku correlation). The found correlation cannot be due to the detector threshold, and its coincidence with the correlation found among different GRBs suggests that the latter is not due to instrumental selection effects but should have instead a physical origin.
Acknowledgments
We acknowledge ASI (I/088/06/0) and a 2010 PRIN–INAF grant for financial support. This research has made use of the data obtained through the High Energy Astrophysics Science Archive Research Center Online Service, provided by the NASA/Goddard Space Flight Center. LN thank the Brera Observatory for the kind hospitality during the completion of this work. We are grateful to E. Nakar for useful comments that improved the manuscript.
References
- [1] Abdo, A. A., Ackermann, M., Ajello, M., et al., 2009, Nature, 462, 331
- [2] Band, D., Matteson, J., Ford, L. et al. 1993, ApJ, 413, 281
- [3] Berger, E. 2006, “Gamma-Ray Bursts in the Swift Era” conference proceeding, AIP, 836, 33
- [4] Berger, E., 2009, ApJ, 690, 231
- [5] Butler, N. R., Kocevski, D., Bloom, J. S., & Curtis, J. L. 2007, ApJ, 671, 656
- [6] Butler, N. R., Kocevski, D., & Bloom, J. S. 2009, ApJ, 694, 76
- [7] Eichler, D., & Levinson, A. 2005, ApJ, 635, 1182
- [8] Firmani, C.; Cabrera, J. I.; Avila-Reese, V., et al., 2009, MNRAS, 393, 1209
- [9] Ford, L. A.; Band, D. L.; Matteson, J. L., 1995, ApJ, 439, 307
- [10] Gehrels, N.; Barthelmy, S. D.; Burrows, D. N. et al., 2008, ApJ, 689, 1161
- [11] Ghirlanda, G., Celotti, A., & Ghisellini, G. 2002, A&A, 393, 409
- [12] Ghirlanda, G., Ghisellini, G. & Celotti, A., 2004, A&A, 422,L55
- [13] Ghirlanda, G., Nava, L., Ghisellini, G., Firmani, C., Cabrera, J.I., 2008, MNRAS, 387, 319
- [14] Ghirlanda, G.; Nava, L.; Ghisellini, G.; Celotti, A.; Firmani, C., 2009, A&A, 496, 585
- [15] Ghirlanda, G.; Nava, L.; Ghisellini G., 2010, A&A, 511, 43
- [16] Giannios, D., & Spruit, H. C. 2007, A&A, 469, 1
- [17] Guetta, D. & PIran, T., 2005, A&A, 435, 421
- [18] Guiriec, S.; Briggs, M. S.; Connaugthon, V., et al., 2010, ApJ, 725, 225
- [19] Hakkila, J., & Preece, R., 2011, ApJ subm., arXiv:1103.5434
- [20] Kaneko, Y.; Preece, R. D.; Briggs, M. S.; 2006, ApJS, 166, 298
- [21] Kouveliotou, C., Meegan, C. A.. Fishman, G. J. et al. 1993, ApJ, 413, L101
- [22] Lazzati, D., Morsony, B. J., Begelman, M. C., 2011, ApJ, 732, 34
- [23] Lee, W. H. and Ramirez-Ruiz, E. 2007, NJPh, 9, 17
- [24] Lloyd, N. & Petrosian, V., 1999, ApJ, 511, 550
- [25] Nava, L., Ghirlanda, G., Ghisellini, G, Firmani, C. 2008, MNRAS, 391, 639
- [26] Nava, L., Ghirlanda, G., Ghisellini, Celotti, A., 2011a, A&A 530, A21 (N11a)
- [27] Nava, L., Ghirlanda, G., Ghisellini, Celotti, A., 2011b, MNRAS in press., arXiv:1004.1410 (N11b)
- [28] Nysewander, M.; Fruchter, A. S.; Pe’er, A., 2009, ApJ, 701, 824
- [29] Ryde, F., Bjornsson, C., Kaneko, Y., et al. 2006, ApJ, 652, 1400
- [30] Toma, K., Yamazaki, R., & Nakamura, T. 2005, ApJ, 635, 481
- [31] Thompson, C., Meszaros, P., & Rees M. J. 2007, ApJ, 666, 1012
- [32] Yamazaki, R., Ioka, K., & Nakamura, T. 2004, ApJ, 606, L33
- [33] Yonetoku, D., Murakami, T., Nakamura, T. et al. 2004, ApJ, 609, 935