CO and H2 Absorption in the AA Tauri Circumstellar Disk**affiliation: Based on observations made with the NASA/ESA , obtained from the data archive at the Space Telescope Science Institute. STScI is operated by the Association of Universities for Research in Astronomy, Inc. under NASA contract NAS 5-26555.
Abstract
The direct study of molecular gas in inner protoplanetary disks is complicated by uncertainties in the spatial distribution of the gas, the time-variability of the source, and the comparison of observations across a wide range of wavelengths. Some of these challenges can be mitigated with far-ultraviolet spectroscopy. Using new observations obtained with the Hubble Space Telescope-Cosmic Origins Spectrograph, we measure column densities and rovibrational temperatures for CO and H2 observed on the line-of-sight through the AA Tauri circumstellar disk. CO – absorption bands are observed against the far-UV continuum. The CO absorption is characterized by log10((12CO)) = 17.5 0.5 cm-2 and (CO) = 500 K, although this rotational temperature may underestimate the local kinetic temperature of the CO-bearing gas. We also detect 13CO in absorption with an isotopic ratio of 20. We do not observe H2 absorption against the continuum; however, hot H2 ( 0) is detected in absorption against the Ly emission line. We measure the column densities in eight individual rovibrational states, determining a total log10(N(H2)) = 17.9 cm-2 with a thermal temperature of (H2) = 2500 K. The high-temperature of the molecules, the relatively small H2 column density, and the high-inclination of the AA Tauri disk suggest that the absorbing gas resides in an inner disk atmosphere. If the H2 and CO are co-spatial within a molecular layer 0.6 AU thick, this region is characterized by 105 cm-3 with an observed CO/H2 ratio of 0.4. We also find evidence for a departure from a purely thermal H2 distribution, suggesting that excitation by continuum photons and H2 formation may be altering the level populations in the molecular gas.
Subject headings:
protoplanetary disks — stars: individual (AA Tau)1. Introduction
Molecular hydrogen (H2) is the primary constituent of giant planets, both in the solar system (Stevenson, 1982) and in extrasolar systems (Sudarsky et al., 2003). H2 is typically assumed to make up the majority of the mass in disks where giant planets form. Owing in part to its lack of permanent dipole moment, H2 does not emit or absorb strongly in spectral regions easily accessible from the ground, and is therefore challenging to observe directly. The second most abundant molecule in these disks, carbon monoxide (CO), is often observed as a surrogate for H2 (Salyk et al., 2007; Rodriguez et al., 2010). The use of CO as a tracer for H2, and therefore as a tracer of the molecular gas mass of the inner disk, relies on a CO/H2 conversion factor. In practice, this conversion factor is only well-constrained observationally in diffuse and translucent interstellar clouds (Burgh et al., 2007). In dense clouds, model calculations of the CO/H2 ratio (defined here as (CO)/(H2)) tend towards 1 – 3 10-4 (see e.g., Visser et al. 2009 and references therein). This is in agreement with an extrapolation of the translucent cloud trend, but has only been verified on one sightline (Lacy et al., 1994). The CO/H2 ratio in low-mass protoplanetary disks, in particular at planet-forming radii ( 10 AU), is almost completely unconstrained by direct observation.
A better understanding of the relationship between H2 and CO in the inner regions of protoplanetary disks can give a more complete picture of the composition and structure of planet-forming regions. In addition to questions of abundance, the distribution of molecular gas and its physical characteristics are of interest for models of giant planet formation and their migration (see Najita et al. 2007 for a review of molecular gas in inner disks). The far-ultraviolet (far-UV) bandpass provides access to the strongest dipole-allowed bands systems of both H2 and CO. Due to large opacities of dust and gas, far-UV photons do not probe the disk midplane directly. However, far-UV spectroscopy offers the most direct means of simultaneously measuring H2 and CO in the upper layers of inner disks.
Far-UV spectroscopy has proven to be an effective technique for probing the environments of young circumstellar disks. First with the International Ultraviolet Explorer () (Brown et al., 1981; Valenti et al., 2000), then with the Far-Ultraviolet Spectroscopic Explorer (; Wilkinson et al. 2002; Herczeg et al. 2005) and the Hubble Space Telescope-Space Telescope Imaging Spectrograph (-STIS) and Goddard High-Resolution Spectrograph (GHRS; Ardila et al. 2002; Herczeg et al. 2002; Walter et al. 2003), and today with -Cosmic Origins Spectrograph (COS; Ingleby et al. 2011; France et al. 2011b). The majority of these observational efforts have focused on the detection of H2 fluorescence from hot molecular, inner disk ( 2 AU; Herczeg et al. 2004) gas illuminated by Ly (Ardila et al., 2002) and other atomic lines (Wilkinson et al., 2002; France et al., 2007). The order of magnitude gains in spectroscopic sensitivity afforded by COS have made it possible to expand these studies to the ultraviolet emission lines of CO (France et al. 2011a), enabling direct comparison of the dominant molecular species in these objects. Recently, Yang et al. (2011) and France et al. (2011a) have presented the first detections of H2 and CO absorption, respectively, in the UV spectra of Classical T Tauri Stars (CTTSs). In this paper, we present unique -COS observations of a sightline through the upper atmosphere of the AA Tauri circumstellar disk where we detect the absorption lines of H2 and CO.
Our paper is laid out as follows: In §2, we describe the COS observations and data reduction. In §3, we discuss the qualitative features of the AA Tau spectrum and the data analysis performed to derive the H2 and CO column densities in the AA Tau disk. We use these results to constrain the physical conditions of both molecules in §4, including the spatial distribution of the gas and the role of UV photons in regulating the molecular level populations. We present a brief summary of the paper in §5. The details of our modeling and the non-detection of H2 against the UV continuum of AA Tau are presented in an Appendix.
2. -COS Observations of AA Tau
2.1. AA Tau
AA Tau is a well-studied K7 classical T Tauri star in the Taurus Molecular Cloud with an age of 1–3 Myr (Bouvier et al., 1999; White & Ghez, 2001; Kraus & Hillenbrand, 2009). The mass-accretion rate onto AA Tau based on -band observations has been observed to be in the range 3.3 – 7.1 10-9 yr-1 (Valenti et al. 1993; Gullbring et al. 1998; White & Ghez 2001). Both high-resolution dust disk imaging (Andrews & Williams, 2007) and scattered light models of the photopolarimetric variability of the circumstellar material indicate a high disk inclination ( 75°; O’Sullivan et al. 2005, see also Bouvier et al. 1999).
Because of its high inclination, AA Tau has become the prototypical example of dipolar magnetospheric accretion onto the star (Bouvier et al. 2007; Donati et al. 2010). Periodically the magnetospheric accretion column passes in our line of sight, producing redshifted absorption in Balmer lines. This absorption often coincides with eclipses in the photometric light curve, which may be caused by a warp in the inner disk caused by the funnel flow. The eclipse periodicity of 8.22 0.03 days is likely similar to the stellar period.
Due to its relatively high extinction ( = 0.74; Gullbring et al. 1998), far-UV H2 emission was not detected towards AA Tau by (Valenti et al., 2000). As predicted by these authors, this emission was below the sensitivity limit of . AA Tau exhibits a far-UV excess characteristic of young disks (Ingleby et al., 2009). The higher-resolution UV spectra presented in this work reveal a wealth of molecular (H2 and CO) and atomic emission features consistent with active accretion of a gas-rich disk (§3.1). Najita et al. (2009) present ground-based mid-IR observations of the molecular inner disk ( 0.5 AU), traced by CO fundamental ( = 1) band emission and atomic emission ([Ne II]) from somewhat larger radii. Mid-IR spectra from the Spitzer Space Telescope show that the AA Tau disk has a rich chemistry of more complex molecules (H2O and OH) and organics such as HCN, C2H2 and CO2 (Carr & Najita, 2008). Bethell & Bergin (2009) use these results to demonstrate that water vapor formation may be common in CTTS disks and that water may be the dominant reservoir for oxygen in these systems. As the most abundant and stable molecules in the inner disk, H2 and CO are the building blocks for this complex chemistry.
2.2. Observations
AA Tau was observed by COS on 2011 January 06 and 07 (program ID 11616) during four contiguous spacecraft orbits. Target acquisition was performed in the MIRRORB near-UV imaging mode through the primary science aperture. The far-UV spectrum was obtained using multiple settings of the G130M and G160M gratings in order to achieve continuous, moderate resolution ( 17 km s-1)111The COS LSF experiences a wavelength dependent non-Gaussianity due to the introduction of mid-frequency wave-front errors produced by the polishing errors on the primary and secondary mirrors; http://www.stsci.edu/hst/cos/documents/isrs/. spectra in the 1133 1795 Å bandpass. Two central wavelength settings were used in the G130M mode (1291 and 1327) at two focal plane offset positions (FP-POS = 1,4). The G160M spectra were acquired at three central wavelengths (1577, 1600, 1623) at the default focal plane position (FP-POS = 3). In addition to providing continuous wavelength coverage across the far-UV bandpass, the use of multiple grating settings minimizes the impact from fixed pattern noise inherent to the microchannel plate detector. A complete description of the COS instrument and on-orbit performance characteristics can be found in Osterman et al. (2011). The one-dimensional spectra produced by the COS calibration pipeline, CALCOS, were aligned and coadded using the custom software procedure described by Danforth et al. (2010).
3. Results and Analysis
3.1. AA Tau Emission Spectrum
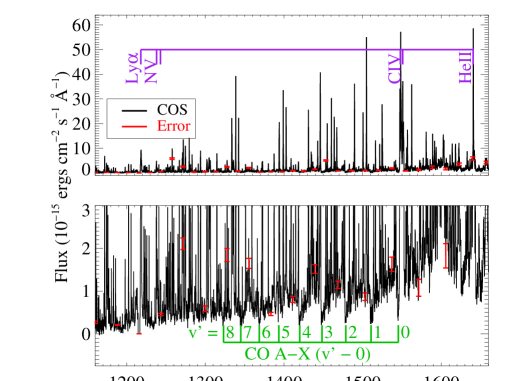
AA Tau displays a rich emission line spectrum across the far-UV bandpass (see Figure 1). The majority of the lines can be attributed to H2 fluorescence, excited by shock-driven H I Ly (see e.g., Herczeg et al. 2002). The signature of photo-excited CO – emission (France et al., 2011a) is also present. AA Tau displays a prominent 1550 – 1650 Å excess that is attributed to a combination of collisionally excited H2 and CO – (0 – 1) band emission that may be fluorescently pumped through a coincidence with C IV (Bergin et al., 2004; France et al., 2011b, a).
Species tracing high-formation temperature regions ( 8 104 K) are present in the spectrum, including N V 1239, 1243, C IV 1548, 1550, and He II 1640 Å. These lines are likely formed in the funnel flows (Muzerolle et al., 2001) and active chromosphere/transition region (Johns-Krull et al., 2000; Bouvier et al., 2007). Lower excitation species such as Si III 1206, C II 1334, 1335, and Si II 1526, 1533 Å do not appear to be strong in the spectrum of AA Tau. The atomic species and CO fluorescence merit further investigation, however in this paper we focus on the molecular absorption spectrum through the AA Tau disk.
In the following subsections, we describe the analysis of the H2 and CO absorption features, recently identified for the first time in CTTS spectra (Yang et al., 2011; France et al., 2011a). We observe H2 absorption lines superimposed upon the shock-created Ly profile, and we describe the reconstruction of this profile and column density analysis of the absorbing gas in §3.2. We also detect CO – absorption against the far-UV continuum from AA Tau, and in §3.3, we describe the column density determination for this gas.
3.2. H2 Absorption Against the Ly Profile in AA Tau
H2 absorption has been observed against both the stellar continuum and transition region emission lines in Herbig Ae/Be stars (Roberge et al., 2001; Martin-Zaïdi et al., 2008). Molecular absorption in UV spectra of high-inclination CTTSs was beyond the detection limit of space-borne instruments prior to the installation of COS. Herczeg et al. (2004) presented a detailed analysis of H2 in the disk of TW Hya, including a reconstruction of the Ly line profile and determination of the H2 opacity in the disk atmosphere. Their work suggested that H2 absorption could in principle be detected against the Ly emission line in gas-rich disks. No other disks were observed by STIS at high enough S/N and resolving power to detect these absorptions, however, H2 absorption in CTTS systems has recently been detected against the wings of the strong Ly emission line (Yang et al., 2011). H2 absorption is observed against the red-wing of the Ly profile in AA Tau, shown in Figure 2. We do not observe H2 absorption against the far-UV continuum of AA Tau, and upper limits on the H2 for this absorption can be found in the Appendix. In the following subsections, we describe their measurement and derive the column density of hot H2 in the AA Tau disk.
3.2.1 Ly Profile Reconstruction
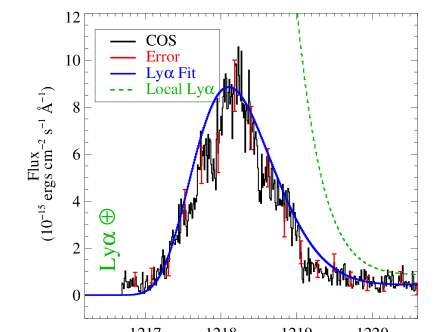
The H2 transmission spectrum is the ratio of an incident Ly profile to the data. We created a simple empirical fit to the Ly emission line + interstellar absorption in order to reproduce the red side of the line profile. First, we remove the 1214.5 – 1216.8 Å flux, which is dominated by geocoronal H I emission. H and H spectra of AA Tau display absorption characteristic of a an inner disk wind (Bouvier et al., 2007), and the blue side of the Ly line profile is heavily suppressed; its flux is a factor of 10 lower than the red wing of the line. This is presumably due to either an accelerating low-density outflow or an optically thick but patchy outflow at a single velocity. For the present work, we assume that the majority of the Ly emission profile is formed near the star and create a baseline on which to measure the H2 absorption spectrum.
We found that a single Gaussian emission line combined with a rest-velocity H I absorption component could provide satisfactory fits to the observed Ly spectrum, shown in Figure 2a. The Gaussian emission line is characterized by a peak amplitude of 2.65 10-12 erg cm-2 s-1 Å-1, a FWHM of 620 km s-1, and a continuum level of 9.5 10-16 erg cm-2 s-1 Å-1. An interstellar H I profile characterized by (HI) = 4.3 1020 cm-2 and = 10 km s-1 provides a good fit to the data. It is interesting to note that this column density corresponds to an extinction of = 0.28, assuming = 3.1 and the interstellar gas-to-dust relationship between (H I) and (Bohlin et al., 1978). That is a factor of 3 lower than the typically assumed for the AA Tau sightline, suggesting that a large fraction of the extinction derived from optical and near-IR studies arises in circumstellar material with a gas/dust ratio less than that in the general ISM. The parameters for the emission line may be an oversimplification of actual Ly profile in AA Tau, but the interstellar values are constrained by the inner and outer edges of the observed H I profile and are therefore fairly robust. There was a minor residual shape to the fit/data H2 transmission spectrum. This 10 % slope was fit by a spline function and removed.
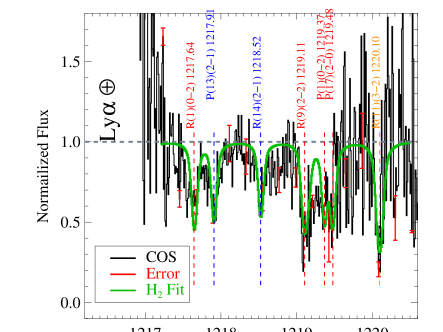
3.2.2 (H2,,)
The AA Tau H2 absorption spectrum is displayed in Figure 2b. The strongest H2 absorption lines are labeled. After dividing out the model Ly emission line, there is 2.8 Å of spectral region with high enough S/N for H2 profile fitting. We created a multi-component H2 fitting routine to measure the column density in the nine absorption lines into the Lyman ( – ) band system that contribute significantly to the molecular opacity between 1217.48 and 1220.30 Å222We note that there is a possible absorption on the blue side of Ly from the – (1 – 1) P(11) line at = 1212.55 Å, but the absorption depth is at the RMS noise level of the data at these wavelengths.. We create the intrinsic line profiles as a function of column density in a given rovibrational [,] level. These functions are added in optical depth space, a transmission curve is created, and this function is then convolved with the most recent COS line-spread function (Kriss, 2011) for comparison with the absorption spectrum. The best-fit multi-line H2 model is found using the MPFIT routine for a fixed = 5 km s-1 (see the Appendix for details of the H2 model). Initial conditions were determined by first manually fitting the H2 spectrum, and in order to remove bias introduced by these choices, a grid of initial conditions were searched. This method produced a total of 6000 individual realizations of the spectral fitting, and the best-fit column densities ((H2,,)) were taken from the mean of these distributions.
| Line IDaaTransitions are for the – H2 band system. | log (H2,,)bbColumn density and equivalent width calculations assume = 5 km s-1, see §3.2.2. | ccColumn densities, oscillator strengths, equivalent widths, and energy levels refer to the rovibrational level of the ground electronic state out of which the Ly photons are absorbed. | |||
|---|---|---|---|---|---|
| (Å) | (cm-2) | (mÅ) | (eV) | ||
| (0 – 2)R(1) | 1217.64 | 14.91 | 0.0289 | 59 | 1.02 |
| (2 – 1)P(13) | 1217.91 | 14.86 | 0.0192 | 52 | 1.64 |
| (2 – 1)R(14) | 1218.52 | 14.81 | 0.0181 | 49 | 1.79 |
| (0 – 2)R(2) | 1219.09 | 14.22 | 0.0255 | 27 | 1.04 |
| (2 – 2)R(9) | 1219.10 | 14.35 | 0.0318 | 40 | 1.56 |
| (2 – 2)P(8) | 1219.16 | 14.13 | 0.0214 | 8 | 1.46 |
| (0 – 2)P(1) | 1219.37 | 14.91 | 0.0149 | 50 | 1.02 |
| (2 – 0)P(17) | 1219.48 | 15.60 | 0.0040 | 54 | 1.85 |
| (3 – 2)R(11) | 1220.11 | 16.34 | 0.0213 | 92 | 1.80 |
This multi-component fitting method was mostly insensitive to the exact initial conditions, except for the (0 – 2)R(2) and (2 – 2)R(9) levels, whose wavelengths differ by only 0.01 Å ( = 1219.09 and 1219.10 Å, respectively). The total column density at this wavelength was robust, however the relative columns in the two lines was not. We weighted the individual columns by the product of the oscillator strength and the relative populations of the two levels at a fiducial hot H2 temperature ((H2) = 2500 K). The oscillator strengths and populations of the two lines are [ = 25.5 10-3, = 5.76 10-4] and [ = 31.8 10-3, = 6.24 10-4], respectively. (2,2) contributes 0.425 and (2,9) contributes 0.575 to the total 1219.10 Å column. The (2 – 0)P(17) line is located at the inflection point between the Ly line and the far-UV continuum, complicating its line-shape. This line was fit manually ((0,17) = 4 1015 cm-2) and this value was fixed during the fitting procedure to reduce run time. The best-fit H2 column densities are presented in Table 1.
The error bars presented in Table 1 were determined from the minimum and maximum deviations from the mean column densities of the best-fit distribution. In cases where the fitting uncertainty errors were less than the 1- error bars on the data (shown in Figure 2b), we took the errors to be the range of column densities that could be accommodated within the uncertainty on the data. This approach gives a conservative estimate of the uncertainties on the measured column density. Significantly larger -values would imply turbulent velocities greater than the isothermal sound speed for 4000 K, however, in order to fully understand the parameter space, we also determined the best-fit parameters assuming = 10 km s-1. As expected, increasing reduces the best-fit column densities. We found that the column densities were typically 0.1 – 0.3 dex smaller at high . Two exceptions to this trend were the columns of the (2 – 2)P(8) (which increased by 0.6 dex) and (3 – 2)R(11) lines (which decreased by 1.3 dex). The equivalent widths were calculated from the best-fit column densities, assuming that the observed H2 lines are located on the “flat part” of the curve-of-growth, and are displayed in Table 1.
3.2.3 Thermal H2 Population
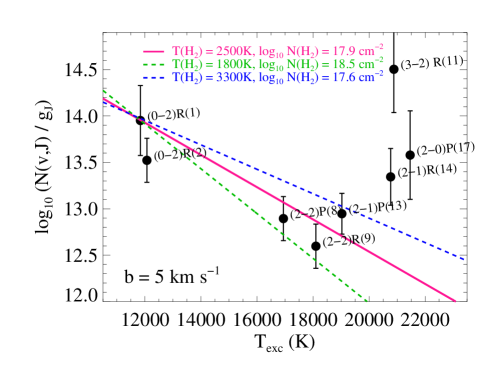
The measured column densities, normalized by the degeneracy of the state (), are plotted as a function of excitation temperature ( = /, where is the Boltzmann constant) in Figure 3. We label the absorbing levels in the ground electronic state as [,] and the rovibrational levels of the electronic state as [,]333The rovibrational levels of the ground electronic state following fluorescence would then be [,].. The energy levels for the individual rovibrational levels were taken from Dabrowski (1984). Gas in thermal equilibrium is well-described by a single Boltzmann distribution, which would appear as a straight line in Figure 3, while deviations from this thermal distribution indicate that non-thermal processes are partially responsible for the level populations in the H2 gas. Non-equilibrium photo-excitation and excess energy associated with H2 formation on grain surfaces are generally assumed to be the dominant non-thermal H2 excitation processes in interstellar clouds (Spitzer & Cochran, 1973) and protoplanetary disks (Nomura & Millar, 2005), and it seems plausible that both are at work in the molecular disk of AA Tau (see §4.1).
The H2 population is roughly consistent with a thermal distribution for 2 104 K. Assuming that the lowest energy states observed in absorption represent a thermal H2 population, these lines are used to determine the total column density of this gas. Figure 3 shows three thermal distribution curves that correspond to the best-fit, upper and lower limits to the thermal H2 (the solid pink, dashed blue, and dashed green lines), normalized to the measured column in the [,] = [2,1] state. It may be that the [2,1] state itself is not thermally populated, but in the absence of lower-excitation constraints (most of the lines that would constrain the 5000 K portion of the excitation diagram are located at wavelengths shorter than the COS G130M band), we choose the lowest observed energy level for the normalization. With this caveat about the normalization in mind, we find that the thermal population can be characterized by (H2) = 2500 K. These values are consistent with the thermal origin of the Ly-pumped H2 emission proposed by Herczeg et al. (2004). The total column density of the thermal H2 is thus log10((H2)) = 17.86 cm-2. We will present a discussion of the possible evidence for non-thermal H2 level populations in §4.1.
3.3. CO Absorption
While H2 absorptions from the ground vibrational state ( – 0) are located at 1110 Å, the – absorption system of CO spans the COS far-UV bandpass, extending blueward from the (0 – 0) band at 1544 Å. We identify nine CO bands from = 0 – 8 in the COS spectra of AA Tau (see Figure 1). Spectral blending with photo-excited H2 as well as emission from Si IV 1394 and C IV 1548 limit the number of bands that can be used for spectral fitting444France et al. (2011a) suggested that C IV may be a photo-excitation source for CO in these systems, and that possibility will be explored in a future work., and the low flux levels ( 1 10-15 erg cm-2 s-1 Å-1) also make detailed modeling challenging. Broad CO – absorption lines were first identified in the UV spectrum of HN Tau (France et al., 2011a), and we employ a similar technique for fitting the CO absorption spectrum of AA Tau. To date, all CTTS systems that show – absorption have very broad CO profiles due to blending of closely-spaced rotational lines (suggesting CO temperatures of several hundred K) and relatively high disk inclinations, arguing that the molecules are located in a warm inner disk.
Each CO band was extracted from the spectrum and a low-order polynomial was fit to the most uncontaminated nearby portions of the spectrum for continuum normalization. Individual band velocities relative to rest were determined to correct for any relative offsets introduced by wavelength calibration errors or in the co-addition process. Profile fitting was used to determine the relevant parameters: N(12CO), N(13CO), Trot, and Doppler -value. Because the thermal width of CO is 4 times smaller than that of H2, we restricted our fitting to 2 km s-1.
CO absorption band profiles were modeled using ro-vibrational line wavelengths and oscillator strengths from Eidelsberg (private communication) for 12CO. For 13CO, wavelengths were determined from the ground state energies calculated from the mass-independent Dunham coefficients of George et al. (1994) and the A energy levels of Haridass & Huber (1994), while the oscillator strengths used were from Eidelsberg et al. (1999). The wavelengths and oscillator strengths for the perturbations, which show up more prominently at higher column densities, were taken from Eidelsberg & Rostas (2003). In the fitting process, we assumed the ground states for both 12CO and 13CO were populated following a single rotational temperature, Trot(CO).
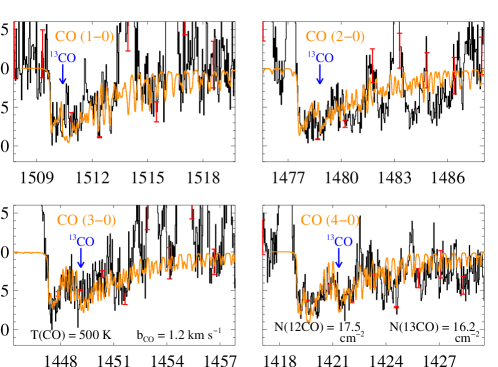
Of all the bands, the (1-0), (2-0), (3-0), (4-0), (7-0) and (8-0) were the least contaminated by other spectral features so we compared these bands simultaneously with a grid of absorption line models. Best-fit parameters were determined using a chi-squared metric, limiting the fitting to normalized flux values below 1.1; this minimized the diluting effect the strong emission features would have on the chi-squared value. Our analysis finds that the CO absorption is characterized by log10((12CO)) = 17.5 0.5 cm-2, log10((13CO)) = 16.2 1.0 cm-2, = 1.2 0.4 km s-1, and (CO) = 500 K. The best-fit CO model for several bands is shown overplotted in orange on the COS spectrum in Figure 4.
The large errors in our best-fit parameters are indicative of the difficulties inherent in fitting the CO absorption in data such as these. Several systematic effects contribute to the error. Due to the large number of emission features, finding suitable uncontaminated spectral regions for continuum normalization was difficult. The (2 – 0) band shown in Figure 4 ( ) provides an example of the challenges associated with continuum placement in CTTSs. These emission features, coupled with the low signal-to-noise, also enhance the error in our temperature fit; as rotational excitation temperature increases, the profile near the low-lying J levels, where the lines may be experiencing more saturation effects, changes less than at higher-lying J levels, which lie at longer wavelengths. The result is a larger error bar to higher temperatures. At the lower ( – 0) bands, the 13CO tends to overlap with the 12CO and as such tends to complicate the fit; however, for the (7-0) and (8-0) bands, the 13CO is cleanly separated and detected.
3.3.1 Isotopic Fractionation
That 13CO absorption is required to fit the observed absorption profiles is not unexpected considering the high 12CO column densities observed in AA Tau (Sonnentrucker et al., 2007). The best-fit log10((13CO)) = 16.2 1.0 cm-2, implies a 12CO/13CO ratio of 20, though we caution that the uncertainties on both quantities are large (12CO/13CO 20) . This ratio is smaller than the local interstellar 12CO/13CO of 70 (Sheffer et al. 2007; see also the review by Wilson & Rood 1994) and the isotopic ratios derived from IR observations of young stellar objects (12CO/13CO 100; Smith et al. 2009), although the discrepancies are not statistically significant. We briefly consider the primary processes that are expected to influence the isotopic fraction in molecular environments.
Isotopic charge exchange enhances the population of 13CO (van Dishoeck & Black, 1988), becoming efficient at kinetic temperatures 35 K. While the CO band widths strongly rule out (CO) 100 K, turbulent mixing in the disk (e.g., Ilger et al. 2004) could bring 13CO formed closer to the midplane to the upper disk where we observe the absorbing gas. 13CO is also selectively photodissociated by UV photons at the surface of molecular clouds (Bally & Langer, 1982) due to the faster onset of 12CO self-shielding, and this process enhances the relative population of 12CO in these environments. While the far-UV radiation field at the surface of a CTTS disk is intense (Fogel et al., 2011; France et al., 2011b), the absorption bands with the largest 13CO dissociation probabilities are located at 1060 Å (van Dishoeck & Black, 1988), where the continuum is weak.
A 12CO/13CO ratio of 20 is marginally consistent with lowest inner disk carbon fractions computed by Woods & Willacy (2009). Their models suggest that our observed 12CO/13CO ratios would be expected closer to the disk midplane (for the reasons noted above). Therefore, if low fractional ratios are found in the warmer upper disk, then this material was likely formed in cooler, shielded regions and has subsequently been vertically transported through the disk. It is also intriguing to note that the models presented by Visser et al. (2009) predict isotopic fractions 30 for (H2) 1021 cm-2. Assuming a typical interstellar CO/H2 ratio (10-4), (H2) 1021 cm-2 is approximately the expected H2 column associated with our measured value of (CO) = 1017.5 cm-2 (see §4.3).
4. Discussion
4.1. Non-Thermal H2 Population
These data most likely probe a sightline through the upper atmosphere of the AA Tauri disk, a region where non-equilibrium processes are expected to be important. France et al. (2011a) suggested that non-thermal populations could be relevant for both the CO and H2 populations in inner CTTS disks (see also the protoplanetary disk H2 models of Nomura & Millar 2005). Their work was based primarily on model-dependent emission line analyses and analogy to the better-studied case of molecular excitation in photodissociation regions. Ardila et al. (2002), using fluorescently excited H2 emission lines to reconstruct the ground state level populations in a sample of five CTTSs, found that the H2 was considerably out of thermal equilibrium. However, more recent analyses based on -STIS observations of CTTSs suggest that these levels are consistent with a thermal population (Herczeg et al., 2004, 2006). It should be emphasized that all of the studies cited above deal with molecular lines, and it is not yet clear whether the CO and H2 emission are tracing the same parcels of gas as the CO and H2 absorption.
Using a direct measurement of H2 and CO absorption lines along the same line-of-sight and in the same observation, we have a much more straightforward observational basis for understanding the molecular processes operating in protoplanetary disk atmospheres. The deviations from the thermal distributions in Figure 3 could be direct evidence for non-thermal excitation in the molecular disk atmosphere. It is premature to draw broad conclusions until this behavior is observed in similar systems because we only detect three states with strongly non-thermal behavior, and two of these (2 – 0)P(17) and (3 – 2)R(11) are measured in regions of low S/N. However, the excitation diagram presented in Figure 3 is intriguing, and we briefly describe possible mechanisms for this excitation in the following paragraphs. It is also interesting to note that we only measure significant deviations from a thermal population at excitation temperatures 2 104 K, approximately the same energy cut-off where Ardila et al. (2002) saw the largest non-thermal excursions.
There are two main mechanisms that can drive the H2 level populations out of thermal equilibrium555A third, possibly speculative mechanism for producing highly non-thermal H2 populations is excess energy associated with the dissociation of more complex molecules. Rovibrationally excited H2 and CO have recently been observed in the spectra of comets, consistent with these molecules being the photodissociation products of formaldehyde (H2CO; Feldman et al. 2009).: excess energy associated with H2 formation on dust grains (“formation pumping”) and excitation by UV photons at a rate faster than the molecules can decay via rovibrational emission lines or collisions (“multiple pumping”). Initial evidence for a non-thermal component to the CTTS H2 population was observed by Herczeg et al. (2002), who found H2 emission lines pumped out of states near the collisional dissociation threshold of H2 in STIS spectra of TW Hya. These states cannot be thermally populated, and a local source of highly excited H2 ([,] = [5,18]) is required if these levels persist. Dust grains are widely believed to be the primary site of H2 formation in the present-day Universe (Hollenbach & Salpeter, 1970; Cazaux & Tielens, 2004) and are abundant in protoplanetary disks (see reviews by Natta et al. 2007 and Dullemond & Monnier 2010). Numerous authors have presented H2 formation rates in molecular clouds (e.g., Jura 1975; Black & van Dishoeck 1987; Draine & Bertoldi 1996). Protoplanetary disk models that include molecular formation (e.g., Nomura et al. 2007) have considered the effects of grain growth, which can create significant deviation from the properties of typical interstellar dust grains (Vasyunin et al., 2011). However, these authors do not explicitly describe the distribution of newly formed molecules in the inner disk. Draine & Bertoldi (1996) find typical formation states at high rovibrational levels [,] [5,9], with 2.9 eV. This may suggest that the high energy excursions from a thermal distribution we observe in Figure 3 are the beginning of a higher energy population of H2 recently formed in the disk itself. Additional calculations of the spatial distributions of newly formed H2 in CTTS disks would be useful.
A calculation of H2 photo-excitation in the AA Tau disk is more straightforward, and here we provide a simple example of the importance of this process. The relative importance of UV line and continuum emission to the photoexcitation of trace molecules (CN, HCN, H2O) has been examined in some detail (e.g., Bergin et al. 2003). We argue that UV photo-excitation of H2 can be important even in the absence of a strong Ly radiation field or a population of (H2) 2000 K molecular gas. The far-UV continuum produced in the accretion flow and magnetically active stellar atmosphere provides sufficient pumping flux to photo-excite even a cold molecular gas. Far-UV continuum spectra can now be routinely measured in CTTS systems with COS, and following the analyses of France et al. (2011b, a), we can fit the 912 – 2000 Å continuum spectrum from AA Tau. We find that the integrated far-UV continuum radiation field is = 106.3 , where is the local UV interstellar radiation field ( = 1.6 10-3 erg cm-2 s-1; Habing 1968). This corresponds to a far-UV continuum luminosity of 9 1030 erg s-1.
Consider an individual H2 absorption line that will have a large population fraction even at low-temperatures ((H2) 500 K), the Lyman band (4 – 0)R(1) absorption line at 1049.96 Å. The UV photon absorption rate, (in units of photons s-1), can be calculated by
| (1) |
where is the incident continuum photon flux ( 2 1010 photons cm-2 s-1 Å-1 at 1 AU for AA Tau), is the equivalent width of the (4 – 0)R(1) line, and is the line-center absorption cross-section of an individual molecule, given by
| (2) |
(McCandliss, 2003; Cartwright & Drapatz, 1970) where = 1049.96 Å and is the oscillator strength ( 0.0155). of the (4 – 0)R(1) transition is 1.2 10-14 cm-2, which is typical of strong H2 absorption lines at 1100 Å for = 2 km s-1. 0.1 Å for all temperatures when (H2) 1018 cm-2.
We can incorporate these values to further simplify Eqn 1 for the case of AA Tau:
| (3) |
where is the radial distance (in AU) of the H2 from the star. To first order, when is larger than the transition probabilities () of the rovibrational H2 emission lines, one expects multiple UV photo-excitations before the gas can relax via line emission. The average transition probability for the quadrupolar H2 emission lines in the 1 – 4 m bandpass 5 10-7 s-1. The pure rotational mid-IR emission lines are another 1 – 3 orders of magnitude slower. Therefore, we see that 40 far-UV continuum photons are absorbed for every one IR emission, in the absence of collisional de-excitation.
While it is clear that UV photons are important in the level populations of disk H2, it is not clear that they are the dominant factor in this balance. The critical density is the ratio of the radiative lifetime of a given state (the Einstein value, with units of s-1) and the collision rate for de-excitation out of that state, (in units of cm3 s-1). The critical densities for most rovibrational states of H2 are 104 cm-3 at 2000 K (Mandy & Martin, 1993). H2 + H collision rates () for gas in LTE in the range 2000 – 4500 K are on the order of 10-12 – 10-11 cm3 s-1 for the (1 – 0)S() near-IR rovibrational transitions that can be observed from the ground (Mandy & Martin, 1993). Therefore at an average density of 105 cm-3 (§4.2), the collisional de-excitation transition rate is 10-7 – 10-6 s-1 for this gas, somewhat less than our estimates of the photoexcitation rate by continuum photons at 1 AU. In a high-density region such as the inner disk atmosphere of a CTTS, strong UV pumping will compete with collisional excitation and de-excitation to produce level populations that appear neither exactly thermal nor purely fluorescent (Draine & Bertoldi, 1996).
The observations we present in Figure 3 agree with the qualitative predictions of the irradiated disk models of Nomura & Millar (2005) and Nomura et al. (2007). In these models, the UV radiation field thermalizes the level populations up to a certain through strong photo-electric heating. Beyond this thermalization energy, the level populations are determined by the UV pumping rates for the relevant transitions. In our COS observations of AA Tau, we observe a higher thermalization threshold ( 2 104 K vs. 1 104 K) than predicted by Nomura et al. (2007; Figs. 12 and 13); however, this can most likely be attributed to the radial distances where these distributions are evaluated. The model calculations are evaluated at 30 – 50 AU, while the H2 absorption we observe in AA Tau may be occurring in the inner disk (§4.2). At smaller radial distances, the more intense UV radiation field will enhance the photo-electric heating rate, thermalizing the H2 population to higher .
4.2. The Spatial Distribution of the Absorbing Gas
We have measured the radial velocities of the absorption and emission components of both molecules. We find that the H2 absorption lines are shifted by a uniform +29 8 km s-1, slightly higher than the photospheric radial velocity measurement of Bouvier et al. (2007) (+17 km s-1) and consistent with the atmospheric Balmer-series absorption velocity of +34 km s-1 from Joy (1949). A sample of 10 H2 emission lines located both shortward and longward of the Ly emission line show an H2 emission radial velocity of +18 8 km s-1, consistent with both the narrow optical line velocity (+4 – 12 km s-1) of Bouvier et al. (2007) and the H emission velocity (+13 km s-1) from Joy (1949). Due to the spectral overlap of the CO lines, the radial velocities of this species are not as well constrained. Furthermore, emission lines coincident with the CO absorption bandheads complicate this sharp edge in the data. The average CO absorption radial velocity of the = 1, 2, 3, 4, and 7 bands is +20 13 km s-1. The CO emission radial velocity, determined from the bandhead of the – (14 – 4) complex is +22 19 km s-1. Therefore, we conclude that there is no evidence for high-velocity infall or outflow in the molecular material we observe towards AA Tau.
The thermalized H2 and CO populations have significantly different excitation temperatures; however, if these absorption lines are both formed in the disk, then they are most likely in close spatial proximity, if not actually co-spatial. We can put a rough limit on the inner radius of the absorbing gas using the line-widths of the fluorescent H2 emission. We fit the 12 strongest H2 emission lines in the 1260 – 1300 Å bandpass, finding FWHM = 53 12 km s-1, which corresponds to 0.16 AU (assuming Keplerian rotation and ignoring thermal and turbulent contributions to the line-width) for a 0.53 M⊙ central star (Gullbring et al., 1998) and a disk inclination of 75° (Andrews & Williams, 2007). Taking the half-width at zero intensity (HWZI) of the line moves to 0.11 AU. An approximate outer radius of the absorbing material could be where the lower bound on the CO temperature (300 K) is in equilibrium with the radiation field, 0.79 AU, assuming = 4000 K and = 1.9 R⊙ (from the AA Tau SED fitting of O’Sullivan et al. 2005). While these inner and outer radii probably do not exactly represent the regions subtended by the absorbing molecules, they provide an order-of-magnitude estimate of the molecular region.
The average values of the CO/H2 ratio and H2 density in the region probed by our absorption line spectroscopy are then: CO/H2 (CO)/(H2) 0.4 [] and (H2)/( - ) 8.4 104 cm-3. Assuming an H2 ortho-para ratio of 3, the total ortho- + para-H2 collision rate, summed over all possible lower levels, is = 2.85 10-10 cm3 s-1 for = 9 (Yang et al., 2010). The CO critical density for 9 at 300 K is 1.8 105 cm-3. Therefore, it is possible that the high- CO populations that drive the determination of (CO) are significantly sub-thermal. While the high-J levels are populated by collisions, these levels can radiatively depopulate fast enough that the populations are not representative of the local kinetic temperature. To explore this possibility, we computed RADEX models (van der Tak et al., 2007) using the on-line interface666 http://www.sron.rug.nl/vdtak/radex/radex.php . For the values of (H2), (CO), , and found above, we find that CO levels 9 are characterized by temperatures less than the 2500 K kinetic temperature. For 9 38, the CO excitation temperature is 483 129 K, in agreement with the (CO) 500 K derived in §3.3. Therefore, the CO and H2 we observe in absorption are consistent with an origin in the same 2500 K gas.
The average H2 number density derived above assumes crude limits to the spatial distribution of the absorbing H2 and CO, it is instructive to also consider the limiting cases. At the high-density limit, one might imagine that the entire column of absorbing H2 is in the form of a proto gas-giant planet. Taking ( - ) = 1 , we see that 3 106 cm-3. At the low-density limit, we might imagine that the H2 uniformly spans the entire planet-forming region of the AA Tau disk, or ( - ) = 10 AU. In this limit, we find 5 103 cm-3 and estimate a total H2 mass777 Assuming = 0.1 , the volume of this disk is then [(4/30) ( - )]. of 2.4 1022 g, which is roughly 4 10-6 . This calculation confirms our earlier speculation that these line-of-sight measurements do not probe the bulk of the molecular distribution available for planet formation, and are only sampling the tenuous upper regions of the protoplanetary disk.
4.2.1 Relation to CO Fundamental Emission
As noted in §2.1, CO emission from AA Tau has been detected in fundamental band emission near 5 m (Carr & Najita 2008; Najita et al. 2009; and see also Salyk et al. 2011). Our UV absorption-derived CO column densities and temperatures are roughly consistent with those derived from the mid-IR emission lines log10((CO)) = 17.7 and (CO) = 900 100 K (Carr & Najita, 2008). This suggests that both observations may be tracing a similar molecular population. Najita et al. (2009) find CO line widths of FWHM = 145 km s-1, suggesting that the emission arises from gas in Keplerian rotation within 0.5 AU of the central star (and likely with a significant contribution from gas within 0.1 AU). Due to the pencil-beam nature of our absorption line measurements, we do not have information regarding the velocity broadening of the CO. The CO emission line widths are 3 times those found for the UV emission lines of H2 described in the previous subsection, meaning that the CO emission is likely originating interior to the H2 in AA Tau. (CO) in the range 1017-18 cm-2 should be associated with H2 column densities (H2) 1021 cm-2, several orders of magnitude larger than we observe. This discrepancy raises questions about both the physical origin of the molecular gas and its composition, and these points are addressed in the following subsection.
4.3. CO/H2 in the AA Tau Circumstellar Disk
We find that the average observed CO/H2 ratio in the AA Tau inner disk is 0.4. We imagine two scenarios that could account for this result. In the first, the absorbing CO resides in a relatively low-density medium ( 2 105 cm-3), where the higher rotational states that drive the CO temperature fits are sub-thermal. In this case, the kinetic temperature of the gas is 2500 K, the CO and H2 are cospatial, and CO/H2 0.4. A CO/H2 ratio in the range 0.1 – 1 is significantly larger than the typical interstellar dense cloud value ( 10-4; Lacy et al. 1994 and see Liszt et al. 2010 for a review of CO/H2 in various phases of the molecular ISM). The collapse of a dense cloud precedes the formation of the disk and protostar, thus finding CO/H2 three orders of magnitude above this value suggests significant chemical evolution has taken place in the AA Tau disk. CO/H2 values of unity were recently suggested by France et al. (2011a) in CTTS inner disk atmospheres, using an orthogonal analysis comparing CO emission to typical (H2) values from the literature.
In the second scenario, the H2 and CO abundance ratios are interstellar, but the absorbing H2 is spatially separate from the absorbing CO. Any CO in the “hot H2 region” falls below our detection limit and any H2 in the “warm CO region” is too cool to create measurable opacity at Ly. An implication of this reasoning is that there is a reservoir of warm H2 associated with the CO absorption, with typical dense cloud abundances. Taking the best-fit CO column density (log10((CO)) = 17.5 cm-2), and assuming a molecular fraction () of 0.67 and CO/H2 = 10-4, we expect a neutral hydrogen column density of log10((H)) = 21.5 cm-2 co-spatial with the absorbing CO gas. The neutral hydrogen opacity associated with 1021.5 cm-2 would completely extinguish the flux from the star to 5 Å from the Ly line center, which is inconsistent with the Ly profile presented in Figure 2a. While = 0.67 is ruled out, this scenario is tenable for 0.9. It seems plausible that the molecular fraction is high in a warm ( 500K) medium with (H2) 1021 cm-2. Burgh et al. (2010) present a direct comparison between the CO/H2 ratio and across a range of diffuse and translucent interstellar sightlines. Extrapolating their Figure 2, one sees that the CO/H2 10-4 is reached at 0.9. While it would be speculative to draw larger conclusions based on analogy to cold interstellar clouds, it seems that a spatially stratified medium is consistent with our observations.
Is this vast reservoir of warm H2 observable? At (H2) 500 K, the upper rovibrational states of the molecule are not appreciably populated. There is not enough opacity in the traditional far-UV bandpass ( 1150 Å) to create a detectable signal. At 1120 Å the H2 opacity should rise rapidly due to large populations in the low-lying rovibrational levels of the ground electronic state, producing an observable absorption signature that could directly distinguish between the two scenarios laid out above. Additionally, at 1120 Å far fewer H2 emission lines pumped by Ly are present (Wood & Karovska, 2004), and only one H2 line pumped by O VI contributes significantly888The – (1 – 3) (3) 1119.08 line may be strong, however the branching ratio of the – (1 – 2) (3) 1075.03 line is small ( 0.004). The decrease in spectral confusion may offset the decrease in source signal and instrumental effective area across this bandpass. With the installation of COS, can now observe at wavelengths as short as the Lyman limit (McCandliss et al., 2010), and new medium resolution modes (such as the G130M 1222) are in development (Osterman et al., 2010). Heavily damped line profiles require neither high S/N nor high resolution for a robust column density determination, and we suggest that S/N as low as 2 per pixel may be sufficient when the data is rebinned to one spectral resolution element. Therefore, we predict that it may be possible to directly search for warm H2 in the AA Tau disk with future far-UV observations.
5. Summary
We have presented new spectroscopic observations of the AA Tau protoplanetary disk system. We directly observe both H2 and CO absorption lines along the line-of-sight through a CTTS disk for the first time. These Hubble Space Telescope observations allow us to constrain the molecular column densities, relative abundances, and temperatures of the two main molecular constituents of the disk. We find that the H2 absorption seen imposed upon the stellar Ly profile has both thermal and non-thermal components, with the thermal material characterized by log10((H2)) 17.9 cm-2 and a temperature of (H2) 2500 K. The CO absorption implies log10((CO)) 17.5 cm-2 and (CO) 500 K. Taken together, the observed CO/H2 ratio of 0.4 may either be a direct measure of local abundances or indicate spatially stratified hot and warm molecular layers. Additional modeling of UV photo-excitation and in situ molecular formation will be very useful for understanding the physical state of the low-density molecular gas in these systems.
Appendix A Absorption Model and Non-detection of H2 Against the Far-UV Continuum of AA Tau
In this Appendix, we describe the creation of an H2 model and use it to place limits on absorption against the far-UV continuum of AA Tau. The physical characteristics of the H2 population in the disk can be constrained by comparing model H2 absorption spectra with the data. Assuming that the H2 level populations are controlled by collisional processes (Herczeg et al., 2004), synthetic absorption line spectra are constructed given values of the total H2 column density ((H2)), the rovibrational excitation temperature ((H2)), and Doppler broadening parameter (). While in principle H2 absorption lines can be searched for from the short-wavelength cut-off of our observations ( 1133 Å) to the end of the significant rovibrational population ( 1400 Å for (H2) 3000 K), practical considerations make the 1225 – 1300 Å band preferred for constraining H2 absorption against the continuum of an accreting pre-main sequence star. At 1200 Å, circumstellar and interstellar reddening are the most severe, the continuum used as a background source is declining (France et al., 2011b), and the reflectivity of the Optical Telescope Assembly (OTA) is falling precipitously. All of these factors conspire to create low S/N at these wavelengths. At 1300 Å, the rovibrational levels [,] are not significantly populated, thus only weak absorptions are predicted.
The 1225 – 1300 Å band is at the peak of the COS effective area and therefore provides the best combination of sensitivity and rovibrational population in which to search for an H2 absorption signal. The primary limiting factors for this work are the S/N of the continuum and spectral overlap with the numerous emission features from hot gas lines (e.g., N V 1239, 1243) and H2 photo-excited by Ly and O VI (Wilkinson et al., 2002; Herczeg et al., 2006; France et al., 2011b). We created absorption spectra in the 900 – 1400 Å wavelength range using the H2ools optical depth templates (McCandliss, 2003) for the identification and analysis of H2 lines in the COS bandpass.
H2 absorption is not detected against the far-UV continuum of AA Tau. In order to constrain the column density of the H2, we define an upper limit as the column density which produces absorption line depths greater than the 1 error bars on the continuum. In the 1225 – 1300 Å wavelength range, (H2) 1 1019 cm-2 for (H2) 2000 K. At (H2) 2000 K, we do not expect a significant number of detectable absorbers redward of Ly, therefore this analysis is not sensitive to a high-column, low-temperature H2 component in the outer disk (see §4.3). At (H2) 2000 K, additional absorbers are predicted that are not observed, and the increased population in the high [,] states lowers the upper limit on (H2). The 2000 K limit also implies 4 km s-1 because this is the thermal width in the absence of turbulent velocity broadening. In fact, if turbulence is significant, then the column density limits become smaller because increasing increases the absorption depth at line-center for a given (H2). This result is due to the fact that while these lines do not appear to reach zero (“become black”) at their line centers when convolved with the COS LSF, the strongest lines are indeed saturated. As increases, the equivalent width of the saturated line increases, producing less line-center transmission for a given column density. We see then that our limit log10((H2)) 19.0 cm-2 is rather conservative because higher temperatures and turbulent velocities only act to reduce this value.
References
- REV (????) ????
- 08 (1) 08. 1
- Andrews & Williams (2007) Andrews, S. M. & Williams, J. P. 2007, ApJ, 659, 705
- Ardila et al. (2002) Ardila, D. R., Basri, G., Walter, F. M., Valenti, J. A., & Johns-Krull, C. M. 2002, ApJ, 566, 1100
- Bally & Langer (1982) Bally, J. & Langer, W. D. 1982, ApJ, 255, 143
- Bergin et al. (2003) Bergin, E., Calvet, N., D’Alessio, P., & Herczeg, G. J. 2003, ApJ, 591, L159
- Bergin et al. (2004) Bergin, E., Calvet, N., Sitko, M. L., Abgrall, H., D’Alessio, P., Herczeg, G. J., Roueff, E., Qi, C., Lynch, D. K., Russell, R. W., Brafford, S. M., & Perry, R. B. 2004, ApJ, 614, L133
- Bethell & Bergin (2009) Bethell, T. & Bergin, E. 2009, Science, 326, 1675
- Black & van Dishoeck (1987) Black, J. H. & van Dishoeck, E. F. 1987, ApJ, 322, 412
- Bohlin et al. (1978) Bohlin, R. C., Savage, B. D., & Drake, J. F. 1978, ApJ, 224, 132
- Bouvier et al. (2007) Bouvier, J., Alencar, S. H. P., Harries, T. J., Johns-Krull, C. M., & Romanova, M. M. 2007, Protostars and Planets V, 479
- Bouvier et al. (1999) Bouvier, J., Chelli, A., Allain, S., Carrasco, L., Costero, R., Cruz-Gonzalez, I., Dougados, C., Fernández, M., Martín, E. L., Ménard, F., Mennessier, C., Mujica, R., Recillas, E., Salas, L., Schmidt, G., & Wichmann, R. 1999, A&A, 349, 619
- Brown et al. (1981) Brown, A., Jordan, C., Millar, T. J., Gondhalekar, P., & Wilson, R. 1981, Nature, 290, 34
- Burgh et al. (2010) Burgh, E. B., France, K., & Jenkins, E. B. 2010, ApJ, 708, 334
- Burgh et al. (2007) Burgh, E. B., France, K., & McCandliss, S. R. 2007, ApJ, 658, 446
- Carr & Najita (2008) Carr, J. S. & Najita, J. R. 2008, Science, 319, 1504
- Cartwright & Drapatz (1970) Cartwright, D. C. & Drapatz, S. 1970, A&A, 4, 443
- Cazaux & Tielens (2004) Cazaux, S. & Tielens, A. G. G. M. 2004, ApJ, 604, 222
- Dabrowski (1984) Dabrowski, I. 1984, Canadian Journal of Physics, 62, 1639
- Danforth et al. (2010) Danforth, C. W., Keeney, B. A., Stocke, J. T., Shull, J. M., & Yao, Y. 2010, ApJ, 720, 976
- Donati et al. (2010) Donati, J.-F., Skelly, M. B., Bouvier, J., Gregory, S. G., Grankin, K. N., Jardine, M. M., Hussain, G. A. J., Ménard, F., Dougados, C., Unruh, Y., Mohanty, S., Aurière, M., Morin, J., & Farès, R. 2010, MNRAS, 409, 1347
- Draine & Bertoldi (1996) Draine, B. T. & Bertoldi, F. 1996, ApJ, 468, 269
- Dullemond & Monnier (2010) Dullemond, C. P. & Monnier, J. D. 2010, ARA&A, 48, 205
- Eidelsberg et al. (1999) Eidelsberg, M., Jolly, A., Lemaire, J. L., Tchang-Brillet, W.-Ü., Breton, J., & Rostas, F. 1999, A&A, 346, 705
- Eidelsberg & Rostas (2003) Eidelsberg, M. & Rostas, F. 2003, ApJS, 145, 89
- Feldman et al. (2009) Feldman, P. D., Lupu, R. E., McCandliss, S. R., & Weaver, H. A. 2009, ApJ, 699, 1104
- Fogel et al. (2011) Fogel, J. K. J., Bethell, T. J., Bergin, E. A., Calvet, N., & Semenov, D. 2011, ApJ, 726, 29
- France et al. (2007) France, K., Roberge, A., Lupu, R. E., Redfield, S., & Feldman, P. D. 2007, ApJ, 668, 1174
- France et al. (2011a) France, K., Schindhelm, E., Burgh, E. B., Herczeg, G. J., Harper, G. M., Brown, A., Green, J. C., Linsky, J. L., Yang, H., Abgrall, H., Ardila, D. R., Bergin, E., Bethell, T., Brown, J. M., Calvet, N., Espaillat, C., Gregory, S. G., Hillenbrand, L. A., Hussain, G., Ingleby, L., Johns-Krull, C. M., Roueff, E., Valenti, J. A., & Walter, F. M. 2011a, ApJ, 734, 31
- France et al. (2011b) France, K., Yang, H., & Linsky, J. L. 2011b, ApJ, 729, 7
- George et al. (1994) George, T., Urban, W., & Lefloch, A. 1994, Journal of Molecular Spectroscopy, 165, 500
- Gullbring et al. (1998) Gullbring, E., Hartmann, L., Briceno, C., & Calvet, N. 1998, ApJ, 492, 323
- Habing (1968) Habing, H. J. 1968, Bull. Astron. Inst. Netherlands, 19, 421
- Haridass & Huber (1994) Haridass, C. & Huber, K. P. 1994, ApJ, 420, 433
- Herczeg et al. (2002) Herczeg, G. J., Linsky, J. L., Valenti, J. A., Johns-Krull, C. M., & Wood, B. E. 2002, ApJ, 572, 310
- Herczeg et al. (2006) Herczeg, G. J., Linsky, J. L., Walter, F. M., Gahm, G. F., & Johns-Krull, C. M. 2006, ApJS, 165, 256
- Herczeg et al. (2005) Herczeg, G. J., Walter, F. M., Linsky, J. L., Gahm, G. F., Ardila, D. R., Brown, A., Johns-Krull, C. M., Simon, M., & Valenti, J. A. 2005, AJ, 129, 2777
- Herczeg et al. (2004) Herczeg, G. J., Wood, B. E., Linsky, J. L., Valenti, J. A., & Johns-Krull, C. M. 2004, ApJ, 607, 369
- Hollenbach & Salpeter (1970) Hollenbach, D. & Salpeter, E. E. 1970, J. Chem. Phys., 53, 79
- Ilgner et al. (2004) Ilgner, M., Henning, T., Markwick, A. J., & Millar, T. J. 2004, A&A, 415, 643
- Ingleby et al. (2009) Ingleby, L., Calvet, N., Bergin, E., Yerasi, A., Espaillat, C., Herczeg, G., Roueff, E., Abgrall, H., Hernández, J., Briceño, C., Pascucci, I., Miller, J., Fogel, J., Hartmann, L., Meyer, M., Carpenter, J., Crockett, N., & McClure, M. 2009, ApJ, 703, L137
- Ingleby et al. (2011) Ingleby, L., et-al, A., et-al, A., & et-al, A. 2011, ApJ, 000, L1
- Johns-Krull et al. (2000) Johns-Krull, C. M., Valenti, J. A., & Linsky, J. L. 2000, ApJ, 539, 815
- Joy (1949) Joy, A. H. 1949, ApJ, 110, 424
- Jura (1975) Jura, M. 1975, ApJ, 197, 575
- Kraus & Hillenbrand (2009) Kraus, A. L. & Hillenbrand, L. A. 2009, ApJ, 704, 531
- Kriss (2011) Kriss, G. A. 2011, Improved Medium Resolution Line Spread Functions for COS FUV Spectra, Tech. rep.
- Lacy et al. (1994) Lacy, J. H., Knacke, R., Geballe, T. R., & Tokunaga, A. T. 1994, ApJ, 428, L69
- Liszt et al. (2010) Liszt, H. S., Pety, J., & Lucas, R. 2010, A&A, 518, A45+
- Mandy & Martin (1993) Mandy, M. E. & Martin, P. G. 1993, ApJS, 86, 199
- Martin-Zaïdi et al. (2008) Martin-Zaïdi, C., Deleuil, M., Le Bourlot, J., Bouret, J.-C., Roberge, A., Dullemond, C. P., Testi, L., Feldman, P. D., Lecavelier Des Etangs, A., & Vidal-Madjar, A. 2008, A&A, 484, 225
- McCandliss (2003) McCandliss, S. R. 2003, PASP, 115, 651
- McCandliss et al. (2010) McCandliss, S. R., France, K., Osterman, S., Green, J. C., McPhate, J. B., & Wilkinson, E. 2010, ApJ, 709, L183
- Muzerolle et al. (2001) Muzerolle, J., Calvet, N., & Hartmann, L. 2001, ApJ, 550, 944
- Najita et al. (2007) Najita, J. R., Carr, J. S., Glassgold, A. E., & Valenti, J. A. 2007, Protostars and Planets V, 507
- Najita et al. (2009) Najita, J. R., Doppmann, G. W., Bitner, M. A., Richter, M. J., Lacy, J. H., Jaffe, D. T., Carr, J. S., Meijerink, R., Blake, G. A., Herczeg, G. J., & Glassgold, A. E. 2009, ApJ, 697, 957
- Natta et al. (2007) Natta, A., Testi, L., Calvet, N., Henning, T., Waters, R., & Wilner, D. 2007, Protostars and Planets V, 767
- Nomura et al. (2007) Nomura, H., Aikawa, Y., Tsujimoto, M., Nakagawa, Y., & Millar, T. J. 2007, ApJ, 661, 334
- Nomura & Millar (2005) Nomura, H. & Millar, T. J. 2005, A&A, 438, 923
- Osterman et al. (2011) Osterman, S., Green, J., Froning, C., Béland, S., Burgh, E., France, K., Penton, S., Delker, T., Ebbets, D., Sahnow, D., Bacinski, J., Kimble, R., Andrews, J., Wilkinson, E., McPhate, J., Siegmund, O., Ake, T., Aloisi, A., Biagetti, C., Diaz, R., Dixon, W., Friedman, S., Ghavamian, P., Goudfrooij, P., Hartig, G., Keyes, C., Lennon, D., Massa, D., Niemi, S., Oliveira, C., Osten, R., Proffitt, C., Smith, T., & Soderblom, D. 2011, Ap&SS, 157
- Osterman et al. (2010) Osterman, S., Penton, S. V., France, K., Béland, S., McCandliss, S., McPhate, J., & Massa, D. 2010, ArXiv e-prints
- O’Sullivan et al. (2005) O’Sullivan, M., Truss, M., Walker, C., Wood, K., Matthews, O., Whitney, B., & Bjorkman, J. E. 2005, MNRAS, 358, 632
- Roberge et al. (2001) Roberge, A., Lecavelier des Etangs, A., Grady, C. A., Vidal-Madjar, A., Bouret, J., Feldman, P. D., Deleuil, M., Andre, M., Boggess, A., Bruhweiler, F. C., Ferlet, R., & Woodgate, B. 2001, ApJ, 551, L97
- Rodriguez et al. (2010) Rodriguez, D. R., Kastner, J. H., Wilner, D., & Qi, C. 2010, ApJ, 720, 1684
- Salyk et al. (2007) Salyk, C., Blake, G. A., Boogert, A. C. A., & Brown, J. M. 2007, ApJ, 655, L105
- Salyk et al. (2011) Salyk, C., Pontoppidan, K. M., Blake, G. A., Najita, J. R., & Carr, J. S. 2011, ApJ, 731, 130
- Sheffer et al. (2007) Sheffer, Y., Rogers, M., Federman, S. R., Lambert, D. L., & Gredel, R. 2007, ApJ, 667, 1002
- Smith et al. (2009) Smith, R. L., Pontoppidan, K. M., Young, E. D., Morris, M. R., & van Dishoeck, E. F. 2009, ApJ, 701, 163
- Sonnentrucker et al. (2007) Sonnentrucker, P., Welty, D. E., Thorburn, J. A., & York, D. G. 2007, ApJS, 168, 58
- Spitzer & Cochran (1973) Spitzer, Jr., L. & Cochran, W. D. 1973, ApJ, 186, L23+
- Stevenson (1982) Stevenson, D. J. 1982, Annual Review of Earth and Planetary Sciences, 10, 257
- Sudarsky et al. (2003) Sudarsky, D., Burrows, A., & Hubeny, I. 2003, ApJ, 588, 1121
- Valenti et al. (1993) Valenti, J. A., Basri, G., & Johns, C. M. 1993, AJ, 106, 2024
- Valenti et al. (2000) Valenti, J. A., Johns-Krull, C. M., & Linsky, J. L. 2000, ApJS, 129, 399
- van der Tak et al. (2007) van der Tak, F. F. S., Black, J. H., Schöier, F. L., Jansen, D. J., & van Dishoeck, E. F. 2007, A&A, 468, 627
- van Dishoeck & Black (1988) van Dishoeck, E. F. & Black, J. H. 1988, ApJ, 334, 771
- Vasyunin et al. (2011) Vasyunin, A. I., Wiebe, D. S., Birnstiel, T., Zhukovska, S., Henning, T., & Dullemond, C. P. 2011, ApJ, 727, 76
- Visser et al. (2009) Visser, R., van Dishoeck, E. F., & Black, J. H. 2009, A&A, 503, 323
- Walter et al. (2003) Walter, F. M., Herczeg, G., Brown, A., Ardila, D. R., Gahm, G. F., Johns-Krull, C. M., Lissauer, J. J., Simon, M., & Valenti, J. A. 2003, AJ, 126, 3076
- White & Ghez (2001) White, R. J. & Ghez, A. M. 2001, ApJ, 556, 265
- Wilkinson et al. (2002) Wilkinson, E., Harper, G. M., Brown, A., & Herczeg, G. J. 2002, AJ, 124, 1077
- Wilson & Rood (1994) Wilson, T. L. & Rood, R. 1994, ARA&A, 32, 191
- Wood & Karovska (2004) Wood, B. E. & Karovska, M. 2004, ApJ, 601, 502
- Woods & Willacy (2009) Woods, P. M. & Willacy, K. 2009, ApJ, 693, 1360
- Yang et al. (2010) Yang, B., Stancil, P. C., Balakrishnan, N., & Forrey, R. C. 2010, ApJ, 718, 1062
- Yang et al. (2011) Yang, H., Linsky, J. L., & France, K. 2011, ApJ, 730, L10+