address=Space Sciences Laboratory, University of California, Berkeley, CA 94720 USA address=Space Sciences Laboratory, University of California, Berkeley, CA 94720 USA address=Space Sciences Laboratory, University of California, Berkeley, CA 94720 USA address=Korea Astronomy and Space Science Institute, 305-348, Daejeon, Korea address=Korea Advanced Institute of Science and Technology, 305-701, Daejeon, Korea address=Korea Astronomy and Space Science Institute, 305-348, Daejeon, Korea
Implications of the SPEAR FUV Maps on Our Understanding of the ISM
Abstract
The distribution of a low-density transition temperature ( K) gas in the interstellar medium conveys the character and evolution of diffuse matter in the Galaxy. This difficult to observe component of the ISM emits mainly in the far-ultraviolet (FUV) (912-1800 Å) band. We describe spectral maps of FUV emission lines from the highly ionized species Civ and Ovi likely to be the dominant cooling mechanisms of transition temperature gas in the ISM. The maps were obtained using an orbital spectrometer, SPEAR, that was launched in 2003 and has observed the FUV sky with a spectral resolution of and an angular resolution of 10′ .
We compare distribution of flux in these maps with three basic models of the distribution of transition temperature gas. We find that the median distribution of Civ and Ovi emission is consistent with the spatial distribution and line ratios expected from a McKee-Ostriker (MO) type model of evaporative interfaces. However, the intensities are a factor of three higher than would be expected at the MO preferred parameters. Some high intensity regions are clearly associated with supernova remnants and superbubble structures. Others may indicate regions where gas is cooling through the transition temperature.
Keywords:
ISM: general – ISM: lines and bands – ultraviolet: ISM:
98.38.Kx1 Introduction
The far-UV (900-1800 Å) spectrum of diffuse interstellar emission contains astrophysically important cooling lines, among them the Ovi doublet () represents the dominant radiative cooling mechanism for gas with temperatures between 105.3 and 105.7 K. The Civ line () is an important radiative cooling mechanism for gas with temperatures between 104.9 and 105.3 K (chianti, ). Because of the high cooling rates due to these and other lines, gas in this temperature range cools rapidly to lower temperatures, and therefore we refer to gas in this temperature range as “transition temperature gas.” Due to the rapid cooling, in order to be observed this gas must be replenished, either from a source of higher temperature gas cooling through this temperature range, shock heating of cooler gas, conductive heating in a boundary between hot and cold gas, or turbulent mixing of hot and cold gas (mckost77, ; spitzer90, ; slavin93, ).
The Spectroscopy of Plasma Evolution from Astrophysical Radiation (SPEAR) instrument, designed for observing emission lines from the diffuse ISM, was launched in late 2003. SPEAR is a dual-channel FUV imaging spectrograph (short- (S) channel 900 - 1150 Å, long- (L) channel 1350 - 1750 Å) with 550, with a large field of view (FOV) (S: 4.0 4.6’, L: 7.5 4.3’) imaged at 10 resolution. See edelstein06a and edelstein06b for an overview of the instrument and mission, and korpela06 for a discussion of data analysis. SPEAR sky-survey observations consisted of sweeps at constant ecliptic longitude from the north ecliptic pole to the south ecliptic pole through the anti-solar point. Throughout the course of the mission about 70% of the sky was observed.
2 Basic properties of FUV radiative cooling
When modeling FUV emission from transition temperature gas it is vital to consider non-equilibrium effects. The cooling due to FUV line emission is efficient enough that for optically thin gas the radiative cooling timescale is always short compared to the recombination timescales. This is true regardless of the pressure or density of the gas in question. Fortunately there are several rules of thumb that can be used to explain the behavior of line emission as gas is heated or cools. These derive from the fact that ionization always lags the temperature.
When gas is heated the ionization state mimics that of a lower temperature gas, therefore the FUV lines are generated in gas that is hotter than would be the case for collisional ionization equilibrium (CIE) emission. Heated gas typically expands, and therefore the densities at which line emission occurs is lower than the CIE value, which reduces the line intensity. Since the intensity is proportional to , emission from low stage ions is typically reduced less than that of high stage ions. In this case we expect both Ovi and Civ intensities to be reduced and that the ratio of Ovi intensity to Civ intensity will also be reduced.
When gas cools through the transition temperature the opposite is true. The emission occurs at lower temperatures and higher densities than is true in CIE. This tends to increase intensities over the CIE values and boost high stage ion emission relative to low stage ions. Therefore, in this case we would expect both Ovi and Civ intensity to increase and for the ratio of Ovi intensity to Civ intensity to increase.
The exact details of how these intensities and ratios change is determined by physical factors, whether the heating is constant or impulsive, whether the pressure is being maintained externally and whether the local pressure can change rapidly enough to match the temperature changes. But in general these rules of thumb appear to hold.
3 Basic Models of FUV emission
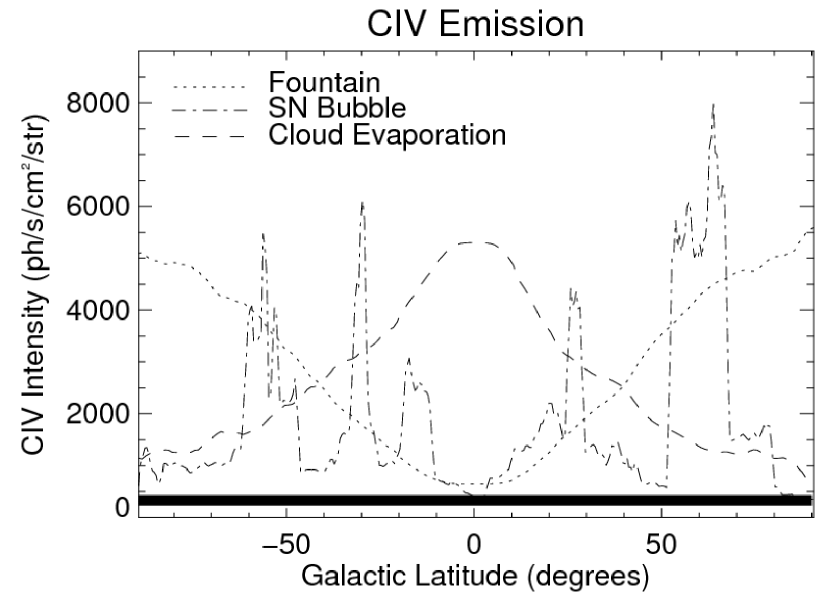
We consider three simple models of the state of hot and intermediate temperature gas in our Galaxy: 1) A McKee-Ostriker type model of neutral clouds evaporating in a pervasive hot ( K) medium (mckost77, ). 2) A Galactic fountain in which hot ( K) gas rises buoyantly above the Galactic plane where it cools and condenses into clouds which fall back into the Galactic plane (spitzer90, ). 3) Isolated supernova remnants distributed in an exponential disk evolving in a non-clumpy medium (slavin93, ). In each case a non-equilibrium plasma emission model was utilized to calculate the expected emission. More details of these models can be found in korpela97 .
McKee-Ostriker Model: The predominant emission in this model is located in conductive cloud boundaries where cool gas is being heated by contact with the hot medium. Because of this the emitting regions are well correlated with the neutral hydrogen clouds they surround. Therefore the emission is brighter in the Galactic plane. Dust opacity limits the maximum intensity seen and sets the ratio between plane and pole intensities. Because the opacity is higher at Ovi, Ovi shows a smaller plane to pole ratio. For the “preferred” MO pressure of 2500 , the Galactic plane intensity is 5300 (hereafter LU) in Civ and 1600 LU in Ovi. The distribution of emission vs Galactic latitude in shown in Figure 1 as the dashed line.
Galactic Fountain Model: In this model the hot gas is presumed to rise to
many times the scale height of the neutral Galactic gas where it cools
radiatively and falls back into the galactic plane. Because of
instabilities the cooling gas is expected to form clumps of higher density where
the emission will be more intense.
The intensity of the emission depends upon the rate at which gas cools through
the transition temperature (which is the same as the total mass flow through the
fountain), and the ratio of Ovi to Civ emission depends
upon the initial temperature of the hot gas and the pressure evolution of the gas
as it cools. We have ignored the possibility of turbulent mixing of hot and
cold gas in this model. For initial temperatures above 106 K, Ovi is typically expected to be a factor of 2 to 10 brighter than Civ. The model
shown is a high scale height model, scaled to match Galactic pole Civ emission
of 5000 LU, which corresponds to a mass flow rate of between 6 and 22
. This is intended to be illustrative of the distribution on
the sky, as Civ and Ovi measurements put upperlimits to the mass flow in a
hot galactic fountain below this level.
Isolated SNR In this model FUV emission is concentrated into limb
brightened SNR. The intrinsic intensity and line ratios of any remnant is
dependent upon the age of the remnant and the pressure and density of the medium
into which it is expanding. The Galactic plane appears dark in this model
because the absorbing dust is presumed to be uniform outside of the remnants.
The average intensity at a given is likely to
be dominated by one or two bright remnants, hence the very non-uniform
distribution of intensity vs seen in Figure 1. This simple
model is ignores correlation of supernova events, which is likely to create
fewer large superbubbles filled with hot gas.
4 Structure of Observed Emission
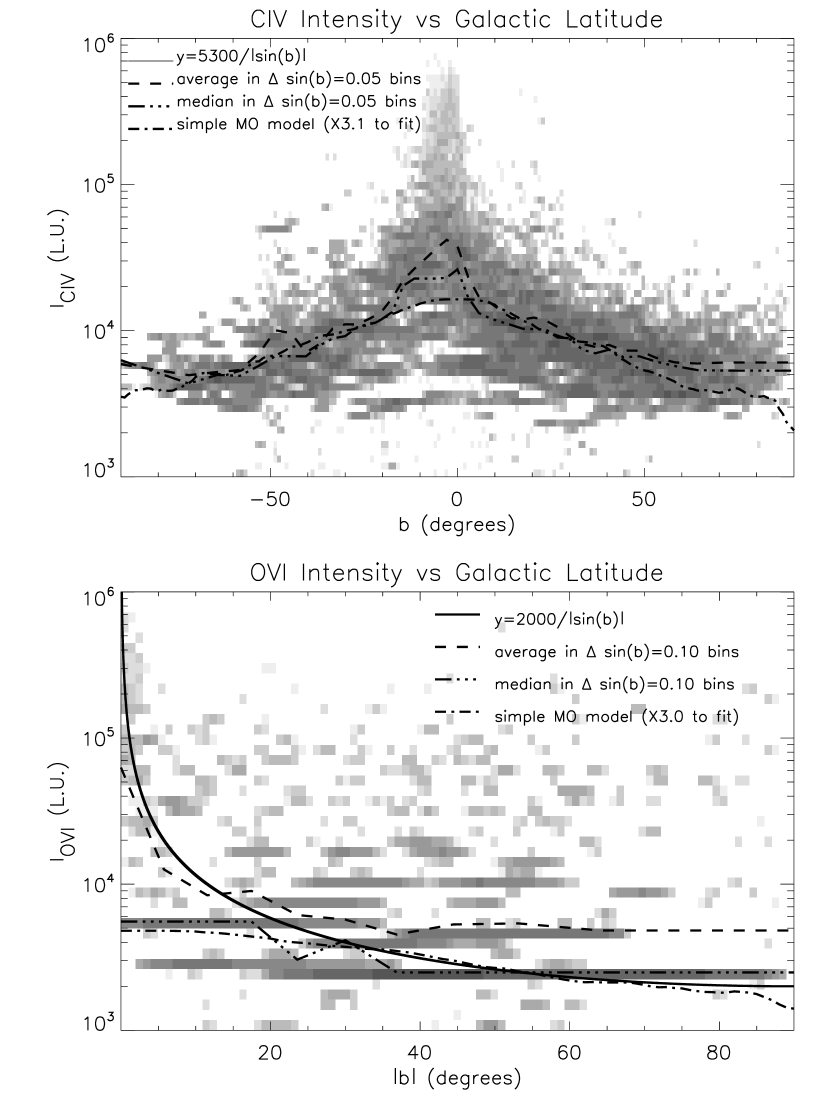
We show the latitude variation of the emission in Figure 2. The grey scale density is proportional to the log of the number of pixels at that with the observed intensity. The dashed lines are the average emission at that , and the double-dot-dash line is the median. The observed emission at Civ shows a distinctly bright Galactic plane and faint poles. The dot-dashed line is the expected profile of the MO model discussed above. Because the sensitivity in the Ovi band was lower than that for Civ, it was necessary to average larger areas of sky, hence the large horizontal extent of regions in the Ovi plot.
Overall the median distributions are very consistent with MO model, however the observed intensities are a factor of 3 higher than for the MO model. Increasing the model pressure to 4300 resolves this, but pushes the neutral gas filling factor to low levels. One possible resolution is a MO type model without pressure equilibrium, with neutral gas at pressures near or below 2500 , transition temperature gas near 4300 , and hot gas at the observed pressures near 104 .
Many of the high intensity regions near the galactic plane are related to known supernova remnants. The Vela SNR and the Cygnus loop SNR are especially prominent in the FUV ( 500k LU). These isolated SNR are more concentrated to the galactic plane than our simple model would suggest and are visible at further distances than our uniform dust distribution would indicate. This can be anticipated for a clumpy dust distribution.
Some bright region at high- are related to known superbubbles, especially Loop 1 and the Orion Eridanus superbubble. Many of the small scale intense regions at high- have not yet been associated with known structures. Some of these may be regions where halo gas is cooling. We note that at high latitudes the average intensity lies up to 3000 LU (Civ) or 5000 LU (Ovi) above the MO model expectations, which could indicate small scale intense regions where Ovi outshines Civ as would be expected in cooling galactic fountain gas. This could indicate a hot galactic fountain flow of up to 3.5 .
5 Conclusions
As expected, each model appears to have some elements of truth. This simple analysis only includes the two brightest emission lines arising in transition temperature gas. More work is being done to incorporate other emission lines of high stage ions in the SPEAR bands (Ciii 977, Oiii] 1661,1667, Siiv 1394,1403, [Oiv] 1401,1407, Heii 1640) into this analysis. It is our hope that this can confirm the identification of the source mechanisms in emitting regions.
References
- (1) Edelstein, J., et al. 2006a ApJ, 644, L153
- (2) Edelstein, J., et al. 2006b ApJ, 644, L159
- (3) Korpela, E. J., et al. 2006 ApJ, 644, L163
- (4) Korpela, E. J. 1997 Ph.D. Thesis, University of California
- (5) McKee, C. & Ostriker, J. 1977 ApJ, 218, 148
- (6) Slavin, J. & Cox, D. 1993 ApJ, 417, 187
- (7) Spitzer, L. J. 1990 ARA&A, 28, 71
- (8) Young, P. R., Del Zanna, G., Landi, E., Dere, K. P., Mason, H. E., & Landini, M. 2003, ApJS, 144, 135