Turbulent Pressure Support in the Outer Parts of Galaxy Clusters
Abstract
We use three-dimensional MHD simulations with anisotropic thermal conduction to study turbulence due to the magnetothermal instability (MTI) in the intracluster medium (ICM) of galaxy clusters. The MTI grows on timescales of Gyr and is capable of driving vigorous, sustained turbulence in the outer parts of galaxy clusters if the temperature gradient is maintained in spite of the rapid thermal conduction. If this is the case, turbulence due to the MTI can provide up to 5–30% of the pressure support beyond in galaxy clusters, an effect that is strongest for hot, massive clusters. The turbulence driven by the MTI is generally additive to other sources of turbulence in the ICM, such as that produced by structure formation. This new source of non-thermal pressure support reduces the observed Sunyaev-Zel’dovich (SZ) signal and X-ray pressure gradient for a given cluster mass and introduces a cluster mass and temperature gradient-dependent bias in SZ and X-ray mass estimates of clusters. This additional physics may also need to be taken into account when estimating the matter power spectrum normalization, , through simulation templates from the observed amplitude of the SZ power spectrum.
keywords:
convection—galaxies: clusters: intracluster medium—instabilities—turbulence—X-rays: galaxies: clusters1 Introduction
Clusters of galaxies are on the exponential tail of the mass function of gravitationally bound objects in the universe. As a result, fundamental cosmological parameters, e.g., , are very sensitive to the statistics and evolution of the cluster population. Unfortunately, only of the total mass of a cluster is contained in the hot intracluster medium (ICM) that is readily observable. Thus for many observational probes the total cluster mass must be estimated by either fitting to hydrostatic equilibrium or by assuming scaling relations between total mass and other observables, e.g., –, where is the total X-ray luminosity.
A new window for studying galaxy clusters has recently been opened with measurements of the Sunyaev-Zel’dovich (SZ) effect, which is produced by the inverse Compton scattering of CMB photons off the hot ICM. Recently a variety of surveys, including the South Pole Telescope (SPT) and the Atacama Cosmology Telescope (ACT) have compiled the first SZ-selected cluster samples (e.g., Vanderlinde et al. 2010). The SZ signal scales linearly with gas density (proportional to total pressure) allowing observations to explore larger cluster radii than is typically possible with X-ray observations. A disadvantage of moving to larger radii is that one is potentially more susceptible to the turbulence and bulk flows that result from structure formation processes. These sources of non-thermal pressure support may significantly complicate the extraction of cosmological parameters from SZ surveys (Shaw et al., 2010).
We have learned in recent years that convection in the ICM is very different from the more familiar convection in stars. In a dilute, magnetized medium like the ICM, the mean free path is much larger than the gyroradius and therefore thermal conduction is entirely anisotropic along magnetic field lines. In this regime the magnetothermal instability (MTI; Balbus, 2000; Parrish & Stone, 2005) can tap into the radially decreasing temperature gradient to drive convection regardless of the background entropy gradient. The MTI in Cartesian simulations with a fixed temperature gradient is capable of driving vigorous convection (approaching supersonic velocities) and a magnetic dynamo that is similar to that of adiabatic convection (McCourt et al., 2011).
Parrish et al. (2008) previously studied the MTI in global galaxy cluster models. In their simulations, the rapid thermal conduction made the outer parts of the cluster isothermal after Gyr, suppressing the free energy driving the MTI. However, there are observational studies that suggest that most clusters have temperature profiles that decline with radius outside a few hundred kpc (Pratt et al., 2007). Motivated by these results, we revisit 3D MHD simulations of the MTI in the ICM; in contrast to previous work, we now prescribe a fixed temperature gradient in the outskirts of clusters. In analyzing the results of these simulations, we focus on quantifying the non-thermal pressure support that results from MTI-driven turbulence. In Section 2, we describe our methodology and fiducial cluster model. In Section 3, we describe the results of our numerical experiments; we discuss their implications for SZ and X-ray studies of galaxy clusters in Section 4.
2 Method and Models
We solve the usual equations of magnetohydrodynamics (MHD) with the addition of anisotropic thermal conduction. The MHD equations in conservative form are
| (1) |
| (2) |
| (3) |
| (4) |
where the symbols have their usual meaning. The total energy is given by
| (5) |
where . Throughout this paper, we assume . The anisotropic electron heat flux is given by
| (6) |
where is the Spitzer conductivity (Spitzer, 1962) and is a unit vector in the direction of the magnetic field.
We simulate the fully 3D time-dependent evolution of our model galaxy clusters using the MHD code Athena (Stone et al., 2008) with the addition of a module for anisotropic thermal conduction along magnetic field lines (Parrish & Stone, 2005; Sharma & Hammett, 2007). Our initial condition is a spherically-symmetric, hot, massive cluster that roughly resembles Abell 1576 (although not fit to the exact parameters) with a mass of . We use a softened NFW profile with a scale radius of kpc and a softening radius of 70 kpc. We initialize an atmosphere in hydrostatic equilibrium using the entropy power law in the ACCEPT database for Abell 1576: a central entropy , , and power-law exponent, (Cavagnolo et al., 2009). We use a mean molecular weight which corresponds to a metallicity of approximately 1/3 solar. If we assume that our fiducial cluster is located at , then for the appropriate WMAP5 cosmological parameters , and the virial radius is Mpc, where corresponds to an overdensity of times the critical density. We do not include cooling, as we focus on the portion of the cluster that is well outside the cooling radius.
The simulations are carried out on a Cartesian grid in a computational domain that extends from the center of the cluster out to (2400) kpc for our fiducial (or larger domain) simulations. Within this Cartesian domain, we define a spherical subvolume with a radius of 1225 (2200) kpc from which we extract cluster properties, thus avoiding boundary condition effects. In this volume we initialize tangled magnetic fields with (plasma –) and a Kolmogorov power spectrum (see Parrish et al. (2009) for details). We have also performed runs at and and find that the kinetic energies are reasonably well converged at our fiducial resolution. The magnetic field amplification is not quite as well converged, and higher resolution simulations have higher final magnetic field strengths. We choose a smaller magnetic field strength than that observed in clusters as a guess of what the magnetic field strength was when clusters first formed. In order to simulate clusters with a negative radial temperature gradient, we fix the temperature at the peak of the cluster temperature profile (approximately 200 kpc) and at the maximum radius of our model cluster to the initially-computed temperature values. Thus, we are imposing Dirichlet boundary conditions on the temperature profile. This fixed temperature gradient then drives the continued evolution of the MTI. Our fiducial model has a peak temperature of 10 keV at 200 kpcs and a temperature gradient of 3.5 keV (i.e., ) over Mpc. This fixed temperature boundary condition represents the key difference between this work and Parrish et al. (2008).
We also examine the interplay between other sources of turbulence and the MTI. Such turbulence could arise from galaxy wakes or structure formation, and is almost certainly present in the outer regions of clusters (Nagai et al., 2007). We drive turbulence with an outer scale of 200 kpc and a steep spectrum () with an energy injection rate per unit volume such that the turbulence has a Mach number, , within 1 Mpc (more specifically ). This turbulence is driven in Fourier space with random phases with a radially constant energy injection rate using the method detailed in Parrish et al. (2010). Our toy model for turbulence results in Mach numbers somewhat smaller than found in non-conducting structure formation calculations (e.g, Lau et al., 2009).
3 Results
Our understanding of the saturation of the MTI was elucidated in McCourt et al. (2011). The MTI is most unstable for dynamically weak () magnetic fields that are perpendicular to gravity. As the instability develops, the magnetic field initially becomes progressively more aligned with the local gravitational field. The initial intuition was that the MTI behaved as a dual to the heat-flux-driven buoyancy instability (HBI; Quataert, 2008; Parrish & Quataert, 2008), and saturated by turning horizontal () magnetic field lines into vertical () field lines, a bulk reorientation of the magnetic field geometry. However, if the field lines are predominantly vertical, horizontal () motions have essentially no restoring force (for weak magnetic fields), and any small perturbation produces a horizontal field geometry that is again MTI unstable.111Buoyant overstabilities, such as those highlighted in Balbus & Reynolds (2010), can also be present; however, their effect is subdominant as they grow much more slowly than the MTI. Thus, the MTI cannot be suppressed by simply rearranging the magnetic field. Instead, in Cartesian simulations of approximately one scale height in size, the MTI drives sustained convection with rms Mach numbers of .
To understand the saturation of the MTI in global clusters with a fixed temperature gradient, we first consider our fiducial cluster model with the domain size of 1225 kpc. The MTI growth time is given by
| (7) |
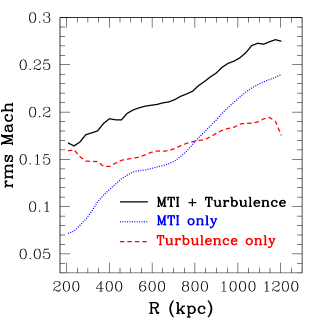
If we assume that major mergers occur on a 5 Gyr timescale then there are over 8 -folding times available for the MTI to grow; thus there is sufficient time for the MTI to become highly nonlinear. In approximately 2–3 Gyr, the turbulence reaches a statistical steady state. Figure 1 shows an azimuthally-averaged radial profile of the Mach number in this steady state for our fiducial cluster model. The MTI drives large turbulent velocities with mean Mach numbers within . We also simulated our fiducial cluster with anisotropic Braginskii viscosity and found that the turbulent velocities are the same to within . This negligible impact of viscosity on the evolution of the MTI is consistent with theoretical predictions (Kunz, 2011).
It is also important to assess how the MTI interacts with other sources of turbulence—turbulence that could be driven by structure formation or other processes. Figure 1 shows the saturated Mach number profiles for numerical experiments in which we add turbulent external driving to our fiducial model both with and without anisotropic conduction. We find that the externally-driven turbulence adds to the MTI-driven turbulence such that the turbulent energies roughly add linearly. This property corresponds to turbulent velocities and Mach numbers that add in quadrature:
| (8) |
We find that this scaling holds for levels of external turbulent driving both larger and smaller than shown in Figure 1, provided that the Mach numbers are reasonably subsonic.
Although the kinetic energy quickly saturates to a relatively steady state value for both the MTI-only and the MTI plus turbulence simulations, the growth of the magnetic field is comparatively slow. More quantitatively, the logarithmic growth rate of magnetic energy for our fiducial case with both conduction and driven turbulence is . This is times slower than the linear growth of the MTI. Initially the magnetic fields are completely tangled; thus, the orientation is statistically isotropic: . For the MTI-only run, the magnetic geometry develops a small radial bias, peaking around at 2 Gyr before declining to isotropy again. For the run with the MTI and driven turbulence, the magnetic field only briefly deviates from statistical isotropy, fluctuating around .
Previously Ruszkowski et al. (2010) performed a cosmological study of the evolution of a single cluster with anisotropic thermal conduction. They found evidence for a small radial bias in the magnetic field; however, in the cosmological simulations the effects of the MTI and radial infall were not disentangled. In light of our simulations, it is likely that the radial magnetic fields in the cosmological simulation are due to infalling substructure dragging magnetic field lines out. The isolated non-cosmological simulations presented here are necessary to separately understand these effects. Our results also suggest that the radial magnetic field bias observed in Virgo (Pfrommer & Dursi, 2010) is also likely due to infall or galaxy motions rather than the MTI.
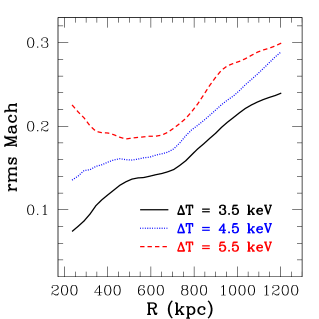
For a given cluster mass, the saturated state of the MTI depends primarily on , since the free energy of the temperature gradient drives the MTI. We adjust our initial equilibrium to several different temperature gradients by increasing the temperature maximum to study this effect, holding all of the remaining model parameters fixed. Figure 2 shows that there is a clear trend in the resulting turbulence driven by the MTI, with larger temperature gradients producing stronger turbulence. If we calculate a power-law fit to the turbulence induced by the MTI at we find that , where is the temperature drop across 1 Mpc. This scaling is consistent with the simple mixing length estimate of .
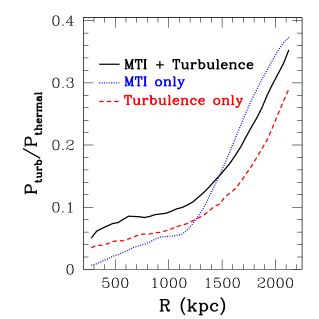
Much of the contribution of clusters to the SZ power spectrum comes from scales comparable to or larger than the virial radius of groups and clusters. In order to understand the possible effects of the MTI on such SZ power spectrum measurements, we have extended our simulation domain to a larger size (). In these larger domain simulations, the MTI drives even more vigorous convection. Figure 3 shows the steady-state turbulent pressure profiles for our large domain simulations with the MTI alone, externally-driven turbulence alone, and both together. The MTI is able to drive convection that yields significant non-thermal pressure support, reaching 35% of the thermal pressure near . The turbulent Mach numbers increase significantly towards the cluster outskirts. Our interpretation is that large convective motions deep in the core overshoot and continue with large momentum to the low-density cluster outskirts; this effect was also seen in our earlier stratified Cartesian simulations (McCourt et al., 2011).
More quantitatively, in a shell centered at 1800 kpc of width 50 kpc, we find that the rms Mach number with 1 fluctuations is . The maximum Mach number in this shell reaches 1.26. The behavior of the simulation with both the MTI and turbulence simultaneously is particularly interesting—within approximately 1200 kpc, the MTI-driven turbulence and external turbulence add in quadrature as seen previously in Figure 1; however, beyond this radius the net turbulence is approaching trans-sonic and the MTI is unable to grow effectively. If we perform the same experiment with the higher temperature gradient of keV, we find that the Mach number can reach values as high as , also likely due to overshoot. Unfortunately, we are not able to run these simulations to a full steady-state as the MHD integrator in Athena crashes in high Mach number, highly stratified, turbulence.
4 Discussion and Implications
Galaxy clusters have the potential to serve as powerful probes of structure formation by breaking the – degeneracy and constraining the dark energy equation of state, . Moreover, much of the constraining power of galaxy clusters is highly complementary to constraints from the CMB and other methods. However, for both SZ and X-ray observations, these applications require accurately determining the total cluster mass either directly through reconstructing a hydrostatic mass or indirectly through calibrated scaling relations (note that this is, of course, not true for lensing mass determinations). It is critical to understand any systematic errors or biases in these cluster mass determinations.
Cosmological hydrodynamic simulations have shown for some time that turbulence produced by structure formation can provide significant non-thermal pressure support in clusters, particularly at large radii (e.g., Evrard, 1990; Vazza et al., 2009). Our results demonstrate that the MTI, a convective instability triggered by anisotropic thermal conduction along magnetic field lines, can also produce significant (near-sonic) turbulent motions in the outer parts ( kpc) of clusters. This turbulence is the strongest at large radii (Fig. 3), in part because of convective overshooting from smaller radii. The non-thermal pressure support produced by the MTI is not directly accounted for in current attempts to estimate cluster masses from observables such as the X-ray luminosity or SZ signal.
Mass measurements of galaxy clusters using Chandra or XMM-Newton have typically been confined to within where the x-ray surface brightness is reasonably large. Even within this radius, we find non-neglible turbulent pressure support –10% (Fig. 2) due to the MTI, with the exact value depending on the cluster temperature gradient. X-ray observations of clusters have been used to try to constrain the properties of dark energy (e.g., Allen et al. 2008); our results suggest the need for somewhat larger priors on the fraction of non-thermal ICM pressure support in such modeling.
The thermal SZ effect is often characterized by the Compton- parameter, which measures the fractional change of the CMB temperature and is . The total SZ signal is then simply proportional to the total thermal pressure of the cluster plasma. As a result, the SZ signal correlates well with the total cluster mass in cosmological hydrodynamics simulations (e.g., Nagai 2006). Turbulence due to the MTI would decrease the SZ signal for a given cluster mass relative to these scaling relations; it would also likely introduce additional scatter into such relations.
In addition to finding individual clusters, SZ experiments survey the entire sky to produce an angular power spectrum whose amplitude is very sensitive to , scaling as (Komatsu & Seljak, 2002). The connection between and the SZ power spectrum requires calibration by simulations, and the first SZ results found , a value that was statistically in tension with other probes of (Lueker et al., 2010; Sehgal et al., 2011). Resolving this discrepancy requires decreasing the predicted SZ power by a factor of . Both the ACT and SPT groups have attempted to remedy this model-specific deficiency by running cosmological simulations with additional feedback (Shaw et al., 2010; Battaglia et al., 2010). Analytical modeling by Shaw et al. (2010) shows that increasing the fraction of non-thermal pressure support in galaxy clusters can significantly reduce SZ power at large angular scales. Thus, the additional non-thermal pressure support produced by the MTI at large radii in galaxy clusters (Fig. 3) may significantly modify the determination of from the SZ power spectrum.
In Figure 2 we have shown that there is a direct connection between the level of turbulent non-thermal pressure support due to the MTI and the cluster temperature gradient at large radii. This is a simple consequence of the fact that it is the temperature gradient that drives the instability in the first place. This result is particularly interesting because it implies that constraints on the temperature gradient could be used to estimate the MTI contribution to the turbulent pressure, which would be very valuable in improving cluster mass estimates. Absent such observational constraints, however, Figure 2 implies that variations in cluster temperature gradients as a function of mass and/or redshift could introduce a subtle bias in the X-ray and SZ signals used to constrain cosmological parameters. In addition, in lower mass clusters or groups with lower virial temperatures, the thermal conduction time across the cluster outskirts will be longer than in the massive cluster model considered in this work. This is likely to cause the turbulent pressure support induced by the MTI to depend explicitly on cluster mass. Recent X-ray observations of Perseus with the Suzaku telescope have shown evidence that suggests clumping of baryons near the virial radius (Simionescu et al., 2011). Turbulence can drive fractional density enhancements ( that scale as either for compressive fluctuations or linearly as if the fluctuations are behaving as a passive scalar in the stratified atmosphere. While not large enough in magnitude alone, the turbulence we find can contribute to these density enhancements.
In our calculations we have fixed the temperature gradient at large radii in our model clusters by using Dirichlet boundary conditions. In reality, the temperature gradient is likely set by an interplay between structure formation (e.g., the virial shock) and thermal conduction itself. In previous simulations of isolated clusters with anisotropic thermal conduction that did not fix the temperature gradient, thermal conduction was effective enough to wipe out the temperature gradient after Gyr, strongly suppressing the level of turbulence generated by the MTI (Parrish et al., 2008). The observational evidence for non-zero temperature gradients at large radii in clusters (e.g., Pratt et al., 2007) motivated our choice of boundary conditions in this work. Physically, we regard this choice as a proxy for cosmological physics not included in our simulations (e.g., heating by substructure moving through the ICM and/or compressional heating and inflow after the virial shock). It remains to be seen, however, whether significant temperature gradients can indeed be maintained. The only cosmological simulation with anisotropic thermal conduction to date found at large radii, with the magnitude of the temperature gradient comparable to that assumed in this work (see Fig. 2 of Ruszkowski et al. 2010).
The non-cosmological simulations presented in this paper are not sufficient to accurately determine the contribution of the MTI to the turbulent pressure support in clusters without calibration by comparison to cosmological simulations. This is particularly true at large radii where our isolated cluster simulations predict near sonic motions for even modest temperature gradients (Fig. 3). We suspect that the convective overshooting that produces these large velocities at large radii is likely to be generic. In the future, a suite of cosmological simulations with anisotropic thermal conduction will be necessary to fully assess the effects of the MTI on SZ and X-ray observations of clusters. Such simulations are now possible but isolated cluster simulations like those presented here are still necessary to pinpoint and understand the key physics.
Acknowledgments
We thank Daisuke Nagai, Marcus Brüggen, and Christoph Pfrommer for useful conversations that helped steer this work. Support was provided in part by NASA Grant ATP09-0125, NSF-DOE Grant PHY-0812811, and by the David and Lucille Parker Foundation. Support for P.S. was provided by NASA through the Chandra Postdoctoral Fellowship grant PF8-90054 awarded by the Chandra X-Ray Center, which is operated by the Smithsonian Astrophysical Observatory for NASA under contract NAS8-03060. We would like to thank the hospitality of the KITP where much of this work was performed and supported in part by the National Science Foundation under grant PHY05-51164. The computations for this paper were perfomed on the Henyey cluster at UC Berkeley, supported by NSF grant AST-0905801 and through computational time provided by the National Science Foundation through the Teragrid resources located at the National Institute for Computational Sciences under grant TG-AST080049.
References
- Allen et al. (2008) Allen, S. W., Rapetti, D. A., Schmidt, R. W., Ebeling, H., Morris, R. G., & Fabian, A. C. 2008, MNRAS, 383, 879
- Balbus (2000) Balbus, S. A. 2000, ApJ, 534, 420
- Balbus & Reynolds (2010) Balbus, S. A., & Reynolds, C. S. 2010, ApJL, 720, L97
- Battaglia et al. (2010) Battaglia, N., Bond, J. R., Pfrommer, C., Sievers, J. L., & Sijacki, D. 2010, ApJ, 725, 91
- Cavagnolo et al. (2009) Cavagnolo, K. W., Donahue, M., Voit, G. M., & Sun, M. 2009, ApJS, 182, 12
- Evrard (1990) Evrard, A. E. 1990, ApJ, 363, 349
- Komatsu & Seljak (2002) Komatsu, E., & Seljak, U. 2002, MNRAS, 336, 1256
- Kunz (2011) Kunz, M. W. 2011, MNRAS, 1288
- Lau et al. (2009) Lau, E. T., Kravtsov, A. V., & Nagai, D. 2009, ApJ, 705, 1129
- Lueker et al. (2010) Lueker, M., et al. 2010, ApJ, 719, 1045
- McCourt et al. (2011) McCourt, M., Parrish, I. J., Sharma, P., & Quataert, E. 2011, MNRAS, 413, 1295
- Nagai (2006) Nagai, D. 2006, ApJ, 650, 538
- Nagai et al. (2007) Nagai, D., Vikhlinin, A., & Kravtsov, A. V. 2007, ApJ, 655, 98
- Parrish & Quataert (2008) Parrish, I. J., & Quataert, E. 2008, ApJL, 677, L9
- Parrish et al. (2009) Parrish, I. J., Quataert, E., & Sharma, P. 2009, ApJ, 703, 96
- Parrish et al. (2010) —. 2010, ApJL, 712, L194
- Parrish & Stone (2005) Parrish, I. J., & Stone, J. M. 2005, ApJ, 633, 334
- Parrish et al. (2008) Parrish, I. J., Stone, J. M., & Lemaster, N. 2008, ApJ, 688, 905
- Pfrommer & Dursi (2010) Pfrommer, C., & Dursi, J. L. 2010, Nature Physics, 6, 520
- Pratt et al. (2007) Pratt, G. W., Böhringer, H., Croston, J. H., Arnaud, M., Borgani, S., Finoguenov, A., & Temple, R. F. 2007, A&A, 461, 71
- Quataert (2008) Quataert, E. 2008, ApJ, 673, 758
- Ruszkowski et al. (2010) Ruszkowski, M., Lee, D., Bruggen, M., Parrish, I., & Oh, S. P. 2010, ArXiv:1010.2277
- Sehgal et al. (2011) Sehgal, N., et al. 2011, ApJ, 732, 44
- Sharma & Hammett (2007) Sharma, P., & Hammett, G. W. 2007, Journal of Computational Physics, 227, 123
- Shaw et al. (2010) Shaw, L. D., Nagai, D., Bhattacharya, S., & Lau, E. T. 2010, ApJ, 725, 1452
- Simionescu et al. (2011) Simionescu, A., et al. 2011, Science, 331, 1576
- Spitzer (1962) Spitzer, L. 1962, Physics of Fully Ionized Gases (Physics of Fully Ionized Gases, New York: Interscience (2nd edition), 1962)
- Stone et al. (2008) Stone, J. M., Gardiner, T. A., Teuben, P., Hawley, J. F., & Simon, J. B. 2008, ApJS, 178, 137
- Vanderlinde et al. (2010) Vanderlinde, K., et al. 2010, ApJ, 722, 1180
- Vazza et al. (2009) Vazza, F., Brunetti, G., Kritsuk, A., Wagner, R., Gheller, C., & Norman, M. 2009, A&A, 504, 33