Stochastic modeling of p53-regulated apoptosis upon radiation damage
Divesh Bhatt, Zoltan Oltvai, and Ivet Bahar.
1 Introduction
Studying cellular response to radiation damage is important from the perspectives of both radiotherapy and the mitigation of radiation damage. In the case of the former, the goal is the induction of cell death, whereas in the latter case a cellular response leading to organismal survival is required.
The fate of the organism after radiation damage is linked in a complex manner to cellular fate. In the short term, an extensive cell death due to radiation damage will lead to the death of the organism. In the long term (relevant only if the organism survives the short term effects), it the survival of healthy and robust cells that dictate the organism’s survival (for example, absence of long term cancerous cells). In this manuscript, we focus on the immediate survival of the organism after radiation damage.
The mechanism of cell death after radiation damage is purported to be apoptosis via caspase activation that occurs several hours after radiation injury. Thus, it is natural to investigate cellular apoptotic machinery. Cellular response to radiation is very complex and involves, possibly, proteins that respond to DNA damage and the formation of free radicals that modify cellular biochemistry. Although the exposure to radiation may be momentary, the effect of the exposure on cellular biochemistry may be long lived. Further, several proteins that are expressed transiently after radiation damage, may trigger downstream response such as caspase activity that occurs long after their expression.
In view of the complex cellular response, protein–protein interactions that lead to that response, and possible importance of temporal evolution of the system, it is important to study systemically the time-dependent cellular response to stress.
There have been various efforts to model cellular response to radiation, as well as to model apoptosis. Efforts to model cellular response to radiation were largely precipitated by the observation, at the level of a single cell, of oscillatory p53 response to radiation damage.1 In particular, the oscillatory response of p53 to radiation damage has been modeled mostly using deterministic simulations with kinetic rate laws,1, 2, 3, 4 and, to a significantly lesser extent, via stochastic simulations.5 Cellular apoptosis has been modeled, independent of p53 radiation response, via deterministic simulations by several research groups, 6, 7, 8, 9 including efforts to include cell–cell variability in a probabilistic manner.10, 11
Recently, there have been a few efforts to link the p53 response to cell survival/death using deterministic simulations,12, 13, 14 or with inclusion of limited stochasticity.15 Due to increasingly larger pool of experimental observation on the proteins involved, and their cellular compartmentalization, in the apoptotic network, modeling of transient system behavior remains an active area of research and serves as a platform for evaluating pharmacological strategies.
Spatio-temporal modeling using stochastic simulation methods allows for detailed examination of the kinetics of biochemical reaction networks within a cell. From such simulations, one can address several different issues: spatial localization of reactions (e.g., on the mitochondrial membrane), as well as studying the time evolution of molecular concentrations in response to perturbations to the system. These perturbations can be radiation stress on the cell, or the response to a given drug dose. Further, stochasticity allows for the inclusion of cell variability in a natural way, as well as for studying conditions where the number of certain types of molecules become very low and their presence/absence dictates system behavior.
In this study, we perform stochastic simulations to study the time evolution of proteins, associated with apoptotic pathways, in response to radiation damage. Further, we check the efficacy of various treatment strategies, including polypharmacological effects. In particular, we use different inhibitors targeting different proteins in the reaction network. The manuscript is organized as follows. We first present the biochemical reaction network, gathered from experimental observations, associated with radiation induced apoptosis. Then, we describe briefly the stochastic simulations that we perform to study cell response to radiation damage, followed by results and discussion.
2 Biochemical reaction network
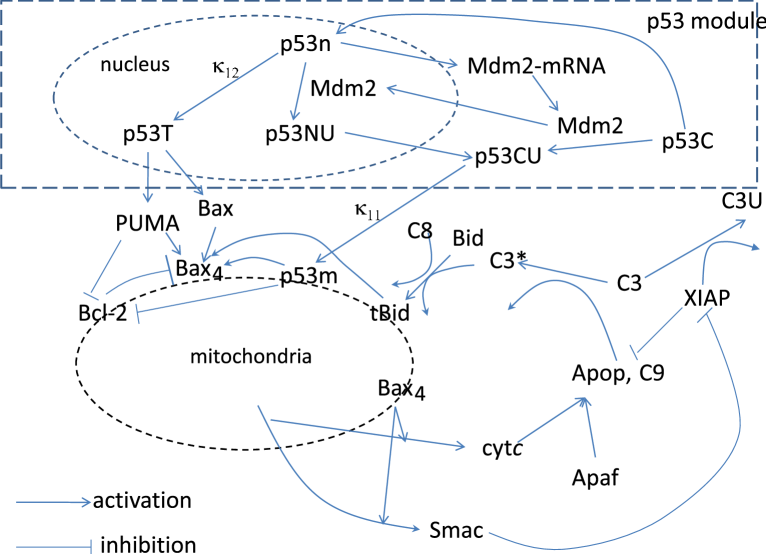
We present here the chain of biochemical events that we use to model apoptotic mechanisms that are activated after radiation damage. Instead of adopting a comprehensive model that includes all the cellular processes that are activated, or affected, by radiation damage, we focus on a number of key proteins/genes as a first approximation. An overview of the key interactions is given in Figure 1. Table 1 gives details about the proteins involved in the system. Several other proteins besides those in Figure 1 are included in the model and described in Table 1, since an interaction map, such as that in Figure 1, does not contain details of the biochemical events that lead to the individual interactions.
Before we describe the radiation response of the network, we present the generic underlying network.
2.1 p53 module
p53 is an integral component of cell death due to genotoxic stress (including radiation damage), and it activates apoptosis via both transcription–dependent and transcription–independent pathways.16, 17, 18 The exact effect of p53 in its transcription-independent role in apoptosis is still in-debate (see a recent review by Lindenboim et al.19), we attempt to incorporate some of the key experimental observations.
The response of p53 to radiation exposure has been studied in great detail at the individual cell level. The response of p53 to radiation determined experimentally forms the starting point of our modeling effort: we first focus on the p53 “module” (as highlighted in Figure 1 with the dashed rectangle) and calibrate our model to reproduce the known p53 response.
p53 exists in several forms in a cell based on its post-translational modifications (e.g., phosphorylation, ubiquitination at different sites). In this manuscript, we utilize a model that captures the known biological features: such as p53 oscillatory behavior upon radiation damage,2, 1, 20 and a stress–induced increase in nuclear p5321 and its transcriptional activity.22, 23
p53 is translated in the cytoplasm (p53C) and this formation is represented by
| (1) |
where represents a null state, and the above reaction represents the formation of p53C under normal operating conditions given by the rate .
p53C can translocate to the nucleus, especially when a cell undergoes stress.21 This translocation is modeled by
| (2) |
where p53n is the nuclear p53. In the nucleus, p53n transcriptionally activates Mdm2 mRNA and this transcription activation is modeled as cooperative:3 p53n tetramers on the DNA leads to this transcription activation. The oligomerization of p53n is depicted by
| (3) |
where the reaction order of the forward reaction is 4. The oligomerized p53 leads to a direct transcription activation of Mdm2:
| (4) |
The Mdm2 messenger RNA translocates to the cytoplasm where it is translated. The cytoplasmic Mdm2 (Mdm2C) can be imported into the nucleus. This series of events is described by the following reactions:
| (5) |
| (6) |
| (7) |
The monoubiquitinated, nuclear p53 (p53NU) is formed via the interaction of p53n with Mdm2 (or similar ligases),24 and we represent this by
| (8) |
A similar reaction is modeled to occur for the cytoplasmic p53 and Mdm2:
| (9) |
Further, the ubiquitinated nuclear p53 can translocate to the cytoplasm:
| (10) |
The ubiquitinated cytoplasmic p53 can translocate to the mitochondria25 as shown below:
| (11) |
Upon severe genotoxic stress, p53n become transcriptionally active for pro-apoptotic proteins23 such as PUMA and Bax, and such a transcriptionally active form is represented by p53T:
| (12) |
Although the major role of p53T is transcriptional activation of pro-apoptotic proteins, we let it retain the capacity for oligomerizing and activating Mdm2 (this, though, is a minor effect),
| (13) |
| (14) |
The increase in p53 upon radiation damage is not expected to be a step function. Similarly, return of p53 to baseline levels after removal of radiation source is not expected to be instantaneous. Indeed, oscillatory levels of p53 persist for an extended period of time after radiation damage.2 Further, p53 response to radiation is mediated by upstream proteins such as ATM. We do not model such upstream agents in specific detail, instead we represent the upstream events by the following set of reactions.
| (15) |
| (16) |
| (17) |
| (18) |
Thus, A activates B, which in turn activates p53C. The effect of these upstream reactions is a smooth increase in p53C concentration after radiation damage.
In addition to the above equations, we model the independent degradation of p53C, p53n, p53CU, p53NU, p53T, and p53m to highlight the fact that external agents (i.e., those not modeled explicitly) have a role in modulating protein concentrations. For example, several E3-ligases (other than Mdm2) ubiquitinate and label p53 for proteasomal degradation downstream. These reactions are given below:
| (19) |
| (20) |
| (21) |
| (22) |
| (23) |
| (24) |
2.2 p53 modulated apoptotic pathways
Now, we discuss the mitochondrial apoptotic pathways downstream of p53, and the role of p53 module to the activation of mitochondrial apoptosis (see Figure 1).
p53T leads to transcription activation of proapoptotic PUMA and Bax, as modeled by
| (25) |
and,
| (26) |
The roles of PUMA and Bax are discussed below.
p53m binds to the anti-apoptotic protein Bcl-2 to inhibit the anti-apoptotic action of Bcl-2 on the mitochondria.26 The biochemical equation associated with this reaction is given by
| (27) |
with binding affinity given by . PUMA also binds to the antiapoptotic Bcl-2 member on the mitochondrial membrane.27
| (28) |
Further, PUMA binds stronger to Bcl-2 than does p53, and can displace p53 from its complex with Bcl-218 - as can be seen by a combination of reactions 27 and 28, thus, freeing up p53 for further proapoptotic activity on the mitochondria, such as by activating Bax/Bak as shown below.
Pro-apoptotic Bax translocates back and forth from the cytoplasm to the mitochondria28 to establish an equilibrium between the cytosolic and mitochondrial Bax concentrations:
| (29) |
At the mitochondria, Bax interacts with Bcl-2 to form a complex28 that prevents Bax oligomerization:
| (30) |
Thus, the available Bcl-2 (that also forms complexes with p53 and PUMA as shown above) regulates the amount of Bax available for oligomerization.
Chipuk et al.27 reported that p53m binds stronger to Bcl-2 than does Bax, and can displace Bax from its complex with Bcl-2. This reaction can be modeled via the following reaction:
| (31) |
However, eq 31 is a straightforward linear combination of eqs 27 and 30, and, thus, the obvious requirement of consistent equilibrium constants must be observed (or, eq 31 should not be considered explicitly).
Active form of Bax on the mitochondrial membrane is needed for oligomerization, a process that requires further interaction of Bax with activators such as tBid. tBid localization to mitochondria29, 30 is an important event for Bax activation and is modeled by the following reaction:
| (32) |
Subsequently, tBid activates mitochondrial Bax into an active (for oligomerization) form:
| (33) |
It has also been suggested that tBid activates Bax in the cytosol which then localizes to the mitochondria.31 However, the order of consecutive reactions is not expected to have a significant effect further downstream (such as caspase activation). A similar Bax (or Bak) activating effect can be achieved by p53m:18
| (34) |
and by PUMA,32
| (35) |
The activated Bax then oligomerizes on the mitochondrial membrane:
| (36) |
Further, higher order oligomerization is modeled following Albeck et al.9
| (37) |
Mitochondrial outer membrane permeabilization (MOMP) induced by Bax oligomerization results in the release of cytochrome-c from the mitochondria into the cytoplasm. We model the release of cytochrome-c via the following process:7
| (38) |
where the above reaction serves to model the fact that the presence of a Bax pore is essential for release of cytochrome-c into the cytoplasm. Similarly, MOMP also releases Smac/Diablo into the cytoplasm: these proteins bind to anti-apoptotic IAP’s and, thus, facilitate apoptosis.33
| (39) |
Cytoplasmic cytochrome-c interacts with Apaf in an ATP-dependent manner, and the heterodimer forms a heptameric complex called the “apoptosome”.34 Following Bagci et al.7, we model these events via the following two reactions:
| (40) |
| (41) |
Further, we use cooperativity in the formation of the apoptosome: the order of the forward reaction 41 is 4.
The apoptosome then incorporates caspase-9, that in its autocatalyzed, activated form cleaves procaspase-3 (C3) to form active caspase-3 (C3∗). Following Albeck et al.,9 we use the following reactions for these processes:
| (42) |
| (43) |
As mentioned above, tBid is an important factor for activation of the caspase cascade. Caspase-8, activated due to external death signals, is an important molecule responsible for Bid cleavage.35 Additionally, active caspase-3 also results in Bid cleavage, resulting in a positive feedback loop activating apoptosis.36 We model the associated reactions following Bagci et. al.7:
| (44) |
| (45) |
The concentration of active caspase-8 depends on external death factors.
XIAP inhibits the activity of apoptosome37, 38 and promotes proteasomal degradation of caspase-339 preventing cell death. On the other hand, Smac inhibits the activity of XIAP.33 These processes are modeled as,9
| (46) |
| (47) |
| (48) |
| (49) |
In addition to above reactions, there are formation reactions for several species – Bcl2, Bax, Apaf, C9, C3, XIAP, Smacm, cytcm, C8, and Bid. Further, these species, along with C3*, C3U, C9U, Bax*, and p53 forms mentioned above also undergo degradation reactions to help establish steady state.
3 Drug interactions
In this section, we integrate the possible drugs to regulate apoptosis in normal cells into the biochemical network discussed above. In particular, we consider four specific proteins targets – Mdm2, PUMA, Bid, and C3∗ (Mdm2-I, PUMA-I, Bid-I, and C3-I, respectively). The actions of the inhibitors are modeled by the following reactions:
| (50) |
| (51) |
| (52) |
and
| (53) |
Known inhibitors of p53/Mdm2 interaction includes nutlins, BEB55, BEB59, and BEB69. Mustata et al.40 have identified several PUMA inhibitors using pharmacophore modeling, and several of these compounds have been shown to inhibit PUMA–induced apoptosis in vitro.
4 Stochastic simulation method
The number of proteins in a typical cell (about picoliter) are significantly less than Avogadro’s number: a nanomolar concentration of a protein corresponds to molecules of that protein in the cell. Accordingly, for smaller cells and/or lower concentrations, deterministic rate equations are not applicable. For this reason, we use the well–known Gillespie algorithm for stochastic simulations of a system of chemical reactions.
Details of the Gillespie Algorithm are given in the original papers.41, 42 Here we briefly describe some of the ideas behind the algorithm.
For illustration, consider the following schematic reaction,
| (54) |
and denote the stochastic rate constant by . This stochastic rate is directly related to the macroscopic kinetic rate, , by a simple relation (which, for the reaction in eq 1 is , where is the reaction volume). At any instant of time, the propensity for the reaction in eq 52 is
| (55) |
where and are the number of molecules of A and B in the reaction volume, and the subscript denotes that the reaction index is in the system of chemical reactions ().
In the Gillespie algorithm, one such reaction is chosen to be proportional to its propensity (we use the so-called Direct Reaction version), and the time is advanced based on the overall reaction propensity at that time.41, 42 The underlying assumptions are that the system is in thermal equilibrium (the number of reactive collisions are much less than the number of non-reactive collisions), and that it is well–mixed.
4.1 Heterogeneity
Real cellular systems are heterogeneous - e.g., mitochondria and cytoplasm offer vastly different environments (and, there may be heterogeneities within these compartments themselves). Thus, at a first glance, the well-mixed assumption of the Gillespie algorithm seems to preclude an application to real cellular systems. However, Bernstein43 developed a protocol to extend the Gillespie algorithm to heterogeneous environments.
In that protocol,43 the cell (or, any simulation volume) is subdivided into elements and a reaction is reproduced and treated as an individual reaction in each subvolume. Accordingly, each reactant is treated as a different molecule in each subvolume (e.g., , where and are different subvolumes), and the reaction propensities are altered accordingly. Further, each subvolume is well–mixed – thus allowing for formulating the system using the Gillespie algorithm. In context of this work, the nucleus, the cytoplasm, and the mitochondrial membrane are well-mixed, distinct subvolumes.
This protocol results in an increase in the number of reactions both due to the fact that each reaction is treated independently in different subvolumes, as well as additional “reactions” (due to diffusion) relating to the conversion of Ai to Aj, as described in detail by Bernstein.43 Based on the identity of a compartment/subvolume, a type of protein may not be present in that compartment (for example, the apoptosome does not permeate through the mitochondrial membrane).
5 Model parameters
We obtain several parameters from experimental results, and obtain others in the range of previous computational studies.7, 9 Here we discuss some known experimental rate/equilibrium constants, and the initial concentrations of the species involved in the biochemical reaction network discussed above.
The dissociation constant, , for p53 and pro-apoptotic Bcl-2 family members have been given variously as 160 nM27 and 535 nM26 – both obtained via surface plasmon resonance. We choose an intermediate value of the dissociation constant (333 nM). PUMA binds significantly more strongly, and Chipuk et al.27 report the dissociation constant nM, a value that we use.
Edlich et al.28 report the on and off rate of Bax from cytosol and mitochondria as approximately the same, and establish a first order reaction (as represented by reaction 3) with and .
For reaction 31, it is reported that p53 displaces Bax from its complex with Bcl-2 at equimolar concentration, whereas Bax displaces p53 from its complex with Bcl-2 at a 50 times higher concentration.18 This implies that . Since eqs 27, 30, and 31 are not independent, the above stated values imply that M. This value of dissociation constant is significantly higher than values reported in the literature (0.1 M44 and 20 nM45). We use nM, except where noted explicitly – and, as shown below, the results obtained are robust to a wide range of values for this dissociation constant.
Half lifes of a few proteins have also been reported in vivo. However, the direct use of such an information (for example, to compute the decay rates of the type A) is often not appropriate because the decay rate of protein A in vivo is convoluted with, for example, the decay of protein B that upregulates A.
The parameters for the p53 module that differ for these three levels of radiation are given in Table 2, and the parameters that stay the same irrespective of the radiation level are given in Table 3. These parameters for the p53 module are chosen to reflect p53 oscillations observed experimentally. and do not affect the dose-dependent oscillatory behavior of p53, however, they are important for coupling of the p53 module to the apoptotic network, and the corresponding values are given in the text and figures below.
5.1 Initial concentrations
When a normally unstressed cell is exposed to radiation, it undergoes a sequence of biochemical events that may, depending upon the radiation dose, lead to apoptosis. Thus, the appropriate initial conditions of cellular protein levels for such an apoptotic study are the steady state conditions in an unstressed cell.
Irrespective of what initial number of molecules we start with, we first allow the system to establish a normal steady state (without radiation–induced apoptosis) by selecting N-IR kinetic parameters from Table 2 (in addition to radiation–independent kinetic equations/parameters). Subsequently, we perturb the system with radiation damage (modeled here as genotoxic effect), and allow the system to evolve. With enough stress, the system will eventually display apoptosis, with a high concentration of pro-apoptotic proteins (such as active caspase-3). In essence, the initial concentrations that are used to study radiation induced damage and subsequent drug treatments are the steady state conditions without any radiation/drug.
For reference, the typical concentration a typical protein present in the cell under normal conditions is 10–100 nm.9 In a picoliter cell, the number of molecules of a typical protein is, thus, in the range 6000–60000. On the other hand, proteins such as active caspase-3 (C3∗) are expected to be low under normal homeostatic conditions.
5.2 Modeling radiation damage
Mitochondrial apoptosis is regulated by transcription–dependent and independent role of p53. Thus, we focus on the p53 module (Figure 1) to model the effects of radiation damage. The downstream action of the apoptotic pathways (for example, represented by Bax oligomerization, cleavage of caspase-3) occur due to the response of the p53 module to radiation damage. Specifically, we model the response of p53 to three different radiation levels: no radiation (N-IR), low radiation (L-IR), and high radiation dose (H-IR).
The procedure for the simulation is as follows. (1) Establish steady state for an unstressed cell (N-IR). (2) induce radiation damage (L-IR or H-IR), as modeled by use of the appropriate kinetic parameters from Table 2 for a certain time . (3) Return to unstressed parameters after .
We note here that does not refer to the time duration of radiation exposure, rather it refers to the amount of time the radiation modifies the kinetic parameters. only indirectly refers to the exposure time: longer exposure to a given radiation dose will affect cellular biochemical kinetics for a longer duration.
6 Results
6.1 Radiation induced p53 oscillations
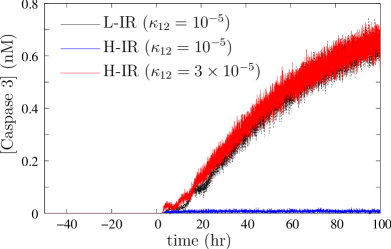
Single–cell experiments to monitor cellular p53 levels after radiation damage showed that individual cells show dramatic oscillations in p53 levels. In particular, these oscillations are sustained and show dose-dependent oscillation frequencies.2 These experimentally observed results form the basis of simulating the p53 module using stochastic simulations: we reproduce the radiation dependent behavior of p53 response using stochastic simulations.
Figure 2 shows the oscillations in p53n (the major p53 component upon radiation damage) as a function of time for two different radiation doses and exposures. The chosen model for radiation damage reproduces the known p53 oscillations, that are dependent upon the radiation dose. At low levels, this frequency is hr, whereas it decreases to hr upon increasing the radiation dose.
The differences in L-IR and H-IR parameters for the p53 module suggests one possible mechanisms for the observed radiation-dose dependent frequencies. Important factors in the model leading to this difference are the enhanced translocation of Mdm2 protein from the cytoplasm to the nucleus, and the enhanced translocation of Mdm2 mRNA from the nucleus to the cytoplasm. This was deliberately chosen to represent the time delay in Mdm2 response that is frequently utilized in deterministic models.3, 46, 47
Thus, this study shows that such time delay can be modeled mechanistically in stochastic simulations (and allow for the modulation of oscillation frequency) by the realization that proteins/genes act in specific cellular contexts. Further, the increase in the translocation rate of the Mdm protein (along with increased translocation of p53) to the nucleus upon DNA damage has been suggested.48
Further, as Figure 2 suggests, at low exposure time (modeled by s), there is a single peak in the p53 profile for both radiation levels. On the other hand, sustained p53 oscillations are obtained for high exposure times (s). Even for cells exposed to radiation for the same amount of time, it is possible that cell–cell variability can lead to different amounts of observed oscillatory peaks ( is, after all, not the radiation exposure time, but is the time for which the kinetic parameters are altered from unstressed levels).
6.2 Role of p53 oscillations in apoptosis
At higher radiation dosage, the oscillations in p53 occur at a higher frequency. However, it is unclear if cellular apoptotic response is mainly determined by the oscillation frequency: is increased apoptosis at higher dose of radiation a direct result of the higher p53 oscillation frequency?
To address this question, we compare the caspase 3 activity obtained via the use of H-IR and L-IR parameters in Table 2, along with the kinetic parameters associated with the rest of the apoptotic machinery. Further, we use the same rates for apoptosis-related transcriptional activation of p53 ( s-1), and for p53 translocation to mitochondrial membrane ( s-1). The obtained caspase-3 concentrations for a cell are shown in Figure 3 for both H-IR and L-IR sets.
Upon using a radiation-dose independent coupling of the p53 module with the apoptotic network, L-IR leads to an increase in caspase-3 activity upon radiation damage (radiation damage occurs at ). On the other hand, H-IR leads to low caspase-3 concentration. Clearly, this result is at odds with experimental observation – increased radiation dose leads to an increase in apoptosis. Correspondingly, if and/or are increased for H-IR, caspase-3 activity is increased (shown in Figure 3).
A crucial insight that emerges from Figure 3 is that the dose-dependent radiation damage and cell death depend upon the coupling of the regulatory p53 module to the apoptotic machinery (defined via an increase in the p53 pro-apoptotic transcriptional activity, , and an increase in p53 translocation to the mitochondria, ), and not merely on the p53-oscillation frequencies. We use the term “coupling” to describe how the p53-regulatory module leads to apoptosis via transcription-dependent () and transcription-independent () pathways.
6.3 Downstream apoptosis cascade
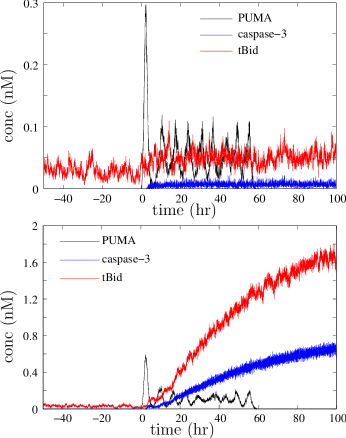
The response of the apoptotic network downstream of the p53 module sheds further light on the role of pro- and anti-apoptotic proteins in the cell. Here, we discuss (i) oscillations downstream of p53, (ii) role of Bax–Bcl-2 interactions, and (iii) the requirement for sufficient Bid cleavage for sustained apoptosis.
Figure 4 shows the concentrations of PUMA, Bax∗, tBid, and caspase-3 after radiation damage with high dose (the qualitative response of low radiation dose is similar).
PUMA mirrors the p53 oscillations, irrespective of the coupling strength. This phenomenon is due to direct activation of PUMA by p53T. Unlike oscillations in PUMA level, oscillations in the concentration of activated Bax show a distinct dependence on the coupling strength: at low coupling strength (no apoptosis), Bax oscillations are sustained, but decay along with PUMA oscillations. On the other hand, a high coupling that results in apoptosis leads to a sustained increase in activated Bax at the expense of oscillations. Bax∗ increases initially due to the direct action of PUMA on Bax. This leads to the release of caspase-3 that cleaves tBid resulting in further Bax activation and a positive feedback loop.
A sustained caspase-3 activity even after the decay of PUMA depends upon whether sufficient tBid is activated by the time PUMA decays. A sustained release of tBid and the positive feedback is very important for sustained caspase activity: for low coupling of p53 module and apoptotic network, insufficient PUMA activity results in an insufficient amount of caspase 3 release and tBid activation to maintain a sustained caspase activity.
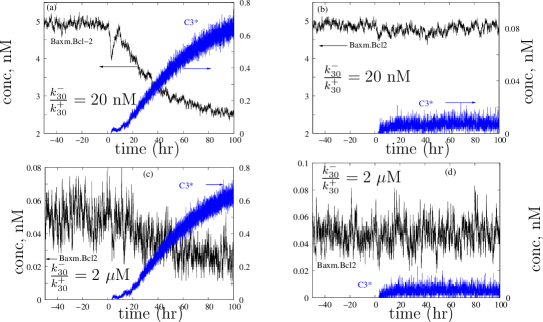
6.3.1 Strength of interaction between Bax and Bcl-2
In Section 5, we discussed the strength of Baxm and Bcl-2 interactions (): different values of this dissociation constant (either directly or indirectly) are suggested by different groups spanning several orders of magnitude.44, 45, 18 Here, we discuss the effect of a range of this dissociation constant on the apoptosis model we use in this manuscript.
Figure 5 shows caspase-3 and Baxm.Bcl-2 concentrations for two different values of the dissociation constants. A comparison of panels (a) and (c) shows that the downstream apoptotic activity is unaffected by dissociation constants that differ by two orders of magnitude (all other model parameters remain unchanged between these two panels): caspase-3 concentration is unaffected, although vastly differing amounts of Baxm.Bcl-2 complex are formed. Similarly, the different dissociation constants had an insignificant effect on systems showing a lack of apoptosis (panels (b) and (d)).
The model is, thus, robust with respect to the strength of Baxm and Bcl-2 interaction. This suggests that cells can exhibit significantly differing strengths of this interaction without affecting the cell fate given a genotoxic insult, and several alternate mechanisms can lead to the same cell fate.
6.4 p53 transcription-independent apoptosis
So far, we have discussed p53 transcription dependent apoptosis via transcriptional upregulation of PUMA and Bax upon radiation damage. On the other hand, the role of p53 in a transcriptionally independent manner is also of importance. In its transcription independent role, it has been suggested that p53 in the cytoplasm can either directly activate Bax, or can indirectly activate Bax by binding to anti-apoptotic Bcl-2 and, thus, preventing the latter’s anti-apoptotic action. In this section, we explore this issue.
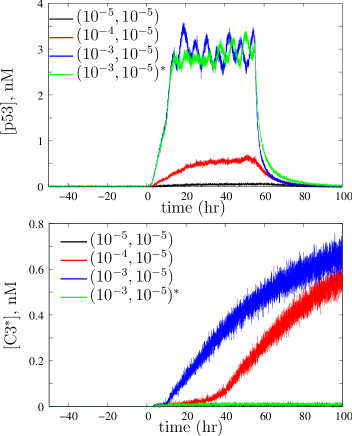
Figure 6 shows the evolution of p53m (top panel) and caspase-3 (bottom panel) with time upon exposure to H-IR for different ratios of transcription dependent () and independent () apoptosis pathway strengths. In the figure, the black line represents the case where the strength of transcription dependent pathways alone is not sufficient to cause apoptosis. Upon an increase in (black, red, and blue lines – in that order), p53m shows an increasingly upregulated behavior. Correspondingly, caspase-3 shows a sustained activity with an increase in p53 transcription independent pathway strength (for the same ).
Strikingly, the removal of direct Bax activation by mitochondrial p53 (green line) results in complete absence of apoptosis for the p53 transcription-independent apoptosis, even for a high strength of transcription independent pathway. This suggests that the indirect role of p53m in apoptosis by binding Bcl-2 is not sufficient for sustained apoptosis by the p53-transcription independent mode – direct Bax activation by the mitochondrial p53 appears to be critical, too.
6.5 Role of inhibitors of specific proteins
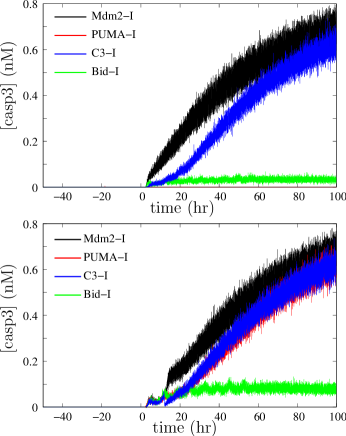
From a pharmacological viewpoint, it is important to identify protein targets that are good candidates for drug treatment to mitigate radiation damage. In this section, we focus on this issue with the aim of identifying potential targets suitable for treatments that are effective even if not administered immediately.
Figure 7 illustrates the efficacy of treatments administered after two different delays: treatments administered immediately after radiation damage (15 minute delay, top panel), and treatments administered after a longer delay (12 hours, bottom panel). The radiation dose in Figure 7 leads to sustained caspase-3 activity in absence of drug treatment (bottom panel of Figure 4, blue curve).
If treatment is available immediately after radiation damage, inhibition of PUMA is very effective in mitigating radiation damage. Similarly, inhibition of Bid also helps in mitigating radiation damage (although to a lesser extent than PUMA inhibition). In contrast, treatment via inhibition of Mdm2 and caspase-3 are not effective. On the other hand, if there is a longer delay before treatment is administered, PUMA inhibition is an ineffective treatment and inhibition of Bid is the most effective treatment. The ineffectiveness of PUMA inhibition in this case results because PUMA activity till the administration of PUMA-I leads to sufficient activation of positive feedback loop involving caspase-3 and Bid: activation of Bax via tBid dominates the apoptotic response at this late stage.
The main cause of apoptosis for the system in Figure 7 is the p53-transcription dependent pathway. Thus, Mdm2 inhibition, that decreases the ubiquitination of p53n and, subsequently, leads to an increase in p53T (and PUMA and Bax), increases the propensity of the system to undergo apoptosis. A comparison of the two panels of Figure 7 shows that administering Mdm2-I sooner after radiation damage leads to a quicker increase in caspase-3 activity.
7 Discussion
7.1 Testable hypotheses
Several key, testable features of cellular response to apoptosis emerges from the model and are listed as following. (i) oscillatory response of PUMA, at the level of a single cell, to radiation damage, (ii) elevated tBid activity even after PUMA decays when an increase in apoptosis occurs, and (iii) inhibition of Bid is more effective in mitigating radiation damage than PUMA inhibition when the treatment is administered after a substantial delay.
The last point is especially relevant with respect to developing a treatment strategy for mitigating radiation damage. Even a very potent inhibitor of PUMA may not prevent apoptosis when it is administered after a substantial delay. Indeed, the inhibitor used in the current model acts in nM concentrations, and despite being effective when administered immediately after radiation damage, is ineffective after a longer delay because of enough tBid activity to maintain a sustained caspase activity.
Even if potent inhibitors of Bid are not currently known, it is possible to test the last hypothesis above using the following two approaches. Firstly, a si-RNA knockout of PUMA performed several hours after radiation damage should be ineffective in mitigating apoptosis due to radiation damage. Secondly, knocking out Bid several hours after radiation damage should be more effective in mitigating apoptosis due to radiation damage.
References
- 1 Bar-Or, R. L., R. Maya, L. A. Segel, U. Alon, and M. Oren. 2000. Generation of oscillations by the p53-mdm2 feedback loop: a theoretical and experimental study. Proc. Natl. Acad. Sci. 97:11250–11255.
- 2 Geva-Zatorsky, N., N. Rosenfeld, S. I. andR. Milo, A. Sigal, E. Dekel, T. Yamitzsky, Y. Liron, P. Polak, G. Lahav, and U. Aron. 2006. Oscillations and variability in the p53 system. Mol. Sys. Biol. 10:1–13.
- 3 Ma, L., J. Wagner, J. J. Rice, W. Hu, A. J. Levine, and G. A. Stolovitzky. 2005. A plausible model for the digital response of p53 to dna damage. Proc. Natl. Acad. Sci. 102:14266–14271.
- 4 Loewer, A., E. Batchelor, G. Gaglia, and G. Lahav. 2010. Basal dynamics of p53 reveal transcriptionally attenuated pulses in cycling cells. Cell. 142:89–100.
- 5 Proctor, C. J., and D. A. Gray. 2008. Explaining oscillations and variability in the p53-mdm2 systems. BMC Syst. Biol. 2:xx.
- 6 Eissing, T., H. Conzelmann, E. D. Gilles, F. Allgower, and E. Bullinger. 2004. Bistability analyses of a caspase activation model for ceceptor-induced apoptosis. J. Biol. Chem. 279:36892–36897.
- 7 Bagci, E. Z., Y. Vodovotz, T. R. Billiar, G. B. Ermentrout, and I. Bahar. 2006. Bistability in apoptosis: Roles of bax, bcl-2, and mitochondrial permeability transition pores. Biophys. J. 90:1546–1559.
- 8 Legewie, S., N. Bluthgen, and H. Herzel. 2006. Mathematical modeling identifies inhibitors of apoptosis as mediators of positive feedback and bistability. Plos Comput. Biol. 2:e120.
- 9 Albeck, J. G., J. M. Burke, S. L. Spencer, D. A. Lauffenburger, and P. K. Sorger. 2008. Modeling a snap-action, variable-delay switch controlling extrinsic cell death. PLoS Biol. 6:e299.
- 10 Spencer, S. L., S. Gaudet, J. G. Albeck, J. M. Burke, and P. K. Sorger. 2009. Non-genetic origins of cell-to-cell variability in trail-induced apoptosis. Nature. 459:428–U144.
- 11 Skommer, J., T. Brittain, and S. Raychaudhuri. 2010. Bcl-2 inhibits apoptosis by increasing the time-to-death and intrinsic cell-to-cell variations in the mitochondrial pathway of cell death. Apoptosis. 15:1223–1233.
- 12 Wee, K. B., U. Surana, and B. D. Aguda. 2009. Oscillations of the p53-akt network: Implications on cell survival and death. Plos One. 4:e4407.
- 13 Pu, T., X.-P. Zhang, F. Liu, and W. Wang. 2010. Coordination of the nuclear and cytoplasmic activities of p53 in response to dna damage. Biophys. J. 99:1696–1705.
- 14 Li, Z. Y., M. Ni, J. K. Li, Y. P. Zhang, Q. Ouyang, and C. Tang. 2011. Decision making of the p53 network: Death by integration. J. Theor. Biol. 271:205–211.
- 15 Zhang, X. P., F. Liu, Z. Cheng, and W. Wang. 2009. Cell fate decision mediated by p53 pulses. Proc. Natl. Acad. Sci. 106:12245–12250.
- 16 Haupt, Y., S. Rowan, E. Shaulian, K. Vousden, and M. Oren. 1995. Induction of apoptosis in hela cells by trans-activation-deficient p53. Genes Dev. 9:2170–2183.
- 17 Caelles, C., A. Helmberg, and M. Karin. 1994. p53-dependent apoptosis in the absence of transcriptional activation of p53-target genes. Nature. 370:220–223.
- 18 Chipuk, J. E., T. Kuwana, L. Bouchier-Hayes, N. M. Droin, D. D. Newmeyer, M. Schuler, and D. R. Green. 2004. Direct activation of bax by p53 mediates mitochondrial membrane permeabilization and apoptosis. Science. 303:1010–1014.
- 19 Lindenboim, L., C. Borner, and R. Stein. 2011. Nuclear proteins acting on mitochondria. Biochem. Biophys. Acta. 1813:584–596.
- 20 Lahav, G., N. Rosenfeld, A. Sigal, N. Geva-Zatorsky, M. B. Elowitz, and U. Alon. 2004. Dynamics of the p53-mdm2 feedback loop in individual cells. Nat. Genet. 36:147–150.
- 21 Marchenko, N. D., W. Hanel, D. Li, K. Becker, N. Reich, and U. M. Moll. 2010. Stress-mediated nuclear stabilization of p53 is regulated by ubiquitination and importin-a3 binding. Cell Death Differ. 17:255–267.
- 22 Joers, A., V. Jaks, J. Kase, and T. Maimets. 2004. p53-dependent transcription can exhibit both on/off and graded response after genotoxic stress. Oncogene. 23:6175–6185.
- 23 Lee, C. W., J. C. Ferreon, A. C. M. Ferreon, M. Arai, and P. E. Wright. 2010. Graded enhancement of p53 binding to creb-binding protein (cbp) by multisite phosphorylation. Proc. Natl. Acad. Sci. 107:19290–19295.
- 24 Lee, J. T., and W. Gu. 2010. The multiple levels of regulation by p53 ubiquitination. Cell Death Diff. 17:86–92.
- 25 Marchenko, N., S. Wolff, S. Erster, K. Becker, and U. M. Moll. 2007. Monoubiquitylation promotes mitochondrial p53 translocation. EMBO J. 26:923–934.
- 26 Tomita, Y., N. Marchenko, S. Erster, A. Nemajerova, A. Dehner, C. Klein, H. Pan, H. Kessler, P. Pancoska, and U. M. Moll. 2006. Wt p53, but not tumor-derived mutants, bind to bcl2 via the dna binding domain and induce mitochondrial permeabilization. J. Biol. Chem. 281:8600–8606.
- 27 Chipuk, J. E., L. Bouchier-Hayes, T. Kuwana, D. D. Newmeyer, and D. R. Green. 2005. Puma couples the nuclear and cytoplasmic proapoptotic function of p53. Science. 309:1732–1735.
- 28 Edlich, F., S. Banerjee, M. Suzuki, M. M. Cleland, D. Amoult, C. Wang, A. Neutzner, N. Tjandra, and R. J. Youle. 2011. Bcl-xl retrotranslocates bax from the mitochondria into the cytosol. Cell. 145:104–116.
- 29 Lutter, M., G. A. Perkins, and X. Wang. 2001. The pro-apoptotic bcl-2 family member tbid localizes to mitochondrial contact sites. BMC Cell Biol. 2:22.
- 30 Gonzalvez, F., F. Pariselli, P. Dupaigne, I. Budihardjo, M. Lutter, B. Antonsson, P. Diolez, S. Manon, J.-C. Martinou, M. Goubern, X. Wang, S. Bernard, and P. X. Petit. 2005. tbid interaction with cardiolipin primarily orchestrates mitochondrial dysfunctions and subsequently activates bax and bak. Cell Death and Diff. 12:614–626.
- 31 Eskes, R., S. Desagher, B. Antonsson, and J.-C. Martinou. 2000. Bid induces the oligomerization and insertion of bax into the outer mitochondrial membrane. Mol. Cell Biol. 20:929–935.
- 32 Ren, D., H.-C. Tu, H. Kim, G. X. Wang, G. R. Bean, O. Takeuchi, J. R. Jeffers, G. P. Zambetti, J. J.-D. Hsieh, and E. H.-Y. Cheng. 2010. Bid, bim, and puma are essential for activation of the bax- and bak-dependent cell death program. Sci. 330:1390–1393.
- 33 Du, C., M. Fang, Y. Li, and X. Wang. 2000. Smac, a mitochondrial protein that promotes cytochrome c-dependent caspase activation by eliminating iap inhibition. Cell. 102:33–42.
- 34 Acehan, D., X. J. Jiang, D. G. Morgan, J. E. Heuser, X. Wang, and C. W. Akey. 2002. Three–dimensional structure of the apoptosome: implications for assembly, procaspase-9 binding, and activation. Mol. Cell. 9:423–432.
- 35 Li, H., H. Zhu, C. J. Xu, and J. Yuan. 1998. Cleavage of bid by caspase 8 mediates the mitochondrial damage in the fas pathway of apoptosis. Cell. 94:491–501.
- 36 Slee, E. A., S. A. Keogh, and S. J. Martin. 2000. Cleavage of bid during cytotoxic drug and uv radiation-induced apoptosis occurs downstream of the point of bcl-2 action and is catalysed by caspase-3: a potential feedback loop for amplification of apoptosis-associated mitochondrial cytochrome c release. Cell Death Differ. 7:556–565.
- 37 Hill, M. M., C. Adrian, P. J. Duriez, E. M. Creagh, and S. J. Martin. 2004. Analysis of the composition, assembly kinetics and activity of native apaf-1 apoptosomes. EMBO J. 23:2134–2145.
- 38 Twiddy, D., D. G. Brown, C. Adrain, R. Jukes, S. J. Martin, G. M. Cohen, M. MacFarlane, and K. Cain. 2004. Pro-apoptotic proteins released from the mitochondria regulate the protein composition and caspase-processing activity of the native apaf-1/caspase-9 apoptosome complex. J. Biol. Chem. 279:19665–19682.
- 39 Suzuki, Y., Y. Nakabayashi, and R. Takahashi. 2001. Ubiquitin-protein ligase activity of x-linked inhibitor of apoptosis protein promotes proteasomal degradation of caspase-3 and enhances its anti-apoptotic effect in fas-induced cell death. Proc. Natl. Acad. Sci. 98:8662–8667.
- 40 Mustata, G., M. Li, N. Zevola, A. Bakan, L. Zhang, M. Epperly, J. S. Greenberger, J. Yu, and I. Bahar. 2011. Development of small-molecule puma inhibitors for mitigating radiation-induced cell death. Curr. Top. Med. Chem. 11:281–290.
- 41 Gillespie, D. T. 1976. A general method for numerically simulating the stochastic time evolution of coupled chemical reactions. J. Comput. Phys. 22:404–434.
- 42 Gillespie, D. T. 1977. Exact stochastic simulation of coupled chemical reactions. J. Phys. Chem. 81:2340–2361.
- 43 Bernstein, D. 2005. Simulating mesoscopic reaction-diffusion systems using the gillespie algorithm. Phys. Rev. E. 71:041103.
- 44 Fletcher, J. I., S. Meusburger, C. J. Hawkins, D. T. Riglar, E. F. Lee, W. D. Fairlie, D. C. S. Huang, and J. M. Adams. 2008. Apoptosis is triggered when prosurvival bcl-2 proteins cannot restrain bax. Proc. Natl. Acad. Sci. 105:18081–18087.
- 45 Ku, B., C. Liang, J. U. Jung, and B.-H. Oh. 2011. Evidence that inhibition of bax activation by bcl-2 involves its tight and preferential interaction with the bh3 domain of bax. Cell Res. 21:627–641.
- 46 Wagner, J., and G. Stolovitzky. 2008. Stability and time-delay modeling of negative feedback loops. Proc. IEEE. 96:1398–1410.
- 47 Bottani, S., and B. Grammaticos. 2007. Analysis of a minimal model for p53 oscillations. J. Theor. Biol. 249:235–245.
- 48 Li, C., L. Chen, and J. Chen. 2002. Dna damage induces mdmx nuclear translocation by p53-dependent and -independent mechanisms. Mol. Cell. Biol. 22:7562–7571.

| symbol | description |
|---|---|
| p53n | nuclear p53 |
| p53T | stress–induced p53 for apoptotic activation |
| p53C | p53 in cytoplasm |
| p53CU | ubiquitinated p53 in cytoplasm |
| p53NU | ubiquitinated p53 in nucleus |
| p53U | polyubiquitinated p53 for proteasomal decay |
| p53m | mitochondrial p53 |
| p53no | p53n oligomer for transcription activation of Mdm2 |
| p53To | p53T oligomer for transcription activation pro-apoptotic PUMA/Bax |
| Mdm2-mRNA | mRNA of Mdm2 |
| Mdm2n | Mdm2/E3 ligase proteins in nucleus |
| Mdm2C | Mdm2/E3 ligase proteins in cytoplasm |
| PUMA | p53-upregulated modulator of apoptosis |
| Bcl-2 | anti-apoptotic Bcl-2 family proteins |
| Bax | proapoptotic Bcl-2 family members |
| Baxn | oligomerized pro-apoptotic Bcl-2 family proteins |
| Baxm | proapoptotic Bcl-2 members on the mitochondria |
| Bid | BH3-only pro-apoptotic proteins |
| tBid | truncated Bid |
| cytc | cytoplasmic cytochrome c |
| Smac | cytoplasmic Smac protein |
| Apaf | Apaf-1 pro-apoptotic protein |
| XIAP | IAP-family proteins |
| apop | apoptosome |
| C9 | caspase 9 |
| C3 | procaspase 3 |
| C3∗ | active caspase 3 |
| C3U | ubiquitinated caspase 3 |
| C8 | caspase 8 |
| No radiation (N-IR) | Low radiation (L-IR) | High radiation (H-IR) | |
|---|---|---|---|
| (s-1) | |||
| (s-1) | |||
| (s-1) | |||
| (M/s) | 0 | ||
| (s-1) | |||
| (s-1) |
| Formation reactions: Ms-1 | ||
| Unimolecular reactions: s-1 | ||
| Bimolecular reactions: s-1 | ||
| Special (cooperative) reactions | ||
| s-1 | s-1 | |
| Formation reactions: Ms-1 | ||
| for Bax, Bcl-2, Bid | ||
| for Apaf, C9, C3, XIAP, Smacm, cytc | ||
| Unimolecular reactions: units s-1 | ||
| : PUMA, tBid, Bid, C3, C9, XIAP, Apaf | ||
| : cytcm, Smacm, Smac, C3∗, C3U, C9U | ||
| : Bax, Bax∗, Bcl2 | ||
| : Mdm2, Mdm2C | ||
| : cytC | ||
| Bimolecular reactions: s-1 | ||
| Special (cooperative) reactions | ||
| s-1 | ||