Very Strong Emission-Line Galaxies in the WISP Survey And Implications For High-Redshift Galaxies 111Based on observations made with the NASA/ESA Hubble Space Telescope, which is operated by the Association of Universities for Research in Astronomy, Inc., under NASA contract NAS 5-26555. These observations are associated with programs 11696 and 12283. 222Some of the data presented herein were obtained at the W.M. Keck Observatory, which is operated as a scientific partnership among the California Institute of Technology, the University of California and the National Aeronautics and Space Administration. The Observatory was made possible by the generous financial support of the W.M. Keck Foundation
Abstract
The WFC3 Infrared Spectroscopic Parallel Survey (WISP) uses the Hubble Space Telescope infrared grism capabilities to obtain slitless spectra of thousands of galaxies over a wide redshift range including the peak of star formation history of the Universe. We select a population of very strong emission-line galaxies with rest-frame equivalent widths higher than 200 Å. A total of 176 objects are found over the redshift range in the 180 arcmin area that we have analyzed so far. This population consists of young and low-mass starbursts with high specific star formation rates (sSFR). After spectroscopic follow-up of one of these galaxies with Keck/LRIS, we report the detection at of an extremely metal-poor galaxy with 12+Log(O/H). After estimating the AGN fraction in the sample, we show that the high-EW galaxies have higher sSFR than normal star-forming galaxies at any redshift. We find that the nebular emission-lines can substantially affect the total broadband flux density with a median brightening of 0.3 mag, with some examples of line contamination producing brightening of up to 1 mag. We show that the presence of strong emission lines in low- galaxies can mimic the color-selection criteria used in the dropout surveys. In order to effectively remove low redshift interlopers, deep optical imaging is needed, at least one magnitude deeper than the bands in which the objects are detected. Without deep optical data, most of the interlopers cannot be ruled out in the wide shallow Hubble Space Telescope imaging surveys. Finally, we empirically demonstrate that strong nebular lines can lead to an overestimation of the mass and the age of galaxies derived from fitting of their SED. Without removing emission lines, the age and the stellar mass estimates are overestimated by a factor of 2 on average and up to a factor of 10 for the high-EW galaxies. Therefore the contribution of emission lines should be systematically taken into account in SED fitting of star-forming galaxies at all redshifts.
Subject headings:
galaxies: evolution – galaxies: statistics – galaxies: high-redshift – infrared: galaxies – surveys – cosmology: observations1. Introduction
The characterization of galaxies undergoing their first major star formation episode is of great interest in modern astrophysics. This class of galaxies is expected to host young and massive stars ionizing the interstellar medium, and therefore to exhibit strong nebular emission lines. However, many efforts dedicated to the understanding of galaxy formation and evolution are in general limited by different factors or colored by the way in which galaxy samples are assembled. Broadband surveys yield magnitude-limited samples that are biased towards bright continuum objects such as the Lyman Break Galaxies (LBGs, steidel96; shapley03; vanzella09; hathi10) , and can favor relatively massive galaxy populations. On the other hand, ground-based searches for rest-frame optical emission lines from high-redshift galaxies are severely impacted by the bright NIR background. Observing in small wavelength windows between OH terrestrial airglow will significantly restrict the survey volume.
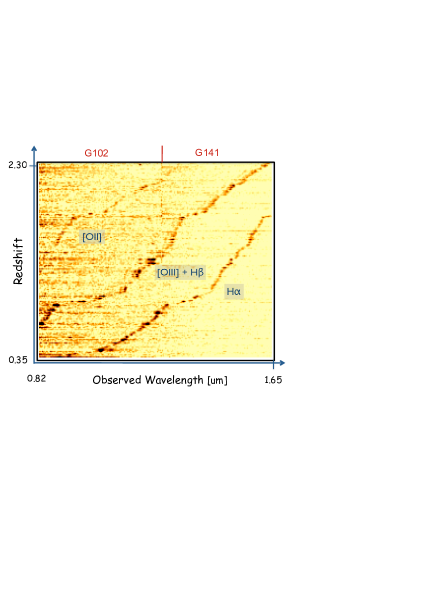
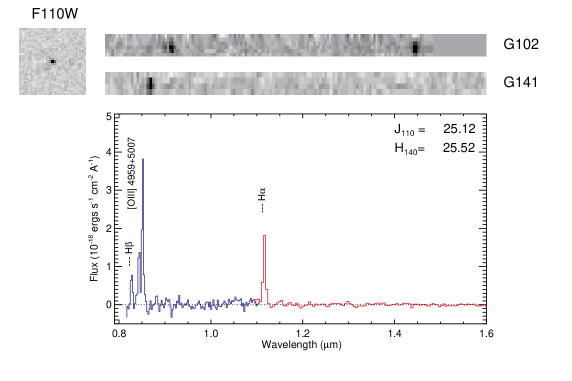
In this context, space-based observations offer considerable advantages for the detection of emission-line galaxies. The Wide field Camera 3 (WFC3) onboard the Hubble Space Telescope (HST) has dramatically improved the power of slitless spectroscopy from above the atmosphere. Beginning in cycle 17, we are conducting the WFC3 Infrared Spectroscopic Parallel Survey (WISP). In about 500 orbits of parallel observations, the program will obtain slitless spectra of galaxies at the peak of the star formation history of the Universe (e.g. Hopkins04). The and IR grisms offer continuous wavelength coverage from 0.8 to 1.7 µm, allowing the selection of emission-line galaxies at , and potentially bright Ly emitters at (see atek10, for a complete description of the survey).
In this paper, we present a sample of emission-line objects with extremely high equivalent widths. The equivalent width of recombination lines indicates the ratio of the current star formation rate (SFR) to the past average SFR of a galaxy (e.g. kennicutt98). Therefore, the high-EW selection picks up galaxies with a strong ongoing star formation episode.
Previously, ground-based narrow-band surveys were used to identify a large sample of ultra strong emission lines galaxies (USELs, kakazu07; hu09), but were restricted to a narrow range of redshifts up to . In the local universe, cardamone09 found in the Sloan Digital Sky Survey (SDSS) compact star-forming galaxies, called “green peas”, that have very blue colors because of their very strong [Oiii]5007 emission line. Thanks to the unprecedented sensitivity of the WFC3/IR detectors, the depth of the direct imaging combined with the resolution and the wavelength coverage of the grism spectroscopy allows us to uncover this particular class of objects independently of the continuum brightness over a wide redshift range.
The selection of high-EW star-forming galaxies with the WFC3 grisms probes a lower mass range than previous studies at (e.g. erb06b; daddi07). This allows us to compare the star-formation efficiency of these dwarf galaxies with normal star-forming galaxies at . Indeed, several studies have established a correlation between the star formation rate and the stellar mass up to redshift (e.g. brinchmann00; elbaz07; noeske07; daddi07; pannella09; oliver10; labbe10). The shape and evolution of this relationship is interpreted as the result of smooth gas accretion (bouche10; dave11). However, at high redshifts, the studies focused on a specific mass range due to the difficulty of selecting faint-continuum galaxies.
In a broader context, we also discuss the implications of these strong line-emitters on the selection of galaxies and on the physical properties of galaxies derived from SED modeling.
We present in Section 2 the WISP survey observations and the data reduction. Section 3 is devoted to the follow-up observations. The selection of the high-EW population is presented in Section LABEL:sec:high_ew. In Section LABEL:sec:ssfr we discuss the mass and star-formation properties of the high-EW galaxies. We present in Section LABEL:sec:low_metal the metallicity measurement of one example and put it into context. We investigate the contribution of nebular lines to the total broadband flux density and their astrophysical implications in Section LABEL:sec:neb_contrib and LABEL:sec:sed. Our conclusions are given in Section LABEL:sec:summary. Throughout, we assume a -dominated flat universe, with km s Mpc, and . All magnitudes are in AB system.
2. The WISP Survey
The WISP survey exploits the powerful pure parallel mode of the HST to obtain slitless spectra of nearly 200 uncorrelated fields in 500 orbits within two observing programs (PI = M. Malkan): GO 11696 and 12283 (Infrared Survey of Star Formation Across Cosmic Time). During long integrations with the Cosmic Origin Spectrograph (COS, osterman11) or the Space Telescope Imager and Spectrograph (STIS, woodgate98), the WISP program uses WFC3 (kimble08) to observe an adjacent field in parallel, at a fixed offset of about 5′ from the primary target. The data include slitless spectroscopy with G102 (0.8 - 1.2 µm) and G141 (1.1-1.7 µm) grisms, and direct NIR imaging with the F110W and F140W filters. As of August 2010, we added the F475X and F600LP filters of the WFC3/UVIS channel to our observing program, with typical exposure times of 400 sec in each band. The fields analyzed in this paper do not have UVIS observations. For the long visits (typically 4 orbits or more), we observe with both grisms with a typical exposure time ratio of G102:G141 = 2.5:1. For shorter visits the fields are observed in G141 only. The direct images are obtained in the same orbits as the grism imaging with a 6:1 grism:direct integration time ratio. It is necessary for the spectral extraction from slitless data to use the direct images to provide the input catalog of objects. The object positions, sizes and shapes are then used, in conjunction with a dispersion solution that translates the position from the direct image to the spectral trace in the grism one, to extract flux and wavelength calibrated 2D and 1D spectra.
In this paper, we analyzed a total of 54 fields presented in Table 1, among which two have optical follow-up (cf. Section 3). We note that our effective area represents about 70% of the full WFC3/IR frame because of two things. First, objects that fall outside the right edge of the direct image frame will have their zero order spectra falling in the right side of the grism frame (zeroth order is dispersed to the left side of the object position). Thus, we cannot correct the zeroth order contamination in that part of the detector. Second, the left edge of the grism frame will receive spectra from objects that are outside the direct image (first order dispersed to the right side of the object position), preventing any flux or wavelength calibration for those sources.
All the data were processed with the WFC3 pipeline CALWF3 (version 2.1) to correct for bias, dark, flatfield and gain variations. Then, the slitless extraction package aXe 2.0 (kuemmel09) is used for the spectral extraction. Spectra with important contamination are removed from the analysis because the contamination estimate of aXe is not sufficiently accurate. A complete description of the data reduction steps is presented in atek10.
3. Optical Follow-Up Spectroscopy and Imaging
We have obtained optical spectra of objects in two adjacent WISP fields with the Low Resolution Imaging Spectrometer (LRIS, oke95; steidel04) on the Keck I telescope. The two WFC3 fields, WISP5 and WISP7 in Table 1, are immediately adjacent to each other and fit within one LRIS slit mask. We assigned 1.2 wide slits to 13 emission line objects, 5 of which belong to the high-EW sample. Three exposures of 1800s each were used for a total integration of 5400s. The 400 l/mm grism blazed at 3400 Å was used on the blue arm and the 600 l/mm grating blazed at 1.0 m was used on the red arm for a pixel scale of Å pix and Å pix, respectively. The plate scale is 0.135″ pix and the spectral resolution for an object that fills the slit is about 8.1 Å and 5.6 Å in the blue and red side, respectively. The seeing during observations was around 1″. The spectrophotometric standard Wolf 1346 was used to flux-calibrate the spectra.
| Field | RA | DEC | F110W | G102 | F140W | G141 |
|---|---|---|---|---|---|---|
| (HMS) | (DMS) | (sec) | (sec) | (sec) | (sec) | |
| WISP1 | 01 06 35.29 | 15 08 53.8 | 884 | 4815 | 506 | 2609 |
| WISP2 | 01 25 10.02 | 21 39 13.7 | 0 | 0 | 328 | 1906 |
| WISP5 | 14 27 06.64 | 57 51 36.2 | 1034 | 5515 | 1034 | 5515 |
| WISP6 | 01 50 17.18 | 13 04 12.8 | 609 | 3609 | 862 | 5015 |
| WISP7 | 14 27 05.91 | 57 53 33.7 | 834 | 6318 | 1112 | 6224 |
| WISP8 | 11 51 51.62 | 54 40 41.2 | 1662 | 9021 | 581 | 2509 |
| WISP9 | 12 29 44.31 | 07 48 23.5 | 759 | 4612 | 684 | 3712 |
| WISP10 | 09 25 07.84 | 48 57 03.0 | 631 | 3909 | 406 | 2209 |
| WISP11 | 11 02 17.38 | 10 54 25.4 | 556 | 3709 | 456 | 2006 |
| WISP12 | 12 09 25.25 | 45 43 19.8 | 1312 | 8221 | 606 | 3009 |
| WISP13 | 01 06 38.77 | 15 08 26.2 | 556 | 3009 | 506 | 2409 |
| WISP14 | 02 34 56.80 | 04 06 54.5 | 834 | 6215 | 481 | 2809 |
| WISP15 | 14 09 42.47 | 26 21 56.0 | 1612 | 8321 | 531 | 2609 |
| WISP16 | 02 34 54.72 | 04 06 42.5 | 1087 | 6921 | 584 | 2509 |
| WISP18 | 12 29 17.25 | 10 44 00.6 | 534 | 3512 | 762 | 3824 |
| WISP19 | 02 34 54.29 | 04 06 30.5 | 1187 | 8721 | 484 | 2809 |
| WISP20 | 14 09 41.15 | 26 22 15.1 | 1815 | 8430 | 559 | 2812 |
| WISP21 | 09 27 55.77 | 60 27 05.3 | 0 | 0 | 353 | 2006 |
| WISP22 | 08 52 44.99 | 03 09 09.6 | 0 | 0 | 253 | 1806 |
| WISP23 | 09 43 16.12 | 05 27 37.1 | 0 | 0 | 681 | 4115 |
| WISP24 | 12 18 41.90 | 29 52 51.8 | 0 | 0 | 278 | 1806 |
| WISP25 | 10 08 42.49 | 07 11 10.3 | 0 | 0 | 734 | 4115 |
| WISP26 | 08 45 17.91 | 22 54 58.5 | 840 | 5521 | 384 | 2209 |
| WISP27 | 11 33 05.98 | 03 28 02.2 | 1040 | 6218 | 384 | 2206 |
| WISP28 | 09 35 46.24 | 14 27 48.5 | 0 | 0 | 634 | 3515 |
| WISP29 | 12 02 59.55 | 48 05 21.2 | 0 | 0 | 328 | 1906 |
| WISP30 | 10 28 18.91 | 39 17 14.1 | 0 | 0 | 253 | 1806 |
| WISP31 | 08 43 27.99 | 26 16 39.7 | 0 | 0 | 659 | 4412 |
| WISP32 | 13 05 20.67 | 25 38 05.5 | 0 | 0 | 484 | 3512 |
| WISP33 | 10 00 02.78 | 12 44 56.4 | 959 | 6415 | 484 | 2809 |
| WISP34 | 09 34 58.06 | 02 02 03.7 | 0 | 0 | 709 | 4215 |
| WISP35 | 13 03 46.90 | 29 53 03.8 | 0 | 0 | 634 | 3812 |
| WISP36 | 13 40 31.52 | 41 23 10.3 | 1237 | 8621 | 584 | 2809 |
| WISP38 | 12 25 13.33 | 02 49 08.4 | 0 | 0 | 709 | 4312 |
| WISP39 | 10 09 38.23 | 30 00 48.7 | 0 | 0 | 328 | 1706 |
| WISP40 | 02 16 20.12 | 39 02 28.1 | 0 | 0 | 584 | 4112 |
| WISP41 | 12 08 28.31 | 45 38 48.2 | 1084 | 6615 | 584 | 2909 |
| WISP42 | 10 01 04.36 | 50 24 02.8 | 1812 | 10424 | 784 | 4012 |
| WISP43 | 21 04 07.62 | 07 23 00.8 | 909 | 6315 | 434 | 2809 |
| WISP44 | 11 12 15.18 | 35 36 55.5 | 0 | 0 | 734 | 4515 |
| WISP45 | 12 37 26.68 | 01 25 18.2 | 0 | 0 | 796 | 4812 |
| WISP46 | 22 37 58.48 | 18 42 05.4 | 0 | 0 | 328 | 1906 |
| WISP46 | 22 37 58.48 | 18 42 05.4 | 0 | 0 | 328 | 1906 |
| WISP47 | 13 19 32.40 | 27 26 40.0 | 0 | 0 | 587 | 3212 |
| WISP49 | 14 44 44.84 | 34 27 45.9 | 1093 | 6018 | 406 | 2406 |
| WISP50 | 22 22 20.25 | 09 36 36.8 | 0 | 0 | 328 | 1906 |
| WISP51 | 15 13 13.77 | 36 33 22.0 | 0 | 0 | 278 | 2006 |
| WISP52 | 13 30 22.62 | 28 11 01.0 | 0 | 0 | 634 | 4218 |
| WISP53 | 15 11 12.91 | 40 25 39.3 | 0 | 0 | 253 | 1806 |
| WISP54 | 15 44 57.26 | 48 45 23.2 | 0 | 0 | 303 | 2006 |
| WISP56 | 16 16 50.58 | 06 36 43.6 | 0 | 0 | 684 | 4312 |
| WISP57 | 12 33 16.74 | 47 53 27.5 | 0 | 0 | 659 | 4615 |
| WISP59 | 15 50 22.59 | 39 59 19.2 | 0 | 0 | 734 | 4515 |
| WISP61 | 23 09 00.35 | 09 07 17.7 | 0 | 0 | 709 | 4312 |
Note. — Observation information for the fields analyzed in this paper. WISP5 and WISP7 have optical imaging in and bands with exposure times of 1500 and 3000 sec, respectively. The two fields were also covered by a slitmask with LRIS at Keck I for a total exposure time of 5400 sec. 1.2″wide slits were used.