The G305 star-forming complex: the central star clusters Danks 1 and Danks 2
Abstract
The G305 H ii complex (G305.4+0.1) is one of the most massive star forming structures yet identified within the Galaxy. It is host to many massive stars at all stages of formation and evolution, from embedded molecular cores to post main-sequence stars. Here, we present a detailed near-infrared analysis of the two central star clusters Danks 1 and Danks 2, using HST+NICMOS imaging and VLT+ISAAC spectroscopy. We find that the spectro-photometric distance to the clusters is consistent with the kinematic distance to the G305 complex, an average of all measurements giving a distance of 3.80.6kpc. From analysis of the stellar populations and the pre-main-sequence stars we find that Danks 2 is the elder of the two clusters, with an age of Myr. Danks 1 is clearly younger with an age of Myr, and is dominated by three very luminous H-rich Wolf-Rayet stars which may have masses 100M⊙. The two clusters have mass functions consistent with the Salpeter slope, and total cluster masses of 80001500M⊙ and 3000800M⊙ for Danks 1 and Danks 2 respectively. Danks 1 is significantly the more compact cluster of the two, and is one of the densest clusters in the Galaxy with . In addition to the clusters, there is a population of apparently isolated Wolf-Rayet stars within the molecular cloud’s cavity. Our results suggest that the star-forming history of G305 began with the formation of Danks 2, and subsequently Danks 1, with the origin of the diffuse evolved population currently uncertain. Together, the massive stars at the centre of the G305 region appear to be clearing away what is left of the natal cloud, triggering a further generation of star formation at the cloud’s periphery.
keywords:
(Galaxy:) open clusters and associations: general (Galaxy:) open clusters and associations: individual:Danks 1, Danks 2 stars: Wolf-Rayet stars: formation (ISM:) H ii regions ISM: clouds1 Introduction
Massive stars have a profound effect on their wider Galactic environment, via the production of copious quantities of ionising radiation, and from the input of mechancial energy and chemically processed matter into the interstellar medium (ISM). For these reasons, an understanding of their lifecycle is of importance to many areas of astronomy. Unfortunately, a number of questions regarding this still remain unanswered, with the nature of their formation mechansism(s) being particularly opaque. While growing observational evidence suggests that stars between 20-40M⊙ may form via disc mediated accretion – in a manner analagous to their lower mass counterparts (e.g. W33A & W51N, see Davies et al., 2010; Zapata et al., 2009) - it is still not clear how more massive stars form (Zinnecker & Yorke, 2007); despite compelling observational evidence for stars with masses significantly in excess of 40M⊙ (WR20a, NGC 3603-A1, and R145, Bonanos et al., 2004; Rauw et al., 2005; Schnurr et al., 2008, 2009).
Stellar hierarchies appear to be a signature of star formation, with stars predominantly forming in clusters and, in turn, clusters forming in larger complexes (e.g. Larsen, 2004). Such structures, spanning tens to hundreds of parsecs, are most readily identifiable in external star-forming galaxies such as M51 (Bastian et al., 2005). While ages for individual clusters within the M51 complexes are difficult to determine, it appears that they are likely to be rather youthful (e.g. 10 Myr) and massive (3-30104M⊙). Similar complexes are seen within interacting, starbursting galaxies such as the Antennae, where star formation rates are an order of a magnitude higher than in M51, in turn yielding individual clusters with masses 106M⊙ (Bastian et al., 2005, 2006).
A precise understanding of the nature of such complexes would be invaluable for the following reasons: (i) they appear to represent a ubiquitous mode of star formation in starburst galaxies; and (ii) by virtue of their masses they provide a statistically well-sampled stellar mass function. Unfortunately, the distances of their host galaxies and compact nature conspire to make the determination of the properties of individual clusters – let alone stars – observationally challenging. Therefore, one might ask whether such structures are present within our own Galaxy? The recent detection of a number of massive (104M⊙) Red Supergiant (RSG) dominated clusters at the base of the Scutum-Crux arm is suggestive of such a complex (Figer et al., 2006; Davies et al., 2007; Clark et al., 2009b; Negueruela et al., 2010, 2011a), although their spatial extent (100pc) and age spread (10-20 Myr) currently preclude an unambiguous association with a single, physically distinct structure.
One observational approach to overcome such uncertainties is to search for young, massive clusters still embedded in their natal giant molecular cloud (GMC) and/or associated giant H ii region. Such a strategy guarantees the youth of such a complex, potentially enabling individual examples of massive young stellar objects (MYSOs) to be identified, and ultimately the global star formation history from a spatially resolved census of the (proto-) stellar populations. The latter goal is particularly important, since the limited spatial resolution of such objects in external galaxies precludes a detailed analysis of the processes by which the GMC is converted into stars and star clusters.
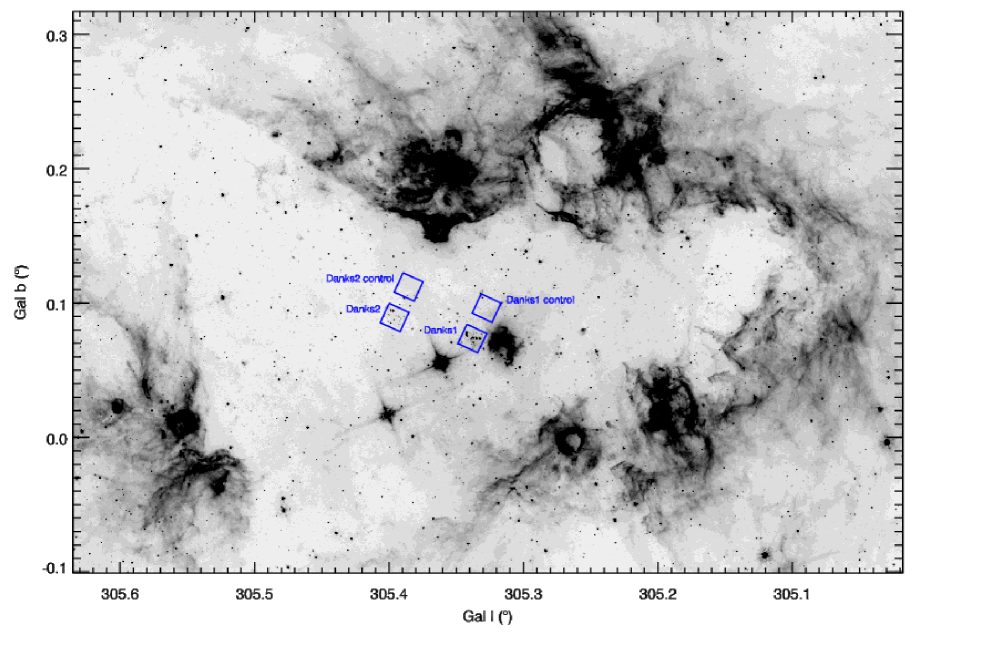
A number of GMCs which appear to contain both massive (103 M⊙), young clusters as well as deeply embedded MYSOs have been identified (e.g. W49A, W51 and the Carina nebula; Alves & Homeier, 2003; Kumar et al., 2004; Smith & Brooks, 2007). Another such region is the G305 star forming complex (Clark & Porter, 2004, =305.4, =+0.1; ). Located in the Scutum-Crux arm at an estimated distance of kpc, it has the form of a large tri-lobed cavity with a maximum extent of 34pc, delineated by both mid- and far-IR, sub-millimetre and radio emission and centred on the young clusters Danks 1 & 2 (Fig. 1). A large contingent of massive stars is inferred from the ionising radiation required to support the total radio flux (equivalent to the output from 30 canonical O7 V stars). In addition, there are numerous signposts of ongoing star formation in the cloud’s periphery, in the form of deeply embedded MYSOs, compact Hii-regions, and methanol and water masers (Urquhart et al., 2007, 2009; Hindson et al., 2010; Clark et al., 2011). Finally, far-IR and sub-millimetre continuum observations reveal the presence of a significant reservoir of cold molecular material (105M⊙) available to fuel further star-forming activity (Hindson et al., 2010, Clark et al. in prep).
The overal morphology of the complex is strongly indicative of a number of epochs of sequential star formation, initiated and sustained by the action of the two central clusters. In this paper, we present a near-IR analysis of these clusters, using high-resolution photometry and spectroscopy, in order to determine their masses and ages, and consequently whether their properties are consistent with such an hypothesis. We discuss and present these data in Section 2, report our analysis in Section 3 and discuss these result both in the context of the G305 complex and also in comparison to other star forming regions in Section 4, before summarising our conclusions in Sect. 5.
2 Observations & data reduction
2.1 Photometry
2.1.1 Observations
Images of the two clusters were obtained with HST/NICMOS on 16 July 2008. We used the NIC3 camera, which has a field-of-view of 51.2′′51.2′′ and a pixel scale of 0.2′′. The clusters were imaged through each of the filters F160W and F222M, as well as the narrow-band filters F187N and F190N which are centred on P and the neighbouring continuum respectively. In addition to the clusters, in order to characterize the foreground population we also imaged nearby control fields through the F160W and F222M filters. The observed fields are indicated in Fig. 1.
In our observations we employed a spiral dither pattern with six separate pointings, each offset from the last by 5.07′′. By employing sub-pixel dithering we minimise the effects of non-uniform intra-pixel sensitivity. We used the MULTIACCUM read mode, using read-sequences and patterns that provided good sampling coverage over a large dynamic range. The sampling sequences and total integration times we used for each filter are listed in Table 1.
| Filter | SAMP-SEQ | NSAMP | (s) |
|---|---|---|---|
| F160W | STEP2 | 17 | 168 |
| F222M | STEP8 | 12 | 448 |
| F187N | STEP8 | 10 | 240 |
| F190N | STEP8 | 10 | 240 |
2.1.2 Data reduction and analysis
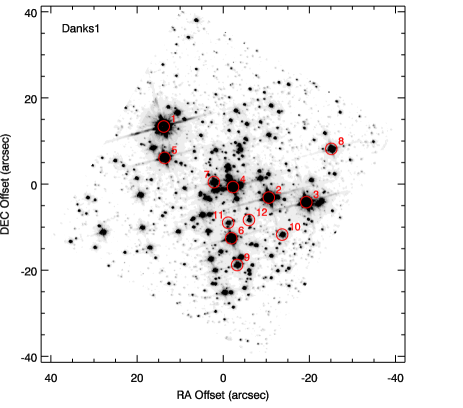
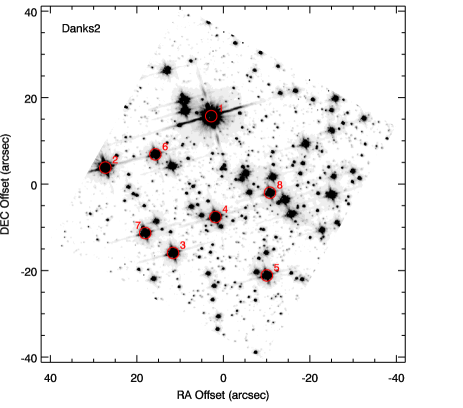
Following the guidelines of the NICMOS Data Handbook v7.0 we performed the standard reduction steps of bias subtraction, dark-current correction and flat-fielding using the custom-written NICMOS software calnica. as our dithered observations made three sub-samples of each pixel we re-sampled each dithered observation onto a finer grid containing a factor of 3 more pseudo-pixels. The six images were then mosaicked together, again using the custom-written NICMOS software. The final mosaics of each cluster are shown in Fig. 2.
In extracting the photometry from the images, we experimented with several methods and algorithms. We found that the best results were obtained (fewest spurious source detections, most effective deblending of sources) using the starfinder routines (Diolaiti et al., 2000) which run under the IDL environment. The algorithm uses the image point-spread function (PSF) in order to locate point-sources. We found that the algorithm was most effective when using the synthetic PSF generated by tinytim. To check for consistency between this method and regular aperture photometry, we ran both starfinder and daophot on the relatively uncrowded control fields and found no systematic differences between the two.
In order to characterize the statistical completeness in each field observed, as well as make empirical measurements of the photometric errors, we performed artificial star experiments on both cluster fields. We used tinytim to generate the artificial stars with a luminosity function identical to that observed in each field. We then randomly sampled artificial stars from this luminosity function and added them to the image. No more than 100 stars were added to the image so as not to significantly alter the level of crowding. The photometry algorithm was then re-run on the artificial image, and the output photometry and astrometry compared with the locations and magnitudes of the input stars. For a star to be considered ‘recovered’ we specified a maximum distance separation between input position and detected position of 0.22′′, or roughly 1 of the PSF. Additionally, if the output magnitude of a star was more than a factor of 2 greater than the input magnitude then it was assumed that that star had been blended with a brighter one, and that the input star was lost. The 50% completeness limits were found to be at and for Danks 1, and and for Danks 2. The slightly fainter detection limit for Danks 2 with respect to Danks 1 is due to the reduced level of crowding in that field.
2.2 Spectroscopy
2.2.1 Observations
Spectra were obtained of several stars in each cluster using the ESO ISAAC instrument mounted on UT1 of the VLT111ESO programme ID 077.C-0207(B), PI J.S. Clark. Observations were taken in good weather on the nights of June 27th to July 2nd 2006. The instrument was used in medium resolution mode with the 0.3′′ slit, and two overlapping wavelength settings were used per target to achieve a spectral range of 2.04-2.21m at a spectral resolution of =8900.
The observing strategy was to align the slit in order to obtain spectra of two programme stars simultaneously. The stars were nodded along the slit in an ABBA pattern. Integration times per slit position were limited to 100 seconds to allow for accurate subtraction of the sky emission, with each integration split into 4-10 seperate read-outs to avoid saturation around strong stellar emission lines. The total integration times per star were between 400-500 seconds. The star HD 113457 (spectral type A0 v) was observed after every two target observations as a measure of the atmospheric absorption. Continuum lamp exposures were taken just as frequently in order to correct for any fringing on the detector.
2.2.2 Data reduction
Nod pairs were subtracted from one another to remove bias level, dark current and sky emission lines. Before extracting the spectra, the frames were corrected for the degree of warping which is present in ISAAC spectroscopic data. Warping in the spatial direction was characterized by fitting polynomials to the stellar spectral traces across the detector. To measure the warping in the dispersion direction a ‘sky lines’ image was created by summing all nod pairs of the same target and subtracting the stars. The sky lines were then fitted with polynomials to wavelength-calibrate the data and to measure the degree of warping in the dispersion direction. Using the fits to the stellar traces and the sky lines each frame was then resampled onto a linear, wavelength calibrated grid. The wavelength solution of each frame had an r.m.s. of 0.2-0.3 pixels, or 3-6 km s-1.
In some observations, it was noticed that a degree of diffuse line-emission was present due to ionized nebulae in the vicinity of the clusters. This emission was subtracted from each frame by fitting gaussian profiles to the spatial variations and interpolating across any stellar traces that it intersected.
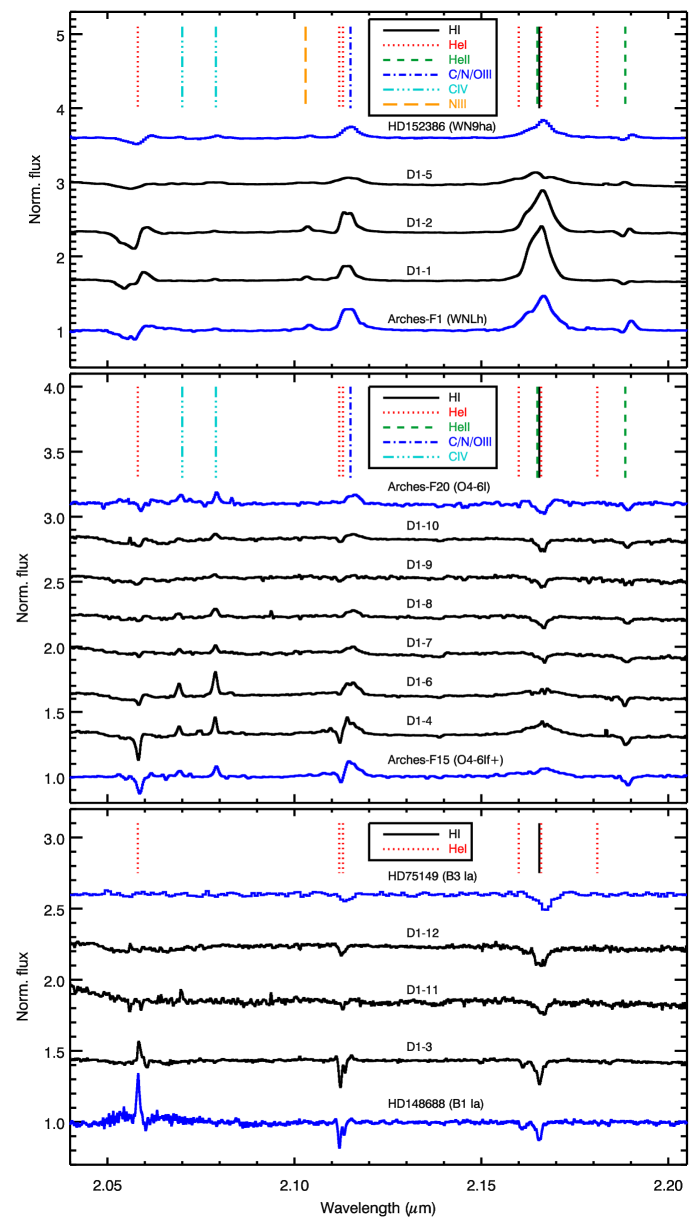
Spectra were extracted by summing across the pixels around each stellar trace. Cosmic ray hits and bad pixels were rejected by comparing repeat observations of the same star. Before dividing through by the telluric standard spectrum, we first fitted the standard’s Br absorption feature using a Voigt profile, and corrected for the continuum slope by dividing through by a black-body appropriate for the star’s spectral type. The standard star spectrum was then cross-correlated with the science target to correct for any small sub-pixel shifts which may produce artifacts in the final spectrum. The signal-to-noise ratio (SNR) of the fully reduced target spectra was estimated from flat regions of continuum, and was found to be typically 150-400. The final spectra for the stars in Danks 1 and 2 are shown in Fig. 3 and Fig. 4 respectively.
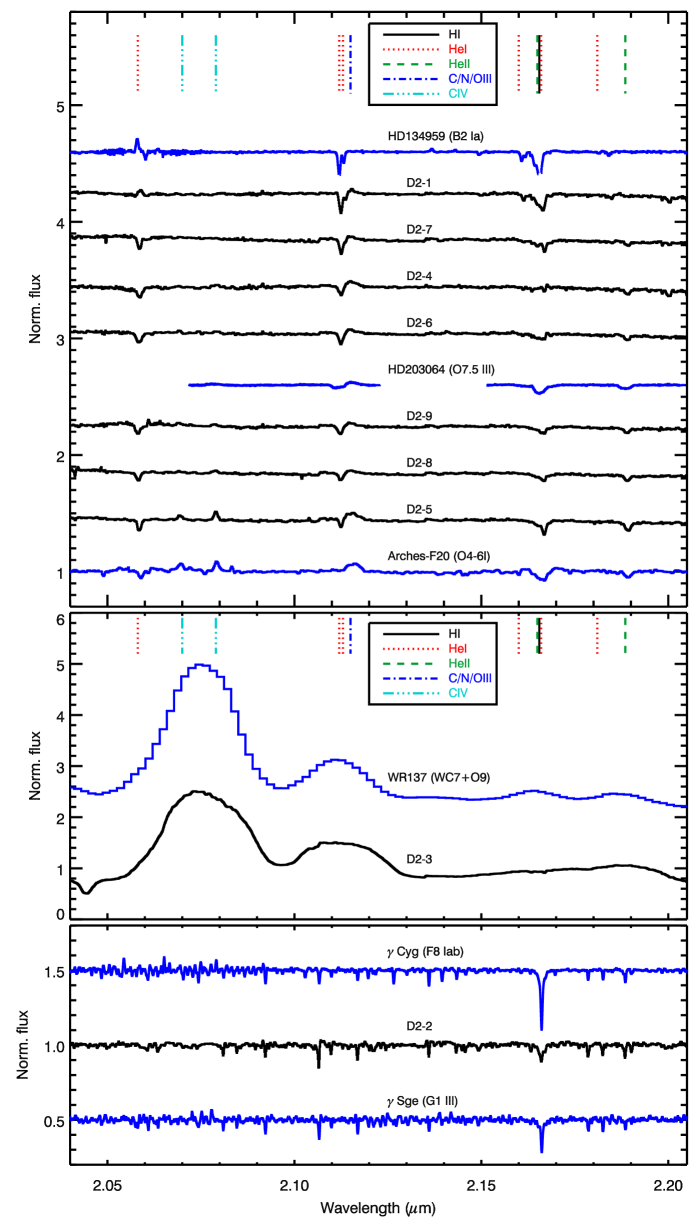
2.2.3 Spectral classification
With the exception of one object (D2-2), we found that all stars observed exhibited spectral features associated with hot stars. The diagnostic features observed were Br , He i (2.056m, 2.112m, 2.165m), He ii (2.189m), the blend of C iii, N iii and O iii at 2.115m, N iii (2.103m), and C iv (2.070m, 2.079m).
In order to classify the spectra of the stars, we used the works of Hanson et al. (1996, 2005), Morris et al. (1996), Figer et al. (1997) and Bohannan & Crowther (1999). Also, since a number of Danks stars have -band spectra which are remarkably similar to those in the Arches cluster, we make comparisons to the spectra of those stars presented in Martins et al. (2008). Given the comparative paucity of emission features suitable for classification, spectral types determined solely from K band spectra are inevitably less precise than those obtained from optical data. Nevertheless, our spectral classification scheme is as follows:
-
•
WNLh: broad emission lines of Br , the 2.115m complex, C iv and N iii. The He i (2.056m) and He ii(2.189m) features have complex structures and/or P Cygni-type profiles. Emission from C iv is either absent or very weak.
-
•
O hypergiant (OIf): broad emission of Br but with low contrast to the continuum; 2.115m complex and C iv in emission; He i (2.056m, 2.112m) and He ii (2.189m) in absorption.
-
•
O-type: broad Br in absorption, though for supergiants it may be in emission. C iv emission and He ii (2.189m) absorption is seen in spectral types no later than O7 and O8 respectively. He i (2.112m) is in absorption with the He i 2.113m multiplet in emission for types later than O8. He i (2.056m) is heavily dependent on the wind properties and may be in either emission or absorption.
-
•
late O-/early B-type: Br , He i (2.112m) and He i (2.162m) in absorption. Absence of C iv in spectral-types later than O8, and no He ii types later than O9. The He i (2.112m) feature is absent in spectral-types later than B5, while He i (2.056m) is not seen beyond B3 – though we note again that this line is very sensitive to wind density.
The other spectra which do not fall into these categories are easily classifiable: D2-3 has the broad C iv and 2.115m emission lines of a WC7/WC8 star (see Fig. 4, centre panel), and has been previously identified by Mauerhan et al. (2009, classified by those authors as WC8); while D2-2 has the spectral features of a late F-type star but without the dense molecular absorption of an early G-type star (Fig. 4, bottom panel). The near-IR colour of this star suggests that it may be a foreground star.
The spectral types attributed to each star, along with their coordinates and photometry, are listed in Table 2. In Danks 1, we found three stars with spectral features attributable to H-rich WR stars (type WNLh), stars D1-1, D1-2 and D1-5222Mauerhan et al. (2011) also detected D1-1 and D1-5. They classified D1-5 as WN9h, consistent with our classification of WNLh. However, D1-5 was classified as WN9, whereas our high signal-to-noise spectrum detected weak emission from Br and so was classified WNLh.. Stars D1-4 and D1-6 have strong C iv in emission as well as very broad Br emission, while He i (2.112m) is in absorption. These stars are assigned spectral types O6-8If333We note that Martins et al. (2008) assigned types of O4-6If+ for stars with similar spectral appearance in the -band. This is representitive of the uncertainty when classifying hot stars in this spectral window.. Stars D1-7, D1-8, D1-9 have weak C iv and He ii, with no He i (2.112m), and are classified as O4-6. D1-10 is similar to these stars except that He i (2.112m) is in absorption, implying a slightly later spectral type of O6-8. Stars D1-11 and D1-12 have no He ii and weak He i 2.112m, and are classified as O8-B3. The width of the absorption lines in the spectra of D1-10, D1-11 and D1-12 mean that they are likely to have luminosity classes of v-iii. Star D1-3 has very narrow absorption lines of Br and He i (2.112,2.162m) while He i 2.056m is in emission, and so is considered to be a O8-B3 supergiant.
In Danks 2, aside from the WC and yellow star, we find 3 stars with very weak C iv emission, weak Br absorption and He i (2.112m) absorption (D2-5, D2-8, D2-9), which we classify as O6-8. A further three stars (D2-4, D2-6, D2-7) are spectroscopically similar, but have no C iv, and so have slightly later types of O8-9. The remaining stars (D2-1 and D2-7) are classified as O8-B3, with the former star having the narrower lines and He i 2.056m emission typical of a supergiant.
Finally, we remark that from analysis of the P fluxes of the stars in each field (see Sect. 3), it is unlikely that there are any further strong emission-line stars in either cluster, aside from those presented here.
| Star | Alt. ID | RA | DEC | Spec Type | ||||||||
|---|---|---|---|---|---|---|---|---|---|---|---|---|
| Danks 1 | ||||||||||||
| D1-1 | MDM 8 | 13h | 12m | 28.49s | -62° | 41′ | 43.46′′ | WNLh | 7.260† | 6.620 | 6.094 | 7.002 |
| D1-2 | - | 13 | 12 | 24.95 | -62 | 41 | 59.92 | WNLh | 8.158 | 7.460 | 6.941 | 7.752 |
| D1-3 | - | 13 | 12 | 23.69 | -62 | 42 | 0.99 | O8-B3I | 8.223 | 7.618 | 7.840 | 7.925 |
| D1-4 | - | 13 | 12 | 26.16 | -62 | 41 | 57.50 | O6-8If | 8.934 | 8.262 | 8.166 | 8.511 |
| D1-5 | MDM 7 | 13 | 12 | 28.47 | -62 | 41 | 50.72 | WNLh | 8.834 | 8.306 | 7.943 | 8.518 |
| D1-6 | - | 13 | 12 | 26.22 | -62 | 42 | 9.37 | O6-8If | 9.220 | 8.647 | 8.595 | 8.857 |
| D1-7 | - | 13 | 12 | 26.80 | -62 | 41 | 56.36 | O4-6 | 10.161 | 9.540 | 9.685 | 9.754 |
| D1-8 | - | 13 | 12 | 22.84 | -62 | 41 | 48.60 | O4-6 | 10.355 | 9.685 | 9.817 | 9.905 |
| D1-9 | - | 13 | 12 | 26.02 | -62 | 42 | 15.59 | O4-6 | 10.806 | 10.239 | 10.368 | 10.398 |
| D1-10 | - | 13 | 12 | 24.50 | -62 | 42 | 8.52 | O6-8 | 11.319 | 10.612 | 10.805 | 10.864 |
| D1-11 | - | 13 | 12 | 26.32 | -62 | 42 | 5.78 | O8-B3 | 11.804 | 11.255 | 11.431 | 11.455 |
| D1-12 | - | 13 | 12 | 25.62 | -62 | 42 | 5.13 | O8-B3 | 12.227 | 11.598 | 11.800 | 11.836 |
| Danks 2 | ||||||||||||
| D2-1 | - | 13 | 12 | 56.34 | -62 | 40 | 27.78 | O8-B3I | 7.750 | 6.810 | 7.027 | 7.124 |
| D2-2 | - | 13 | 12 | 59.90 | -62 | 40 | 39.71 | F8-G1 | 9.131 | 8.912 | 8.935 | 8.997 |
| D2-3 | - | 13 | 12 | 57.63 | -62 | 40 | 59.42 | WC7-8 | 9.911 | 9.146 | 8.392 | 9.443 |
| D2-4 | - | 13 | 12 | 56.20 | -62 | 40 | 51.11 | O8-9 | 10.108 | 9.537 | 9.616 | 9.783 |
| D2-5 | - | 13 | 12 | 54.48 | -62 | 41 | 4.60 | O6-8 | 10.001 | 9.605 | 9.625 | 9.717 |
| D2-6 | - | 13 | 12 | 58.22 | -62 | 40 | 36.64 | O8-9 | 10.125 | 9.631 | 9.740 | 9.813 |
| D2-7 | - | 13 | 12 | 58.56 | -62 | 40 | 54.84 | O8-9 | 10.185 | 9.669 | 9.755 | 9.871 |
| D2-8 | - | 13 | 12 | 54.37 | -62 | 40 | 45.48 | O6-8 | 10.333 | 9.830 | 9.967 | 10.034 |
| D2-9 | - | 13 | 12 | 57.38 | -62 | 40 | 1.43 | O6-8 | - | - | - | - |
| ID | Alt. ID | RA | DEC | Spec Type | Ref. | |||||||
|---|---|---|---|---|---|---|---|---|---|---|---|---|
| MDM 3 | - | 13h | 12m | 09.05s | -62° | 43′ | 26.7′′ | WN8-9 | 10.21 | 8.57 | 7.58 | 1 |
| S09 845-34 | MDM 4 | 13 | 12 | 21.30 | -62 | 40 | 12.5 | WC8 | 10.75 | 9.57 | 8.77 | 1,2 |
| MDM 5 | - | 13 | 12 | 25.46 | -62 | 44 | 41.7 | WN9 | 9.81 | 8.48 | 7.65 | 1 |
| S09 845-35 | MDM 6 | 13 | 12 | 27.66 | -62 | 44 | 22.0 | WC7 | 13.16 | 11.82 | 10.71 | 1,2 |
| WR48a | - | 13 | 12 | 39.65 | -62 | 42 | 55.8 | WC6 | 8.74 | 6.80 | 5.09 | 3 |
| S09 847-8 | - | 13 | 12 | 45.35 | -63 | 05 | 52.0 | WN6 | 13.06 | 11.34 | 10.26 | 2 |
| L05-A1 | - | 13 | 11 | 41.04 | -62 | 32 | 50.8 | O5-6 i | 11.75 | 10.39 | 9.58 | 4 |
| L05-A2 | - | 13 | 11 | 33.88 | -62 | 33 | 27.1 | B0-1 v | 12.31 | 11.02 | 10.34 | 4 |
| L05-A3 | - | 13 | 11 | 39.50 | -62 | 33 | 28.2 | B2-3 v | 14.06 | 12.65 | 11.97 | 4 |
| MSX305.4013+00.0170 | - | 13 | 13 | 02.04 | -62 | 45 | 03.3 | WCL | 6.59 | 5.00 | 3.95 | 5 |
3 Results & analysis
Our data have revealed a large number of massive stars within the two central clusters. These are in addition to the numerous and apparently isolated massive stars within G305 (Shara et al., 2009; Mauerhan et al., 2011). In Table 2 we list the astrometry, photometry and spectral types of these stars. For completeness, in Table 3 we list the other known massive stars in the vicinity of the two clusters.
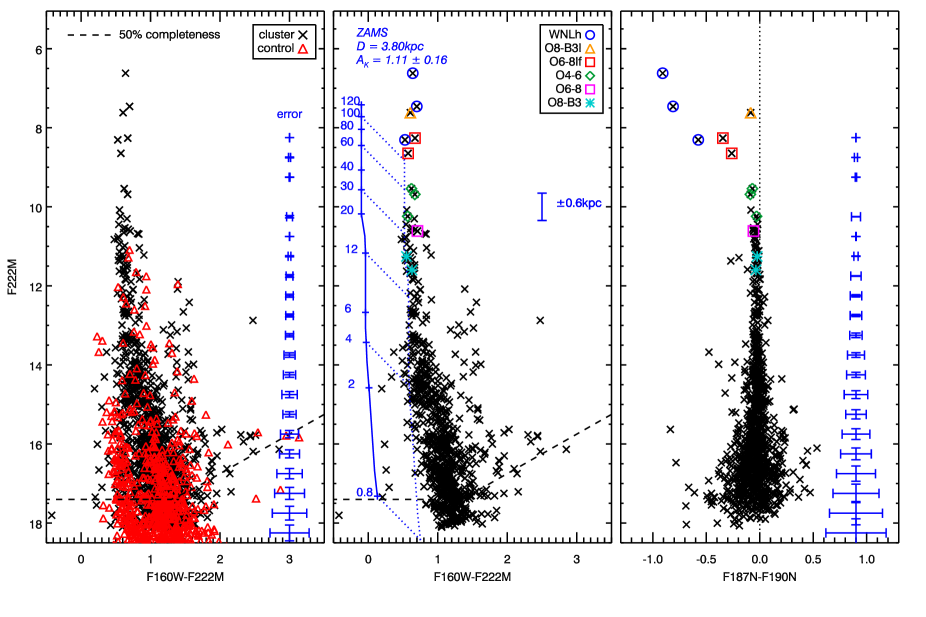
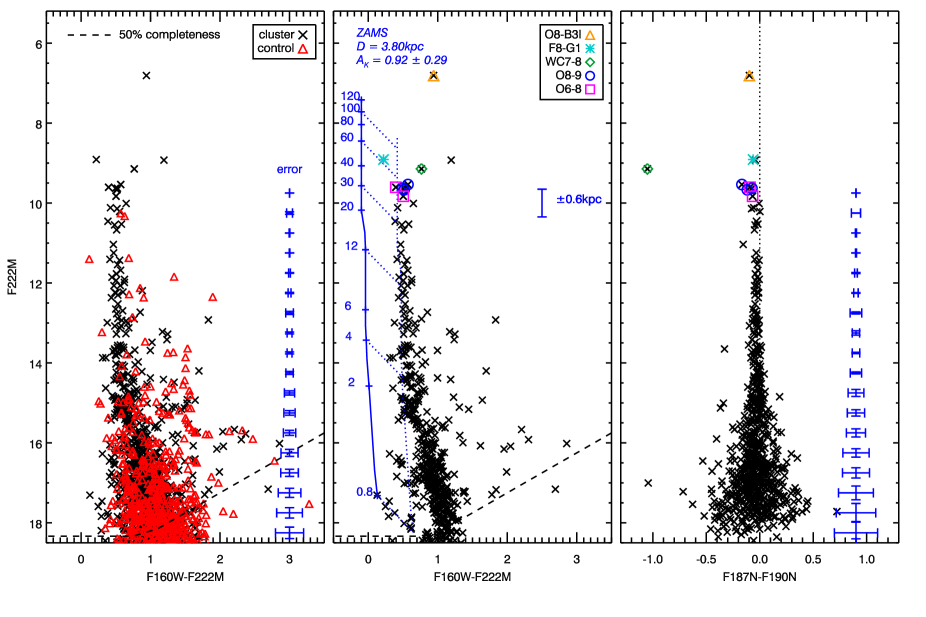
In Figs 5 and 6 we plot the results of the photometry for each cluster. In the left panel of each figure we show the colour-magnitude diagrams (CMDs) of the cluster and control fields. In the centre panel we have decontaminated the cluster field of foreground stars using the control field: for every star in the control field, we subtract a corresponding star in the cluster field with and within the photometric errors at that brightness. As the formal photometric errors can be very small for bright objects, we specify a minimum ‘errorbox’ of size mags, mags for the decontamination algorithm. In the centre panels we also illustrate the brightnesses and colours of zero-age main sequence (ZAMS) stars at the distances of the clusters (see Sect. 3.2 for discussion on cluster distances)444These ZAMS tracks were computed by first taking the masses, temperatures and luminosities of ZAMS stars from Meynet & Maeder (2000). The relation between spectral type and temperature was taken from Martins et al. (2005) for stars with masses 15M⊙ and Johnson (1966) for the rest. Infrared magnitudes and colours were taken from Martins & Plez (2006) and Koornneef (1983).. In the right-hand panel we show the photometry across P .
In the following sections we use the information in these plots, as well as the spectral types of the stars, to determine the physical properties of each cluster. In our analysis we will equate the NICMOS filters F160W and F222M with the photometric bands and respectively.
3.1 Extinction
The extinction towards each cluster is derived from the brightest stars in the decontaminated CMDs. The median F160W-F222M colour is obtained from all stars in each cluster with F222M magnitudes brighter than 13 whose locus is close to the ZAMS, since these stars show no evidence for circumstellar extinction. As the intrinsic F160W-F222M colours of hot stars are all approximately zero, we take the median colour as a colour excess, and convert it into an extinction using the law of Rieke & Lebofsky (1985). We find average line-of-sight extinctions for the two clusters of and for Danks 1 and Danks 2 respectively 555These extinctions were computed using a value of for the slope of the IR extinction law. If a slope of is used (Stead & Hoare, 2009), we find and for Danks 1 and Danks 2 respectively. . We adopt these values throughout the rest of this work.
3.2 Distances
In order to calculate the distance to the clusters, we employ two independent and complementary methods. We use various radial velocities measurements for the G305 complex to determine a kinematic distance, and the photometry of stars in each cluster to calculate spectro-photometric distances.
3.2.1 Kinematic distance to G305
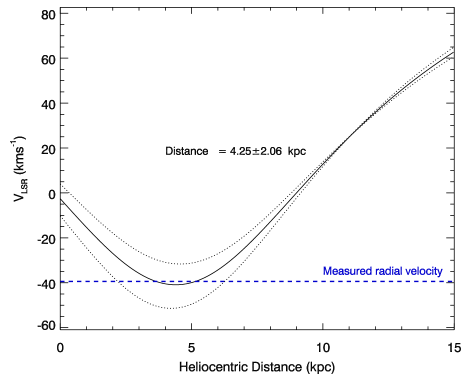
Many Hii-regions and young stellar objects (YSOs) are found in the dense molecular material surrounding the two clusters, and for many of these objects radial velocity measurements exist. A search of the RMS database (Hoare et al., 2005)666http://www.ast.leeds.ac.uk/RMS of YSOs in the region displayed in Fig. 1 yielded 15 objects with known radial velocities (Urquhart et al., 2007, 2009, and refs therein). The mean radial velocity and standard deviation is km s-1. In Fig. 7 we compare this value to the Galactic rotation curve in the direction of G305. We use the rotation curve of Brand & Blitz (1993), and the values for the Galacto-centric distance (7.60.3 kpc) and Solar angular velocity (2147 km s-1) compiled by Kothes & Dougherty (2007). It can be seen from the plot that the average G305 radial velocity is close to the tangential point. Once the uncertainties in the rotation curve are taken into account, we find a distance of 4.22.0 kpc.
3.2.2 Spectrophotometric distances of the two clusters
In calculating the spectrophotometric distances to each cluster, we begin by analysing those stars for which we are confident of the luminosity classes. As discussed in Sect. 2.2.3, the star D1-3 shows the clear spectral signatures of a O8-B3 supergiant. From Crowther et al. (2006), such stars have absolute -band magnitudes of , and so for this star we find a spectrophotometric distance to Danks 1 of kpc. Applying the same analysis to the star D2-1, another O8-B3 supergiant, we find a distance to Danks 2 of kpc. Both these distances are within the errors of one another, as well as being consistent with the kinematic distance derived in the previous section.
In Table LABEL:tab:specphot we list the spectrophotometric distances for the remaining stars in each cluster which do not display evidence for high luminosity classes (i.e. no Br emission, indicative of supergiants). Distances are calculated for each of the v, iii and i luminosity classes, based on the absolute -band magnitudes quoted in the ‘observational’ temperature scale of Martins & Plez (2006). By making the a priori assumption that the stars with similar spectral types have the same luminosity class we can assign luminosity classes that form a consistent picture of the distances to each cluster.
In Danks 1, consistent distances are found for all the ‘non-supergiants’ if we assign them to be class v objects, i.e. on or near the main sequence. A weighted mean of these distances gives kpc, where the uncertainty is the r.m.s. deviation on the mean. Again this is consistent with that derived from the supergiant in this cluster and the kinematic distance.
In the case of Danks 2, the O6-8 stars all have -band fluxes which are consistent with them being dwarfs, when taking into account both the kinematic distance and the spectrophotometric distance of D2-1. These stars have an average spectrophotometric distance of 3.40.2kpc, consistent with G305’s kinematic distance of 4.22.0 kpc. The O8-9 stars however appear to be too bright to be class v stars, and have probably evolved away from the main-sequence. There -band brightnesses are more typical of giants, though we consider the absolute brightnesses of class iii stars to be too uncertain to determine a reliable spectrophotometric distance.
Since the distances to the two clusters are within the errors of one another, and the distance of Danks 2 is constrained by only two measurements, for the rest of this paper we make the assumption that the two are at the same distance. This is a reasonable assumption to make, since if the size of the G305 cloud along the line-of-sight is comparable to its angular size, the maximum difference in distances between the two clusters is only 30pc. Taking the weighted average of the spectrophotometric distances for the dwarfs only, as well as the kinematic distance, we find a distance to the clusters of 3.80.6kpc.
| Star | Spec Type | DV/kpc | DIII/kpc | DI/kpc | |
|---|---|---|---|---|---|
| Danks 1 | |||||
| D1-7 | 9.511 | O4-O6 | 3.21 4.15 | 4.59 5.20 | 6.08 6.11 |
| D1-8 | 9.655 | O4-O6 | 3.43 4.44 | 4.91 5.56 | 6.50 6.53 |
| D1-9 | 10.212 | O4-O6 | 4.43 5.73 | 6.34 7.19 | 8.40 8.44 |
| D1-10 | 10.581 | O6-O8 | 4.06 5.25 | 6.58 7.52 | 9.96 9.96 |
| D1-11 | 11.229 | O9-B3 | 1.19 4.78 | – | 14.18 24.42 |
| D1-12 | 11.569 | O9-B3 | 1.39 5.60 | – | 16.59 28.56 |
| Danks 2 | |||||
| D2-4 | 9.510 | O8-O9 | 2.37 2.70 | 4.11 4.39 | 6.64 7.02 |
| D2-6 | 9.606 | O8-O9 | 2.47 2.83 | 4.30 4.58 | 6.94 7.33 |
| D2-7 | 9.644 | O8-O9 | 2.52 2.88 | 4.37 4.67 | 7.06 7.46 |
| D2-5 | 9.583 | O6-O8 | 2.80 3.62 | 4.53 5.18 | 6.86 6.87 |
| D2-8 | 9.805 | O6-O8 | 3.10 4.01 | 5.02 5.74 | 7.60 7.60 |
3.3 Stellar populations and cluster ages
The stellar populations of the two clusters – the presence of early-to-mid O dwarfs and supergiants – clearly indicate ages 6Myr. At these young ages it is not useful to simply fit model isochrones to the near-IR colour-magnitude diagrams, as there is a large degeneracy in age. Instead, we estimate ages for the two clusters by three methods: analysis of their stellar populations; examining the MS turn-offs; and also by studying the low-mass pre-MS population of each cluster.
3.3.1 Danks 1
In the previous section we argued that the O4-6 stars in Danks 1 were very likely on the main-sequence, whereas the stars which are slightly brighter (the O6-8If, WNLh and OBI stars) appear to be post-MS objects. From this information, we conclude that the MS turn-off corresponds to a spectral-type of O4-6. From Fig. 5, this implies a ZAMS mass of 6020M⊙ once the error in distance is taken into account (Meynet & Maeder, 2000; Martins et al., 2005)777We determine a scale of spectral-type versus mass using the mass-temperature scale defined by the stellar structure models of (Meynet & Maeder, 2000), and the spectral-type – temperature scale of Martins et al. (2005). . The MS lifetime for such stars is around 3-4Myr (Meynet & Maeder, 2000), which is therefore an upper limit to the age of Danks 1.
In the CMD of Fig. 5, a departure from the ZAMS is seen at magnitudes fainter than F222M15. This can be interpreted as the point at which lower mass stars in the cluster are beginning to arrive on the MS. From the implied mass at which stars are on the MS, we can get an independent measure of the cluster’s age. The brightness at which the stars are seen to join the MS corresponds to a mass of 41M⊙. From comparison with models of pre-MS evolution (e.g. Palla & Stahler, 1999; Siess et al., 2000), we find the age of the low-mass stellar population of Danks 1 to be 1-2Myr.
The most massive stars present in the cluster can also be used as an age discriminant, since the lifetime of a star is closely related to its initial mass. The most massive stars in Danks 1 are likely to be the three WNLh stars. Such stars are also present in the Arches cluster, where their initial masses have been found to be as high as 120M⊙ (Martins et al., 2008). Following Martins et al., we use their mean -band bolometric correction for WNLh stars, , as well as the average cluster extinction (Sect. 3.1) and distance modulus to G305 (Sect. 3.2). Using these numbers, we find that the luminosities of D1-1, D1-2 and D1-5 are = 6.5, 6.2, and 5.9 respectively (all 0.2dex). Clearly these three stars are all intrinsically luminous, and therefore very massive. While accurate spectrophotometric mass determinations await quantitative modelling of their spectra, we can tentatively say here that the masses of D1-1 and D1-2 are likely to be in excess of 90M⊙ (comparing with Geneva rotating models, Meynet & Maeder, 2000). This then places an upper limit to the age of the cluster of 3Myr.
To summarize, an age of 1.5Myr for Danks 1 is consistent with all pieces of evidence from both the high mass stars and the low mass pre-MS stars. While it has been found that these two age indicators can give contradictory results (e.g. Westerlund 1, Brandner et al., 2008), and that pre-MS isochrones may give ages which are systematically younger than those indicated by MS stars (Naylor, 2009), we find no evidence for such a discrepancy here.
Finally, we mention a star in Danks 1 that does not seem to fit with our derived age for the cluster. The star D1-3 has the appearance of a ‘normal’ blue supergiant, with narrow absorption lines, and the absence of significant line emission implies a relatively weak wind. It is therefore natural to conclude that this star is one of moderate initial mass, say 20-40M⊙, in an advanced evolutionary state. This would imply an age of 4-10Myr, which is clearly at odds with the other evidence from the cluster. This suggests that D1-2 was not born with the rest of the stars in Danks 1, and is instead part of a population of older stars which includes the other evolved massive stars seen in the field of G305 (see Table 3). It is possible that these stars formed along with the older Danks 2 (see next section) and were dynamically ejected. For a projected cluster separation of 40pc, if the star was ejected from Danks 2 3Myr ago then this implies a runaway velocity of 15 km s-1, which is certainly not unreasonable.
3.3.2 Danks 2
Using the same diagnostics of the cluster age, the evidence suggests that Danks 2 is somewhat older than Danks 1. The earliest spectral type MS stars are O6-8, consistent with masses of 30-40M⊙ and hence an upper limit to the age of 4-6Myr. The point at which the pre-MS stars join the MS is at a lower mass than in Danks 1 – 2M⊙, indicating an age of 3Myr with upper and lower limits of 2-10Myr due to the uncertainty in distance.
The most luminous stars in Danks 2 can again be used as an age indicator, though the results are less conclusive than in Danks 1. In particular, carbon-rich WR stars should be present in clusters with ages between 3-6Myr, according to rotating Geneva models (Meynet & Maeder, 2000). The yellow star, D2-2, lies to the left of the ZAMS track in the colour-magnitude diagram of Fig. 6, suggestive that the star does not belong to the cluster.
Our inability to determine a precise spectral type for the OB supergiant D2-1, the brightest star in Danks 2 in the near-IR, means that it places only weak constraints on the cluster age. The -band bolometric correction of a O8-B3 supergiant is , according to Martins & Plez (2006) and Crowther et al. (2006), which implies a bolometric luminosity of for the coolest and hottest temperatures respectively. A luminosity for D2-1 closer to the lower limit seems more likely, since more luminous stars do not tend to have the spectroscopic appearance of ‘normal’ blue supergiants, and instead have strong emission lines owing to their dense winds.
From the above evidence, we suggest that the age of Danks 2 is 3Myr. The error is dominated by the uncertainty on the cluster’s heliocentric distance. However, we can be certain that the two clusters are at the same distance, within a few percent. Therefore, it seems very likely that Danks 2 is the older of the two clusters, being created 1.5Myr before Danks 1.
3.4 Initial mass functions
In order to construct initial mass functions (IMFs) for the two clusters, we must first create luminosity functions (LFs) which are decontaminated of foreground stars. We experimented with two methods of doing this. In the first method, we contructed LFs for both the cluster and control fields, then subtracted one from the other once completeness effects had been taken into account. Secondly, we used the F222M magnitudes of the stars in the field-corrected colour-magnitude diagrams of Figs. 5 and 6. The completeness corrections applied to these LFs were those of the cluster fields, as these completeness limits are typically higher than those of the control fields. In any event, the limit down to which we chose to measure the IMFs is well above the point at which the photometry becomes incomplete (see below). We also experimented with de-reddening the stars in the decontaminated LF back onto the ZAMS track, under the assumption that stars lying slightly to the right of the track are cluster stars with extra local extinction. Any stars which had (F160W-F222M) excesses greater than 0.6mags were discarded, as these most likely belong to a separate background population, though we note that without spectra we cannot completely rule out that these objects are local to the clusters.
To convert the LFs to IMFs, we use the evolutionary models of the Geneva group. The latest versions of these take into account stellar rotation (e.g. Meynet & Maeder, 2000), but computations do not exist for stars with masses below 9M⊙, since rotation does not have a large impact on intermediate to low mass stars. For this reason we splined together the rotating models with the older non-rotating models of (Schaller et al., 1992) at 9M⊙. As a check on the robustness of our results, we also experimented with the older non-rotating models with higher/lower metallicities, and varying mass-loss rates. Instrumental magnitudes and colours were determined the same way as in Sect. 3.3.
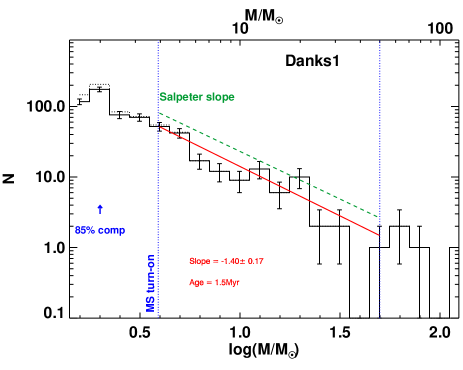
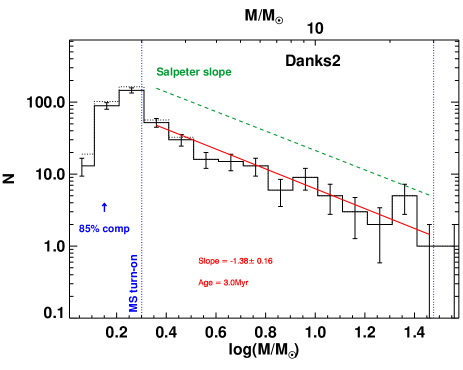
In Fig. 8 we show the IMFs for the two clusters, derived using the colour-magnitude corrected LFs, and using Solar-metallicity isochrones including rotation at the ages indicated in each panel. In each case, we measure the slope of the IMF only in the mass ranges where we are sure that stars are on the main-sequence. The low mass stars which have not yet reached the MS will have colours and magnitudes which are systematically different from those predicted by main-sequence evolution codes; while the post-MS behaviour of high-mass stars is extremely uncertain. The pre-MS mass limit is measured from the kink in the CMD seen in both cluster sequences at . The post-MS mass is determined from the point at which the stellar spectrophotometric distances are no longer consistent with luminosity class V stars. In practise, the upper limit for the range in which we measure the IMF (dotted blue lines in Fig. 8) is set by the point at which the number of stars per bin drops below 2, where the uncertainties become non-poissonian.
In each cluster we see slopes that are consistent with the Salpeter value of . Danks 1 has a slope , while Danks 2 has a slope . These measurements are robust to the type of evolutionary model used in the isochrones; the effect of varying mass-loss rate, stellar rotation and metallicity is small compared to the uncertainty. Varying the cluster age within the measured uncertainties has little impact, since we measure the slope of the IMF only for objects on the MS where stellar properties change very little over 106yrs. Finally, varying the cluster distances between the upper and lower limits (3.2-4.4kpc) produces changes in the slope which are small compared to the uncertainties. We can therefore say that we find no significant evidence for variations in IMF between the two clusters in G305, and no significant deviation from the Salpeter slope.
If, as we have argued in Sect. 3.3, Danks 1 is in a pre-supernova (SN) state, the IMF of this cluster may be used to investigate the upper end of the IMF. Observations of the Arches cluster have indicated that there may be an upper mass limit of 150M⊙ (Figer, 2005), though observations of R136 in the Large Magellanic Cloud suggest that stars may form with masses greater than this (Crowther et al., 2010). Quantitative spectral modelling of the brightest stars in Danks 1 would yield accurate bolometric luminosities, and, by comparing to evolutionary models, initial masses. It would then be possible to discuss these objects in the context of the high-mass end of the IMF.
3.5 Cluster masses
In order to determine the initial masses of the two clusters, we simply fit the observed IMFs measured in the previous section with a functional form. Since all functional forms of the IMF have a slope which is approximately Salpeter-like in the mass-range appropriate to our measurements, we simply scale the functional IMF to fit our observations and then integrate over all stellar masses.
Fitting a Kroupa IMF to our observations (Kroupa, 2001), we find that the initial masses of Danks 1 and Danks 2 are 80001500M⊙ and 3000800M⊙ respectively. The uncertainties are due to a combination of errors carried forward from cluster age and distance, as well as a stochastic error due to low number statistics at the high-mass end.
We note that the Kroupa IMF puts a large amount of mass into stars with sub-Solar masses, going all the way down to 0.01M⊙. If we were to use, for example, a Chabrier IMF (Chabrier, 2003), we would find that the inferred cluster masses would be approximately a factor of two lower.
| Cluster | Age (Myr) | (M⊙) | R0.5 (pc) | M⊙ pc-3) |
|---|---|---|---|---|
| Danks 1 | 1.5 | 80001500 | 0.170.05 | 5.5 |
| Danks 2 | 3.0 | 3000800 | 0.360.09 | 4.2 |
3.6 Cluster sizes and densities
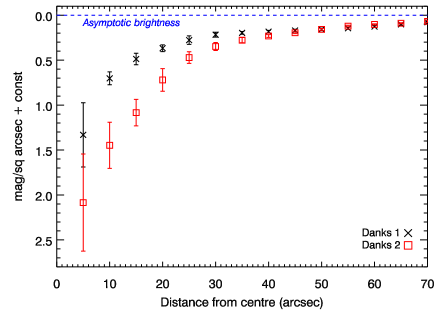
We determined the half-light radius of each cluster by measuring the cumulative surface brightness profiles (SBPs) as a function of distance from the cluster centre. Since our NICMOS observations have a field-of-view too small to determine at which radius the SBPs fall to the ambient level, we used 2MASS images to make these measurements. We defined the cluster centre as the centre of the NICMOS fields-of-view, but since the cluster centre is not easily defined we repeated the measurements with the centre offset in RA and DEC by 3′′.
The cumulative SBPs of the two clusters are shown in Fig. 9. The error bars on each point represent the effect of varying the position defined as the cluster centre. The half-light radii of the clusters are given in Table 5, where the errors on these values take into account both the error on and the uncertainty in distance. Also summarized in Table 5 are the cluster densities, ages and intergrated masses.
4 Discussion
Our photometric and spectroscopic analysis of Danks 1 & 2 reveal that they are both rather massive, young and compact, with a total mass of M⊙, and both forming over a short interval of 2 Myr. In the following section we discuss how these clusters – and by extention the G305 complex – compare to other Galactic and extra-galactic star-forming regions.
4.1 Cluster comparison
With a mass of 8000 M⊙, an age of 1.5 Myr and a stellar population containing both WNLh and early-mid O-type supergiants, Danks 1 closely resembles a number of other massive young clusters which are also associated with Giant H ii regions. These include Trumpler 14 (located within the Carina nebula; Smith et al., 2006) and NGC 3603 (Harayama et al., 2008), as well as the Arches cluster (Figer et al., 2002), which, given its location within the central 50 pc of the Galaxy, cannot be uniquely associated with a natal birthcloud.
By comparison, Danks 2 is both older, less massive and less dense than the above clusters. Its mass and stellar population (and hence age) are reminiscent of NGC 6231 at the centre of Sco OB1 (Sung et al., 1998), or Cl 1806-20 (Figer, 2005; Bibby et al., 2008), though the latter cluster does not have any obvious associated GMC.
The difference in densities between Danks 1 and Danks 2 may be related to the dynamical evolution of young massive star clusters. The Central Cluster aside, Danks 1, the Arches, and NGC 3603 all have ages which are thought to be below 3Myr, and so all may be yet to experience a SN of a cluster member. The removal of mass from the cluster by SNe may leave the cluster super-virial, causing it to expand (Hills, 1980; Goodwin & Bastian, 2006). If Danks 2 has already experienced SNe, this may explain the difference in central density between the two clusters.
4.2 Cluster complex comparison
If Danks 1 closely resembles both Trumpler 14 and NGC3603, one might also ask whether the properties of the associated star forming regions are also comparable? At this point it is instructive to extend this comparison to 30 Doradus and its central cluster R136 in the Large Magellanic Cloud, the most luminous Giant H ii region in the Local Group.
4.2.1 Multiple stellar populations
The evidence presented here suggests that star formation activity within the G305 commenced within the last 6 Myr. Following identical arguments to those advanced for the W51 complex by Clark et al. (2009a), the apparent lack of luminous Red Supergiants (RSGs) within the complex - which would clearly be visible at IR wavelengths - is consistent with the picture that star formation was absent beyond 6 Myr ago.
At least two further populations of massive (post-)MS stars are present within G305, with significant evidence for more recent and ongoing massive star formation. Leistra et al. (2005) find a mid-O supergiant and two late-O/early-B main sequence objects located within the cluster they designate as G305+00.2. Found within a small bubble on the periphery of the complex, Hindson et al. (in prep.) suggest an age of 1 Myr for the compact H ii regions associated with it.
Finally, a substantial diffuse population of massive stars appears to be present, with Shara et al. (2009) and Mauerhan et al. (2011) discovering additional WRs within the confines of the complex in addition to the members of Danks 1 & 2, WR 48a and the candidate dusty WCL MSX305.4013+00.0170 (Table 3). Indeed this WR population is significantly larger than that found within both Danks 1 & 2 combined, while the presence of four WC stars implies a minimum age of at least 3 Myr for this diffuse stellar component.
The NGC3603 and 30 Dor and Carina star forming regions also all appear to host multiple stellar populations. Dominated by the young massive cluster NGC 3603 (1-2 Myr), the presence of the blue supergiants Sher 23 & 25 reveals an older (4 Myr) population (Melena et al., 2008). (Walborn & Blades, 1997) likewise report a number of different stellar groups within 30 Dor; (i) the central cluster R136 (2-3 Myr), (ii) an older (4-6 Myr) population distributed across the region, (iii) Hodge 301; a 10 Myr cluster to the NW of R136 (iv) the R143 association in the south-east (6-7 Myr) and (v) a very young (1 Myr) population on the periphery of the complex, which we return to below. Lastly, Smith et al. (2006) summarise the properties of Carina, again reporting a range of ages for the clusters located within it (Tr14 at 1-1.5 Myr, Tr15 at 63 Myr, Tr16 at 2-3 Myr, Bo10 at 7 Myr and Bo11 at 3 Myr). Smith et al. (2006) also comments on the fact that in contrast to the previous examples, these populations are rather widely distributed over the complex. While the richest clusters (Tr14 & 16) are centrally located the remainder are observed at significant distances (10 pc)in the outer regions of the complex. An age spread amongst the stellar populations within the W51 complex is also apparent (Clark et al., 2009a), although in this case there is no evidence for a compact central cluster, with star formation apparently distributed throughout the host GMC.
4.2.2 Ongoing star formation in cluster complexes
As reported by Clark & Porter (2004), Clark et al. (2011) and Hindson et al. (2010), there is compelling evidence for a further generation of massive stars forming with the G305 complex. Methanol masers and ultracompact (UC-)H ii regions, both unambiguous indicators of ongoing massive star formation, are present within G305, being predominantly located on the periphery of the bubble. Integrated IR- and radio-fluxes likewise argue for the presence of a significant population of embedded massive YSOs, while sub-mm observations reveal the presence of a substantial reservoir (6105 M⊙) of cold molecular gas available to fuel future activity.
The star forming complex associated with NGC 3603 also shares these properties, with Nürnberger & Stanke (2003) describing the presence of methanol massers, dusty embedded sources and molecular cores within the confines of the remnant natal GMC. Both IR- and radio-fluxes are likewise comparable to those of G305 to within a factor of a few (e.g. Crowther & Conti, 2003). A comparable morphology is also observed for 30 Dor, with active star formation located on the periphery of the cavity surrounding R136 (Walborn & Blades, 1997; Walborn et al., 2002). Finally, while such spatial segregation between pre- and (post-)Main Sequence stars is less apparent within Carina, the presence of ucH ii regions (Brooks et al., 2001) points to onoing massive stars formation, particularly in the ‘Southern Pillars’ region of the complex (Rathborne et al., 2004). Moreover, both integrated IR- & radio-fluxes are directly comparable to those of G305, as is the mass of cold molecular material (Smith & Brooks, 2007).
In all four cases it has been suggested that the complex morphologies reflect the propogation of triggered star formation through the molecular cloud. This impression is particularly strong for G305, where the active star forming regions appear restricted to the periphery of the cavity, and indeed with a ‘third generation’ of masers and ucH ii regions associated with the bubble surrounding the cluster G305+00.2 (Clark & Porter, 2004; Hindson et al., 2010). While such morphologies are necessary, they are not considered sufficient evidence for triggered star formation since it might be supposed that the radiation- or wind blown-bubble is simply uncovering exisiting activity. In this regard our unbiased multiwavelength datasets, encompassing the whole G305 complex (Clark et al., 2011) will be particularly valuable in distinguishing between these possibilities via the identification of (massive) YSOs. If star formation was sequential, one would expect to find YSOs interior to the cavity but none outside, whereas they should be distributed throughout the GMC if this was not the case (cf. Smith et al., 2010). Indeed, our dataset will allow us to constrain not only the propagation of star formation through the GMC, but also the relative stellar yields of each successive generation, a particularly interesting prospect given that Smith et al. (2010) suggest that this decreases with time (and successive generations) in Carina.
Despite having a comparable cloud mass (Parsons et al., accepted with minor revision) and massive star formation having been underway for several million years (cf. radio- and IR-fluxes similar to the above regions; Conti & Crowther, 2004), it is interesting that the W51 complex appears not to host such triggered star formation. Instead, multiple, causally unconnected, star forming regions are found throughout the cloud, albeit possibly synchronised by the presence of an external agent such as the passage of a Galactic spiral density wave (Clark et al., 2009a; Kumar et al., 2004). Nevertheless, the physical endpoint in terms of the production of multiple young massive clusters with an age range of years appears remarkably similar to the above complexes.
4.3 A template for star formation
Irrespective of the mechanism of star formation (multiseeded versus triggered), these complexes present a template of how a 106-107M⊙ GMC is converted into stars. The process is distributed in both time and space, yielding a number of rather massive (103-104M⊙) clusters with a significant age spread over a region spanning an angular diameter of 30pc. Of immediate interest is the fact that the properties of both NGC 3603 and Danks 1, in terms of integrated mass, density, age and stellar content is directly comparable to that of the Arches. Clearly the production of such clusters is not dependent on the extreme conditions of the Galactic centre, although with 3 clusters of similar masses (a few 104M⊙; the Arches, Quintuplet and Galactic Centre) the star formation rate here appears to have been larger over the past few Myr than in the NGC 3603 and G305 complexes.
Globally, these giant star-forming regions are also of interest due to the fact that they mirror the structure of extragalactic star cluster complexes, albeit with cluster masses several orders of magnitude smaller. Indeed the integrated spectral energy distribution of Carina is remarkably similar to those of Ultraluminous IR Galaxies (Smith, 2007; Sanders & Mirabel, 1996), suggesting that a similar mode of star formation is also present in such galaxies. Because of this, determining the energy budget of Galactic examples such as Carina and G305 is important since it will permit a calibration of the star formation rate from the emergent flux.
While an accurate determination of the energy budget of G305 requires both accurate stellar parameters and the mid-far IR flux (Clark et al. in prep.), we simply note here that the current feedback from Danks 1 & 2 is likely to be dominated by the 3 WNLh stars. Utilising the Lyman flux estimates for similar WNLh stars in the Arches cluster scaled to the luminosities of these objects (Martins et al., 2008), the amount of ionizing radiation emitted by the three WNLh stars in Danks 1 alone appears comparable to the total ionizing flux within the entire G305 region estimated by Clark & Porter (2004). This suggests that, as with Carina, G305 suffers significant photon leakage. Hence, estimating the stellar contents and star formation rates of such regions using either IR or radio fluxes alone may result in significant underestimates for all but the very youngest complexes, where feedback has yet to uncover embedded clusters.
4.4 Future evolution
Finally we turn to the long term evolution of the G305 complex. As stellar evolution drives mass loss, the long term survivability of the clusters (Danks 1 & 2 and G305+00.2) is somewhat uncertain (Goodwin & Bastian, 2006). If they do disperse rapidly, G305 will increasingly resemble a classical OB association, noting that the stars within such aggregates appear to have formed over a comparable period (e.g. Cyg OB2 & Sco OB1; Clark et al. submitted; Negueruela et al., 2008). However, at present Danks 1 & 2 appear to be tightly bound, with ratios of ages to crossing times of order 10, suggesting that they will survive as clusters for several million years (see Gieles & Portegies Zwart, 2011). In this case, an obvious point of comparison is the Perseus complex, which contains two distinct star clusters, and Persei, surrounded by a halo of stars of similar age. The complex has been recently studied in detail by Currie et al. (2010), finding remarkably similar ages and masses for the two clusters, 3700-4200M⊙888These authors assumed a Miller-Scalo IMF to determine the total masses of the populations in the Perseus complex. and 141Myr, and an age for the halo population which was only marginally younger, 13.51Myr.
A quantitative comparison with our results presented here show that this is somewhat different to what we see in G305. The age spread we find for Danks 1 and Danks 2 is small, 1-2 Myr, and will become more difficult to detect as the clusters approach the same age as and Persei. However, we would still expect to be able to detect a significant age difference between the central clusters and the surrounding halo of stars. It is clear that the remains of the G305 cloud is still forming stars today, implying an age difference of up to 5 Myr. Therefore we may still expect to detect a difference in the ages of the clusters and the surrounding halo when the clusters are well beyond 20 Myr old.
An alternative comparison might be with the association of RSG dominated clusters at the base of the Scutum Crux arm, which appear to have formed over an extended period between 12–20 Myr ago (Davies et al., 2008; Clark et al., 2009b). In particular, RSGC3 would appear to form a particularly good comparator, being surrounded by at least one further lower mass cluster and a number of isolated RSGs of similar ages and masses within a 30 pc radius (Clark et al., 2009b; Negueruela et al., 2011b). While currently separate, with a (projected) separation of only 4pc a combination of cluster expansion driven by stellar mass loss and dynamical interaction could lead to the effective merger of Danks 1 & 2, further emphasising the similarity between the 2 regions.
In the case of Danks 1& 2 if this were to occur before the RSG dominated phase (10 Myr) this would lead to a mixture of stellar spectral types not predicted by current evolutionary theory. A similar explanation has been proposed to explain the stellar population of the young (7Myr) massive cluster NGC 1569-A.The integrated spectrum displays features attributed both to Red Supergiants (RSGs) and WRs (Gonzalez Delgado et al., 1997; Hunter et al., 2000), which stellar population models struggle to produce simultaneously for a single instantaneous starburst. Analysis of the point-spread function and velocity dispersion has also indicated two distinct components to NGC 1569-A, now labelled A1 and A2 (de Marchi et al., 1997; Gilbert & Graham, 2002). Further, Maoz et al. (2001) found that the WR spectra signatures were confined to A2. The current understanding of NGC 1569-A1 and NGC 1569-A2 is that they have comparable masses of M⊙, but ages of 5Myr and 8Myr respectively; a comparable age spread to that found between Danks 1 and Danks 2, though the NGC 1569-A clusters are slightly older and orders of magnitude greater in mass.
5 Summary and future work
We have provided the first comprehensive study of the two central clusters of the G305 star-forming complex, Danks 1 and Danks 2. We determine a distance to the clusters and the host molecular cloud of 3.80.6kpc. This takes into account both the spectrophotometric and kinematic measurments, which are in agreement with each other. The total stellar masses of Danks 1 and Danks 2 are 80001500M⊙ and 3000800M⊙ respectively. Analysis of their initial mass functions (IMFs) shows that both are consistent with Salpeter. A further population of apparently isolated massive stars, predominantly comprising WRs, is also present within the confines of the complex.
From analysis of the stellar content and pre-main-sequence stars of the two clusters, we have been able to piece together the star-forming history of the G305 complex. Danks 2 is the oldest object in the complex, with an age of 3Myr. The younger age of Danks 1, 1.5Myr, is consistent with its formation being triggered by the feedback of Danks 2. It is likely that the combined winds from the two clusters are responsible for the evacuation of the complex’s central cavity, and perhaps are responsible for the considerable amount of star formation that has occurred in the last 0.5Myr around the periphery of the G305 cloud. The origin of the diffuse population of evolved massive stars is less clear, though the presence of both WN and WC stars is consistent with this population forming at a similar time to the two central clusters.
The masses and stellar content of the two clusters, combined with the significant numbers of Wolf-Rayet stars in close vicinity to the clusters, and the numerous massive protostars in the surrounding molecular cloud, make G305 one of the most bountiful regions for massive star formation known in the Galaxy, comparable to the Carina nebula. As such, the region represents the perfect template for calibrating unresolved observations of similar regions at extra-galactic distances.
In terms of work for the future, the high-quality spectra presented here will be modelled with stellar atmosphere codes. This will allow a quatitative estimate of the amount of feedback from the clusters, both in terms of the ionizing radiation and the mechanical energy from stellar winds. Also, it will provide an estimate of the bolometric luminosities for the most massive stars in the cluster, and the universality of the IMF up to the highest stellar masses.
Acknowledgments
We thank Fabrice Martins for supplying us with the spectra of stars in the Arches cluster. We also thank the anonymous referee whose comments and suggestions helped improve the paper. BD is supported by a fellowship from the Royal Astronomical Society. This work is in part based on observations made with the NASA/ESA Hubble Space Telescope, obtained at the Space Telescope Science Institute, which is operated by the Association of Universities for Research in Astronomy, Inc., under NASA contract NAS 5-26555. These observations are associated with program #11545. Support for program #11545 was provided by NASA through a grant from the Space Telescope Science Institute, which is operated by the Association of Universities for Research in Astronomy, Inc., under NASA contract NAS 5-26555. This work is in part based on observations collected at the European Organisation for Astronomical Research in the Southern Hemisphere, Chile, under programme number 077.C-0207(B). Financial support from the Spanish Ministerio de Ciencia e Innovación under projects AYA2008-06166-C03-02 and AYA2010-21697-C05-01 is acknowledged.
References
- Alves & Homeier (2003) Alves, J. & Homeier, N. 2003, ApJ, 589, L45
- Bastian et al. (2006) Bastian, N., Emsellem, E., Kissler-Patig, M., & Maraston, C. 2006, A&A, 445, 471
- Bastian et al. (2005) Bastian, N., Gieles, M., Efremov, Y. N., & Lamers, H. J. G. L. M. 2005, A&A, 443, 79
- Bibby et al. (2008) Bibby, J. L., Crowther, P. A., Furness, J. P., & Clark, J. S. 2008, MNRAS, 386, L23
- Bohannan & Crowther (1999) Bohannan, B. & Crowther, P. A. 1999, ApJ, 511, 374
- Bonanos et al. (2004) Bonanos, A. Z., Stanek, K. Z., Udalski, A., Wyrzykowski, L., Żebruń, K., Kubiak, M., Szymański, M. K., Szewczyk, O., Pietrzyński, G., & Soszyński, I. 2004, ApJ, 611, L33
- Brand & Blitz (1993) Brand, J. & Blitz, L. 1993, A&A, 275, 67
- Brandner et al. (2008) Brandner, W., Clark, J. S., Stolte, A., Waters, R., Negueruela, I., & Goodwin, S. P. 2008, A&A, 478, 137
- Brooks et al. (2001) Brooks, K. J., Storey, J. W. V., & Whiteoak, J. B. 2001, MNRAS, 327, 46
- Chabrier (2003) Chabrier, G. 2003, PASP, 115, 763
- Clark et al. (2009a) Clark, J. S., Davies, B., Najarro, F., MacKenty, J., Crowther, P. A., Messineo, M., & Thompson, M. A. 2009a, A&A, 504, 429
- Clark et al. (2011) Clark, J. S., Davies, B., & Thompson, M. A. 2011, Bulletin de la Societe Royale des Sciences de Liege, 80, 223
- Clark et al. (2009b) Clark, J. S., Negueruela, I., Davies, B., Larionov, V. M., Ritchie, B. W., Figer, D. F., Messineo, M., Crowther, P. A., & Arkharov, A. A. 2009b, A&A, 498, 109
- Clark & Porter (2004) Clark, J. S. & Porter, J. M. 2004, A&A, 427, 839
- Conti & Crowther (2004) Conti, P. S. & Crowther, P. A. 2004, MNRAS, 355, 899
- Crowther & Conti (2003) Crowther, P. A. & Conti, P. S. 2003, MNRAS, 343, 143
- Crowther et al. (2006) Crowther, P. A., Lennon, D. J., & Walborn, N. R. 2006, A&A, 446, 279
- Crowther et al. (2010) Crowther, P. A., Schnurr, O., Hirschi, R., Yusof, N., Parker, R. J., Goodwin, S. P., & Kassim, H. A. 2010, MNRAS, 408, 731
- Currie et al. (2010) Currie, T., Hernandez, J., Irwin, J., Kenyon, S. J., Tokarz, S., Balog, Z., Bragg, A., Berlind, P., & Calkins, M. 2010, ApJS, 186, 191
- Davies et al. (2007) Davies, B., Figer, D. F., Kudritzki, R.-P., MacKenty, J., Najarro, F., & Herrero, A. 2007, ApJ, 671, 781
- Davies et al. (2008) Davies, B., Figer, D. F., Law, C. J., Kudritzki, R.-P., Najarro, F., Herrero, A., & MacKenty, J. W. 2008, ApJ, 676, 1016
- Davies et al. (2010) Davies, B., Lumsden, S. L., Hoare, M. G., Oudmaijer, R. D., & de Wit, W. 2010, MNRAS, 402, 1504
- de Marchi et al. (1997) de Marchi, G., Clampin, M., Greggio, L., Leitherer, C., Nota, A., & Tosi, M. 1997, ApJ, 479, L27+
- Diolaiti et al. (2000) Diolaiti, E., Bendinelli, O., Bonaccini, D., Close, L., Currie, D., & Parmeggiani, G. 2000, A&AS, 147, 335
- Figer (2005) Figer, D. F. 2005, Nature, 434, 192
- Figer et al. (2006) Figer, D. F., MacKenty, J. W., Robberto, M., Smith, K., Najarro, F., Kudritzki, R. P., & Herrero, A. 2006, ApJ, 643, 1166
- Figer et al. (1997) Figer, D. F., McLean, I. S., & Najarro, F. 1997, ApJ, 486, 420
- Figer et al. (2002) Figer, D. F., Najarro, F., Gilmore, D., Morris, M., Kim, S. S., Serabyn, E., McLean, I. S., Gilbert, A. M., Graham, J. R., Larkin, J. E., Levenson, N. A., & Teplitz, H. I. 2002, ApJ, 581, 258
- Gieles & Portegies Zwart (2011) Gieles, M. & Portegies Zwart, S. F. 2011, MNRAS, 410, L6
- Gilbert & Graham (2002) Gilbert, A. M. & Graham, J. R. 2002, in IAU Symposium, Vol. 207, Extragalactic Star Clusters, ed. D. P. Geisler, E. K. Grebel, & D. Minniti, 471–+
- Gonzalez Delgado et al. (1997) Gonzalez Delgado, R. M., Leitherer, C., Heckman, T., & Cerviño, M. 1997, ApJ, 483, 705
- Goodwin & Bastian (2006) Goodwin, S. P. & Bastian, N. 2006, MNRAS, 373, 752
- Hanson et al. (1996) Hanson, M. M., Conti, P. S., & Rieke, M. J. 1996, ApJS, 107, 281
- Hanson et al. (2005) Hanson, M. M., Kudritzki, R.-P., Kenworthy, M. A., Puls, J., & Tokunaga, A. T. 2005, ApJS, 161, 154
- Harayama et al. (2008) Harayama, Y., Eisenhauer, F., & Martins, F. 2008, ApJ, 675, 1319
- Hills (1980) Hills, J. G. 1980, ApJ, 235, 986
- Hindson et al. (2010) Hindson, L., Thompson, M. A., Urquhart, J. S., Clark, J. S., & Davies, B. 2010, MNRAS, 408, 1438
- Hoare et al. (2005) Hoare, M. G., Lumsden, S. L., Oudmaijer, R. D., Urquhart, J. S., Busfield, A. L., Sheret, T. L., Clarke, A. J., Moore, T. J. T., Allsopp, J., Burton, M. G., Purcell, C. R., Jiang, Z., & Wang, M. 2005, in IAU Symposium, Vol. 227, Massive Star Birth: A Crossroads of Astrophysics, ed. R. Cesaroni, M. Felli, E. Churchwell, & M. Walmsley, 370–375
- Hunter et al. (2000) Hunter, D. A., O’Connell, R. W., Gallagher, J. S., & Smecker-Hane, T. A. 2000, AJ, 120, 2383
- Johnson (1966) Johnson, H. L. 1966, ARA&A, 4, 193
- Koornneef (1983) Koornneef, J. 1983, A&A, 128, 84
- Kothes & Dougherty (2007) Kothes, R. & Dougherty, S. M. 2007, ArXiv e-prints, 0704.3073
- Kroupa (2001) Kroupa, P. 2001, MNRAS, 322, 231
- Kumar et al. (2004) Kumar, M. S. N., Kamath, U. S., & Davis, C. J. 2004, MNRAS, 353, 1025
- Larsen (2004) Larsen, S. S. 2004, A&A, 416, 537
- Leistra et al. (2005) Leistra, A., Cotera, A. S., Liebert, J., & Burton, M. 2005, AJ, 130, 1719
- Maoz et al. (2001) Maoz, D., Ho, L. C., & Sternberg, A. 2001, ApJ, 554, L139
- Martins et al. (2008) Martins, F., Hillier, D. J., Paumard, T., Eisenhauer, F., Ott, T., & Genzel, R. 2008, A&A, 478, 219
- Martins & Plez (2006) Martins, F. & Plez, B. 2006, A&A, 457, 637
- Martins et al. (2005) Martins, F., Schaerer, D., & Hillier, D. J. 2005, A&A, 436, 1049
- Mauerhan et al. (2009) Mauerhan, J. C., van Dyk, S. D., & Morris, P. W. 2009, PASP, 121, 591
- Mauerhan et al. (2011) Mauerhan, J. C., Van Dyk, S. D., & Morris, P. W. 2011, ArXiv e-prints
- Melena et al. (2008) Melena, N. W., Massey, P., Morrell, N. I., & Zangari, A. M. 2008, AJ, 135, 878
- Meynet & Maeder (2000) Meynet, G. & Maeder, A. 2000, A&A, 361, 101
- Morris et al. (1996) Morris, P. W., Eenens, P. R. J., Hanson, M. M., Conti, P. S., & Blum, R. D. 1996, ApJ, 470, 597
- Naylor (2009) Naylor, T. 2009, MNRAS, 399, 432
- Negueruela et al. (2011a) Negueruela, I., González-Fernández, C., Marco, A., & Clark, J. S. 2011a, A&A, 528, A59+
- Negueruela et al. (2011b) —. 2011b, A&A, 528, A59+
- Negueruela et al. (2010) Negueruela, I., González-Fernández, C., Marco, A., Clark, J. S., & Martínez-Núñez, S. 2010, A&A, 513, A74+
- Negueruela et al. (2008) Negueruela, I., Marco, A., Herrero, A., & Clark, J. S. 2008, A&A, 487, 575
- Nürnberger & Stanke (2003) Nürnberger, D. E. A. & Stanke, T. 2003, A&A, 400, 223
- Palla & Stahler (1999) Palla, F. & Stahler, S. W. 1999, ApJ, 525, 772
- Rathborne et al. (2004) Rathborne, J. M., Brooks, K. J., Burton, M. G., Cohen, M., & Bontemps, S. 2004, A&A, 418, 563
- Rauw et al. (2005) Rauw, G., Crowther, P. A., De Becker, M., Gosset, E., Nazé, Y., Sana, H., van der Hucht, K. A., Vreux, J.-M., & Williams, P. M. 2005, A&A, 432, 985
- Rieke & Lebofsky (1985) Rieke, G. H. & Lebofsky, M. J. 1985, ApJ, 288, 618
- Sanders & Mirabel (1996) Sanders, D. B. & Mirabel, I. F. 1996, ARA&A, 34, 749
- Schaller et al. (1992) Schaller, G., Schaerer, D., Meynet, G., & Maeder, A. 1992, A&AS, 96, 269
- Schnurr et al. (2008) Schnurr, O., Casoli, J., Chené, A.-N., Moffat, A. F. J., & St-Louis, N. 2008, MNRAS, 389, L38
- Schnurr et al. (2009) Schnurr, O., Moffat, A. F. J., Villar-Sbaffi, A., St-Louis, N., & Morrell, N. I. 2009, MNRAS, 395, 823
- Shara et al. (2009) Shara, M. M., Moffat, A. F. J., Gerke, J., Zurek, D., Stanonik, K., Doyon, R., Artigau, E., Drissen, L., & Villar-Sbaffi, A. 2009, AJ, 138, 402
- Siess et al. (2000) Siess, L., Dufour, E., & Forestini, M. 2000, A&A, 358, 593
- Smith (2007) Smith, N. 2007, AJ, 133, 1034
- Smith & Brooks (2007) Smith, N. & Brooks, K. J. 2007, MNRAS, 379, 1279
- Smith et al. (2006) Smith, N., Brooks, K. J., Koribalski, B. S., & Bally, J. 2006, ApJ, 645, L41
- Smith et al. (2010) Smith, N., Povich, M. S., Whitney, B. A., Churchwell, E., Babler, B. L., Meade, M. R., Bally, J., Gehrz, R. D., Robitaille, T. P., & Stassun, K. G. 2010, MNRAS, 406, 952
- Stead & Hoare (2009) Stead, J. J. & Hoare, M. G. 2009, MNRAS, 400, 731
- Sung et al. (1998) Sung, H., Bessell, M. S., & Lee, S.-W. 1998, AJ, 115, 734
- Urquhart et al. (2007) Urquhart, J. S., Busfield, A. L., Hoare, M. G., Lumsden, S. L., Oudmaijer, R. D., Moore, T. J. T., Gibb, A. G., Purcell, C. R., Burton, M. G., & Marechal, L. J. L. 2007, A&A, 474, 891
- Urquhart et al. (2009) Urquhart, J. S., Hoare, M. G., Lumsden, S. L., Oudmaijer, R. D., Moore, T. J. T., Brook, P. R., Mottram, J. C., Davies, B., & Stead, J. J. 2009, A&A, 507, 795
- van der Hucht (2001) van der Hucht, K. A. 2001, New A Rev., 45, 135
- Walborn & Blades (1997) Walborn, N. R. & Blades, J. C. 1997, ApJS, 112, 457
- Walborn et al. (2002) Walborn, N. R., Maíz-Apellániz, J., & Barbá, R. H. 2002, AJ, 124, 1601
- Wallace & Hinkle (1997) Wallace, L. & Hinkle, K. 1997, ApJS, 111, 445
- Zapata et al. (2009) Zapata, L. A., Ho, P. T. P., Schilke, P., Rodríguez, L. F., Menten, K., Palau, A., & Garrod, R. T. 2009, ApJ, 698, 1422
- Zinnecker & Yorke (2007) Zinnecker, H. & Yorke, H. W. 2007, ARA&A, 45, 481