The effect of stellar evolution uncertainties on the rest-frame ultraviolet stellar lines of CIV and HeII in high-redshift Lyman-break galaxies
Abstract
Young, massive stars dominate the rest-frame ultraviolet spectra of star-forming galaxies. At high redshifts (), these rest-UV features are shifted into the observed-frame optical and a combination of gravitational lensing, deep spectroscopy and spectral stacking analysis allows the stellar population characteristics of these sources to be investigated. We use our stellar population synthesis code BPASS to fit two strong rest-UV spectral features in published Lyman-break galaxy spectra, taking into account the effects of binary evolution on the stellar spectrum. In particular, we consider the effects of quasi-homogeneous evolution (arising from the rotational mixing of rapidly-rotating stars), metallicity and the relative abundance of carbon and oxygen on the observed strengths of He II 1640Å and C IV 1548,1551Å spectral lines. We find that Lyman-break galaxy spectra at are best fit with moderately sub-solar metallicities, and with a depleted carbon-to-oxygen ratio. We also find that the spectra of the lowest metallicity sources are best fit with model spectra in which the HeII emission line is boosted by the inclusion of the effect of massive stars being spun-up during binary mass-transfer so these rapidly-rotating stars experiencing quasi-homogeneous evolution.
keywords:
galaxies: starburst – galaxies: stellar content – binaries: general – stars: evolution – stars: Wolf-Rayet1 Introduction
Massive stars dominate the light and kinematics of young and star-forming galaxies. They spend most of their lifetimes with effective temperatures greater than K, and hence most of their light is emitted in the ultraviolet (UV) region of the electromagnetic spectrum. It is difficult to observe emission in the far-UV (1000-2000 Å) from sources in the local Universe, due to absorption in the Earth’s atmosphere and the limitations of space-based instruments sensitive to this wavelength range. At redshifts above two this emission moves into the range of optical spectroscopy. The study of rest-frame UV spectral lines therefore become relatively straightforward and provides a direct insight into the massive stellar population of star-forming and ultraviolet-luminous galaxies.
However a problem arises from the extreme distance and consequent apparent faintness of galaxies at such redshifts. The low signal-to-noise obtained in observations of typical individual galaxies makes their line strength and stellar population properties difficult to determine with any degree of precision. One approach to circumventing this problem and characterising a galaxy population is to combine a number of spectra to obtain a single, mean composite spectrum. Studies of such stacked spectra, notably the composite constructed by Shapley et al. (2003) of rest-UV selected ‘Lyman-break galaxies’ (LBGs), allow the determination of absorption and emission line intensities that are not detectable in individual sources, while being limited to yielding information on a ‘typical’ source rather than any individual galaxy.
However, the analysis of Shapley et al. (2003) revealed problems with our understanding of the stellar populations in such systems. The standard stellar population models produced by Starburst99 (Leitherer et al., 1999) were not able to simultaneously reproduce the observed C IV 1548,1551Å stellar P-Cygni absorption feature and He II 1640Å stellar emission line. The shape and strength of these broad lines are determined primarily by the stellar content of a galaxy, in combination with a relatively narrow nebular component. Massive main-sequence OB stars dominate the C IV line (with a small contribution from highly stripped WC Wolf-Rayet stars), while the He II line emission primarily arises from evolved, hydrogen poor, Wolf-Rayet (WR) stars (with a small contribution from rare but luminous Of stars). Recently Brinchmann, Pettini & Charlot (2008) revised predictions for the He II line strengths expected from a stellar population by including updated Wolf-Rayet star line equivalent widths (EWs) in the Starburst99 population synthesis code. From this the authors were able to predict a He II EW that was in agreement with that observed in the Shapley et al. (2003) spectrum, suggesting that careful consideration of these massive stars and their evolutionary pathways is vital in the interpretation of these distant sources.
While the use of composite spectra is necessary to study the majority of distant sources, there are now a small but growing number of individual Lyman-break galaxies for which high signal-to-noise rest-UV spectra have been obtained. The majority of these observations are made possible by high magnification due to strong lensing by intervening material along the line of sight. They have highlighted a diversity in the population that is obscured by use of a composite, with some galaxies having extremely strong He II emission and others vanishingly weak, undetectable lines. This variety leads to a dilemma in its interpretation. While strong C IV lines indicate the presence of massive O stars, a weak He II line would suggest a surprising absence of WR stars in the same galaxies. This dichotomy suggests that a reexamination of the spectral synthesis predictions of these C IV and He II features is necessary.
Much work has been done over the past few years improving stellar population and spectral synthesis and quantifying the uncertainties of these models (e.g. Leitherer et al., 1999; Bruzual & Charlot, 2003; Le Borgne et al., 2004; Maraston, 2005; Bruzual, 2007; Conroy, Gunn & White, 2008; Conroy, White & Gunn, 2010; Conroy & Gunn, 2010). Our approach has been to consider the uncertainties inherent in the use of only single-star evolution models as the building blocks of synthesis codes. We have expanded our input stellar evolution models to take account of binary stars and the many new evolutionary paths ways this entails. In Eldridge & Stanway (2009) we showed that when recent single star stellar models are used to predict the He II line strength, the measured line equivalent width (EW) is very small, and that binary evolution models are a better match for the observed He II strength (and for other spectral WR population indicators) in star-forming galaxies.
Here we build on that work, and consider two uncertainties in the stellar evolution models in an effort to interpret both the Shapley et al. (2003) composite spectrum and those of individual lensed LBGs at . First, we investigate the effect of variation in the surface carbon abundance of OB stars on the derived stellar spectra. Erb et al. (2010) show that the amount of carbon in high redshift galaxies, as measured by nebular emission lines, decreases more rapidly than their [O/H]-derived metallicity at low abundances. Therefore we investigate the effect of decreasing the relative abundance of carbon on the C IV absorption line, in order to examine and model this trend.
Second, we further investigate the importance of duplicity in a synthesised stellar population when determining the He II line equivalent width, assuming both instantaneous burst and constant star-formation histories. We now include a new evolutionary process that may only be possible at low metallicities. Quasi-homogeneous evolution (QHE) occurs when a massive star rotates sufficiently rapidly that the star becomes fully mixed during its main-sequence lifetime (Maeder, 1987; Yoon & Langer, 2005; Meynet & Maeder, 2007). While it is difficult for a single star to be born rapidly rotating, efficient mass-transfer in massive binaries can spin up secondary stars to high rotation rates with ease (Cantiello et al., 2007). At Solar metallicities such stars are likely to spin down quickly due to strong stellar winds. However with the weakening of stellar winds at lower metallicities, efficient rotational mixing can occur. In this paper we model the effect of this unusual form of evolution on stars that accrete material during a mass-transfer event, and investigate the dramatic effect such stars would have on the integrated spectrum of a stellar population.
This paper is organised as follows. In Section 2 we discuss the modifications made to our Binary Population and Spectral Synthesis (BPASS) code in order to investigate the phenomena outlined above. In Section 3 we describe the effects of these phenomena on the strength of the diagnostic He II and C IV spectral features. In Section 4 we go on to compare our predicted spectra to a composite spectrum constructed from 900 Lyman-break galaxies by Shapley et al. (2003) and to various individual examples of Lyman-break galaxies. Finally, in Section 5 we briefly discuss our results and outline our conclusions.
2 Synthetic spectra of stellar populations
2.1 Binary Population and Spectral Synthesis (BPASS)
The synthetic spectra used in this paper are created using the Binary Population and Spectral Synthesis (BPASS) code111http://www.bpass.org.uk. It is described in detail in Eldridge, Izzard & Tout (2008), Eldridge & Stanway (2009) and Eldridge, Langer, & Tout (2011).
We use stellar models from the Cambridge STARS code (Eggleton, 1971; Eldridge, Izzard & Tout, 2008, and references therein), specifically those calculated in Eldridge, Izzard & Tout (2008). Their key feature is an extensive set of detailed binary star models (in addition to the detailed single star models) which are key to producing a realistic synthetic stellar population. We consider stellar models at five different metallicities: , 0.004, 0.008, 0.020 and 0.040 (where a metallicity of is conventionally considered Solar), with hydrogen mass fraction, , helium mass fraction, and a default metal distribution given by scaled-Solar abundances.
Given that stellar evolution is non-linear and binary evolution is even less predictable, we do not interpolate between models with different masses and initial binary parameters, but rather weight each stellar model by an initial mass function (IMF) and distribution of binary properties. Binary population fractions, pathways and mass loss rates are calculated as described in Eldridge, Izzard & Tout (2008) and Eldridge & Stanway (2009). The details of our binary interaction algorithm are relatively simple compared to the scheme outlined in, for example, Hurley, Tout & Pols (2002) and interactions depend primarily on the initial separation and stellar mass ratio. Our aim was to investigate the effect of enhanced mass loss due to binary interactions on stellar lifetimes and populations; therefore we concentrated on these aspects rather than incorporating additional physical processes, each of which would add more free parameters to our models and potentially associated uncertainties on those parameters or the mechanisms concerned.
2.2 Quasi-homogeneous evolution
We include one new evolutionary path, not in the standard picture of binary evolution for our secondary stars, first introduced into our population synthesis and described in detail in Eldridge, Langer, & Tout (2011). This path only occurs if the more massive primary star in a binary overfills is Roche Lobe and transfers mass to the secondary star. If this happens and the secondary has a metallicity mass fraction less than or equal to , a mass after accretion of more than 10 M⊙ and has accreted more than 5 percent of its initial mass, we assume it evolves fully mixed during its main-sequence lifetime (Petrovic, Langer & van der Hucht, 2005; Cantiello et al., 2007). This is referred to as quasi-homogeneous evolution and is the result of rapid rotation due to the accretion of material from the primary star as described by Yoon & Langer (2005) (see also Maeder, 1987; Meynet & Maeder, 2007; Yoon, Langer, & Norman, 2006; Cantiello et al., 2007).
In this case we use simple models in which we assume that stars meeting the criteria for QHE are fully mixed during their hydrogen burning evolution. They burn all their hydrogen to helium and increase in surface temperature as the burning progressing, evolving away from the zero-age main-sequence in the wrong direction. Once hydrogen burning ends this mixing also comes to an end. This evolution prescription is applied whether or not the binary remains bound after the primary supernova. The stars never grow to large radii, because the homogeneous evolution means the increasing molecular weight of the stellar material makes the stars shrink throughout their main-sequence evolution. Therefore QHE stars in a binary never fill their Roche lobe and interact with the other binary component. Other than this inclusion of mixing, the stars are treated identically to the non-QHE models with the same mass-loss rates applied.
2.3 Accounting for relative carbon abundance
In our standard models, and those of other population synthesis codes, Solar-scaled relative abundances are normally employed for a range metals. Variation in the relative abundance of different species is also possible - for example, an enhanced abundance of elements generated by the alpha process is characteristic of bursty, massive star formation. Recent studies modelling the interstellar medium in some high redshift galaxies have suggested that the important ratio of carbon to oxygen abundance decreases along with the total metallicity of the galaxies (see Erb et al., 2010, for example). These abundance variations must be considered in order to develop an accurate model for stellar population synthesis. However, adapting the synthetic stellar populations is far from straightforward. For a full analysis, the stellar models and atmosphere models should all be recreated with freely-varying relative abundances. This would be a challenging and time consuming task, as well as providing many additional free parameters which are likely to be unconstrained by the data. In this paper we outline a simple prescription for estimating the effect of varying carbon/oxygen ratios on the synthetic spectrum predicted by a stellar population in the UV.
In addition to variations in the initial carbon/oxygen ratios, the relative abundance of different elements in a stellar interior changes over time due to nuclear reactions. While these reactions occur at the core of the star, various processes can make nuclear-processed material observable at the surface of a star. For stars above a few Solar masses main-sequence hydrogen burning is catalysed by CNO elements. During this catalysis the rate determining step is a decay of 14N and so most of the initial CNO abundance ends up in this element. This abundance change is concentrated at the core of the star, but mass-loss of the outer layers and additional mixing (beyond that predicted by mixing-length theory) can draw the the processed core material to the surface thus changing the observable abundance. Typically this is observed as nitrogen enrichment and used to infer the importance of rotational mixing in stellar interiors (Hunter et al., 2007, 2009).
To take account of a possible decrease in initial abundances we have calculated WM-Basic (Pauldrach, Hoffmann, & Lennon, 2001) models of O stars and varied the carbon abundance of the models, decreasing the mass fraction of carbon by factors of 0.5, 0.1 and 0.01. We then measure the equivalent width of the ultraviolet C IV line as described by Crowther et al. (2006), and compare it to that measured at a standard Solar-scaled carbon abundance. The results are presented in Table 1. It is apparent that there is not a linear trend with metallicity, but rather that the greatest effect is seen when (i.e. significantly sub-Solar, but not at the lowest metallicity). Here even a small decrease in the carbon abundance decreases the C IV EW by a substantial fraction. At higher metallicities much more carbon must be removed before any great effect is seen. At the lowest metallicities there is already too little carbon in the atmosphere to produce a strong C IV line and so any further reduction has a minimal effect.
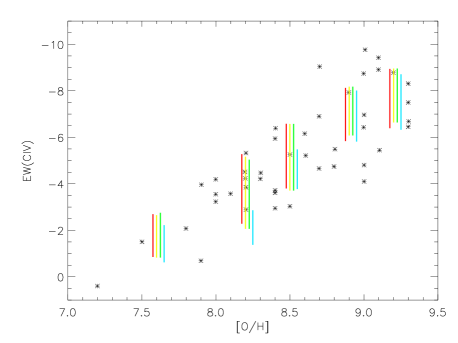
To include the effect of varying composition in our spectral synthesis we use the results in Table 1 to reduce the C IV EW in each model atmosphere according to its carbon abundance. We found the accounting for the decrease of the carbon abundance predicted by stellar models gave rise to only a tiny change in the C IV EW. Therefore we applied the maximum decrease in the carbon to oxygen ratio found by Erb et al. (2010) at so as to investigate the variation of the initial carbon/oxygen abundance ratio. We present two sets of models, one with normal Solar-scaled carbon abundances and a second with the carbon abundance decreased by a factor of four. We only perform this decrease for main-sequence OB stars when we use the OB model atmospheres of Smith, Norris & Crowther (2002). The result is general reduction in the strength of the C IV absorption line as measured by the equivalent width. As Figure 1 demonstrates this reduction can go to explain some of the scatter in the observed EWs of C IV in nearby galaxies, although the majority of the scatter is due to variations in their star formation history.
| EW(C IV, ) | EW(C IV, ) | EW(C IV, ) | |
|---|---|---|---|
| /EW(C IV, ) | /EW(C IV, ) | /EW(C IV, ) | |
| 0.001 | 0.828 | 0.692 | 0.608 |
| 0.004 | 0.798 | 0.254 | 0.100 |
| 0.008 | 0.931 | 0.592 | 0.129 |
| 0.020 | 0.960 | 0.833 | 0.295 |
2.4 Producing a total synthetic population spectrum
The procedure outlined above yields a synthetic spectrum appropriate to each time-step of a stellar evolution model. We can then combine the spectra for each star together to produce the integrated spectrum for a synthetic stellar population. To do this we use the initial mass function described by Kroupa (2002). This uses an IMF power-law slope of -1.3 between 0.1 and 0.5 M⊙, and a slope of -2.35 from 0.5 to 120 M⊙.
Finally in our spectral synthesis we include the contribution from nebular emission. In star-forming galaxies, interstellar gas is ionised by the stellar continuum emitted blueward of 912Å, and upon recombination it emits a nebular continuum. Neglecting this emission would lead to an incorrect estimate of the equivalent widths of emission lines and incorrect broad-band colours (Zackrisson, Bergvall & Leitet, 2008; Molla et al., 2009). We use the radiative transfer program Cloudy (Ferland et al., 1998) to produce a detailed model of the output nebular emission spectrum excited by our stellar spectra. The model output is sensitive to the chosen geometry, inner radius and composition of the gas used in the code. The details of our illustrative nebular emission model are identical to those in Eldridge & Stanway (2009), and we output the final continuum and line strengths for use in our synthetic spectra.
3 Predicted Equivalent Widths
We consider in this work the C IV and He II spectral lines, both of which exhibit a broad component whose strength is determined by the stellar spectrum. We have already shown in Figure 1 that model predictions for the C IV line agree with those deduced from observations. Conventional wisdom has been that the magnitude of He II line EW decreases in tandem with the equivalent width of C IV as shown by Brinchmann, Pettini & Charlot (2008). This is because it is assumed that at lower metallicity there are fewer WR stars with shorter lifetimes to contribute to the spectral features. However, as shown in Eldridge & Stanway (2009), the inclusion of binaries make this predicted relation less clear-cut.
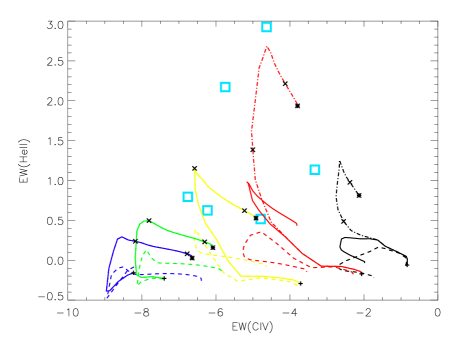
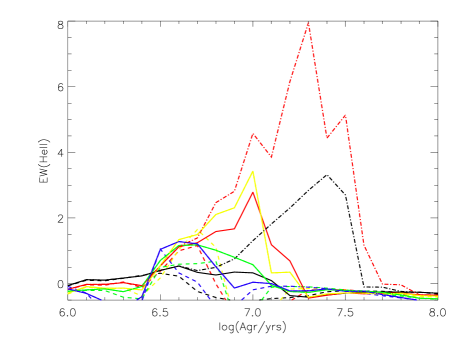
In Figure 2 we show how the C IV EW, which does decrease with metallicity, relates to the He II line strength for our different model populations. When only single star populations are considered, the strength of the He II line is largely independent of C IV line strength, and, surprisingly, peaks at around rather than at the highest (Solar and super-Solar) metallicity. This is because absorption lines in B star spectra decrease the apparent strength of He II at higher metallicity. Stellar populations including binaries reach higher EWs than the single star populations because of their greater number of WR stars (produced due to mass-transfer events in the binary systems). The highest EWs are only possible, however, when the effect of QHE is included in a binary population. The production of long lived hydrogen burning stars that are observed as WR stars boosts the line strength at the lowest metallicities.
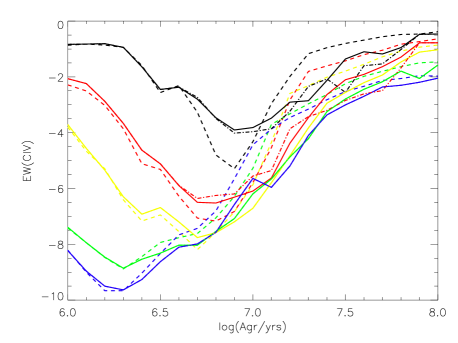
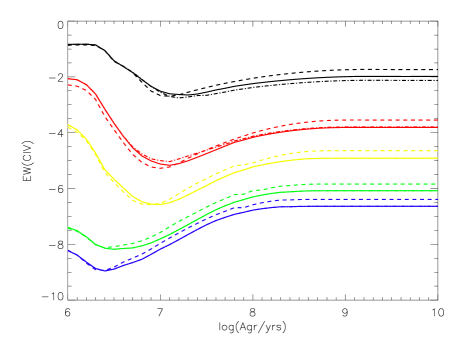
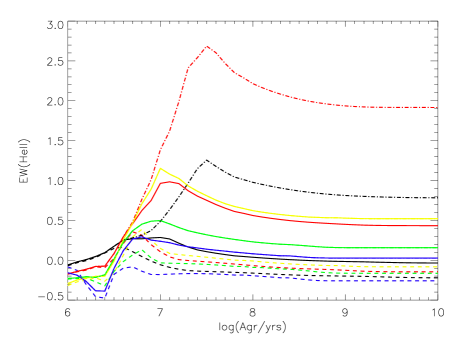
The same trends are evident in Figure 3. The highest He II EWs (i.e. strongest line emission) arise at later ages in QHE models than for the single star populations. This is because the additional WR stars produced from binary evolution and QHE are typically from lower mass stars that would not normally become WR stars and take of order 107 years to evolve to this state. Also in Figure 3 we show how both C IV and He II lines vary assuming an instantaneous burst of star formation. This model may be more appropriate at the highest redshifts () where the stellar populations appear to be short-lived, dramatic events with little fuel available for ongoing star formation (see Davies et al., 2010).
In this instantaneous star formation case, larger EWs are possible for He II than in the constant star formation model. This is only because there are no younger stars contributing to the continuum and reducing the relative significance of WR line flux in the equivalent width (i.e. line-to-continuum flux ratio). However the He II emission lines typically observed in Lyman-break galaxies with good spectroscopic data at do not require these extreme EWs, but remain in agreement with those predicted by our constant star formation models.
4 Applications to the rest-frame UV spectra of Lyman-Break Galaxies
4.1 Observations
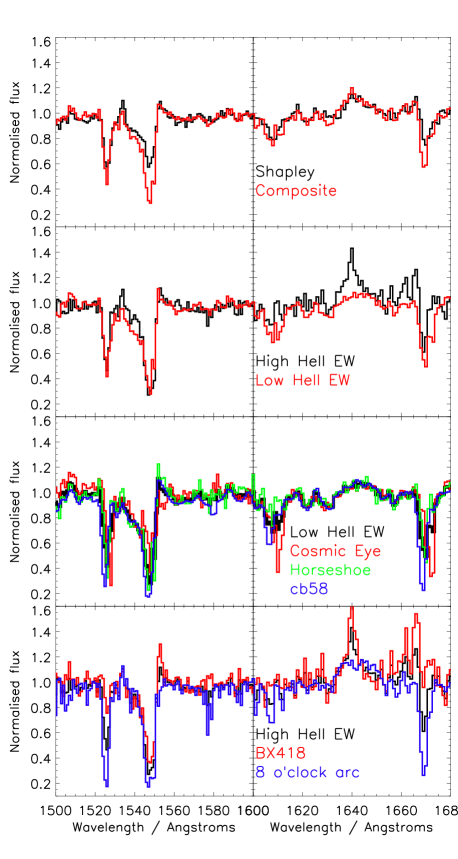
We have collated the spectra of five Lyman Break galaxies at for which high quality rest-UV spectroscopy has been published, four are gravitationally-lensed galaxies and the other spectrum is the result of a deep, 12 hour integration. The strong magnification of distant sources by the gravitational effects of intervening matter allows the study of individual galaxies, rather than the necessary blurring of any variation in a population through use of a composite. Before comparing these spectra to models it is useful to consider the spectra in comparison with each other and the earlier LBG composite of Shapley et al. (2003).
The data, in order of publication, comprise rest-frame ultraviolet spectra for MS 1512-cB58 (hereafter cB58, Pettini et al., 2002) at , the Cosmic Horseshoe (Belokurov et al., 2007; Quider et al., 2009) at , the 8 o’clock arc (Allam et al., 2007; Dessauges-Zavadsky et al., 2010) at , the Cosmic Eye (Quider et al., 2010) at and Q2343-BX418 (hereafter BX418, Erb et al., 2010) at . In Figure 4 we combine the normalised rest-frame ultraviolet spectra to form a composite of the lensed galaxies and compare it to the Lyman-break galaxy composite of Shapley et al. (2003). As the upper panels of the figure illustrate, there appears to be a remarkable qualitative agreement between our small composite and that based on individual galaxies at lower signal to noise. This suggests that, taken as a group, these Lyman-break galaxy examples are representative of the more numerous photometrically-selected sample. The primary difference between the two composites is that the C IV absorption feature (in both its broad stellar wind and narrow nebular components) is somewhat deeper in the lensed galaxies than, on average, in their unlensed counterparts.
However, even this small composite does not tell the whole story. When studying the C IV and He II profiles of the individual spectra it is apparent that the lensed sources form two loose groups that can be separated by the strength of their He II emission line. One set contains strong He II stellar emission with equivalent widths (EWs) of 2Å or more (Allam et al., 2007; Erb et al., 2010), while a second group presents only weak or absent He II emission (Pettini et al., 2002; Quider et al., 2009, 2010). We compare the mean spectra of these high and low He II EW sets in the second set of panels in Figure 4. Not only does the He II strength vary significantly between these two cases, but the C IV profile is also deeper in the weak-He II case, indicative of a higher carbon abundance.
In the final two sets of panels we show the individual spectra of the lensed galaxies. It is clear that the spectra of sources in the low He II EW category are remarkably uniform. There is very little difference between any of the observed spectra. The two sources with high He II EW spectra are also similar to one another and differ primarily in the strong (relatively narrow) nebular emission contributing to the He II line of the BX418 spectrum. Erb et al. (2010) fit a dual Gaussian model to the He II emission line in this source and estimate that 20 per cent of the line flux is contributed by nebular emission. Neglecting the nebular contribution, the two spectra have identical He II equivalent widths.
This qualitative comparison suggests that there may be evidence for two distinct classes of LBGs, separated by the strength of the broad He II stellar emission line. Furthermore, it would appear likely that both types of galaxies are represented within the photometrically-selected galaxy sample contributing to the Shapley et al. spectral stack.
4.2 Modelling observed galaxies
4.2.1 Shapley et al (2003) composite
Given the new elements in our stellar population synthesis code, it is informative to perform a direct comparison between the spectral features predicted by the refined BPASS models and those observed in the six Lyman-break galaxy spectra (five individual, one composite) described in Section 4.1. This comprehensive study enables us to gain further insight into both the accuracy of our models and the implied properties of the high-redshift galaxies themselves.
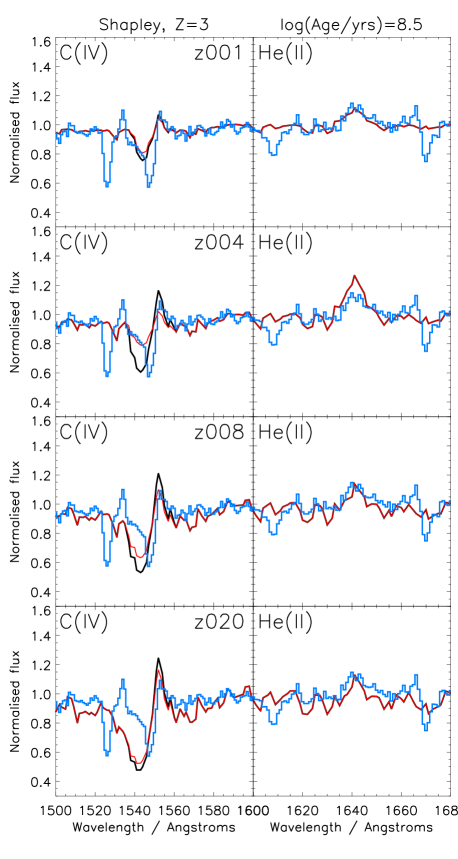
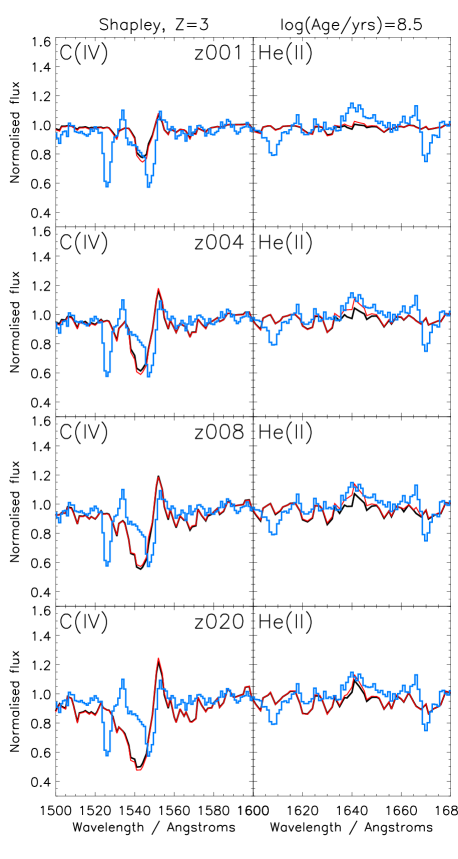
In Figure 5 we present a comparison between the composite spectrum of 900 LBGs with a mean redshift of three (Shapley et al., 2003) and our model spectra, taken log(age/yrs)=8.5 into an ongoing star formation episode (found to be the median age and star formation history of this sample by Shapley et al., 2001). In the original paper presenting this rest-UV composite, the authors found it difficult to simultaneously reproduce the line strengths of the C IV and He II line without resorting to models with extreme IMFs. Later Brinchmann, Pettini & Charlot (2008) was able to predict the required EW for the He II line but only at a lower metallicity than suggested by other measurements of the sample.
We see in Figure 5 that the C IV line in the LBG composite is relative weak compared to our Solar metallicity models. Only at sub-Solar metallicities (=0.001-0.004) can the models reproduce the broad component of the observed P-Cygni wind profile shape. However at the higher of these metallicities, the line profile can only be reproduced if the C/O ratio is a quarter of that in the standard Solar abundances. This is close to the depletion of this abundance ratio by a factor of 0.2 (relative to Solar) found by Shapley et al. (2003) for the nebular gas in this source. This implies that the stars we are observing likely formed from the same gas that still surrounds them at the epoch of observation.
For completeness, we compare the composite spectrum to our theoretical single star and non-QHE binary evolution models in Figure 6. There is little difference in the C IV line relative to the models incorporating QHE shown in Figure 5. However both our standard single star and earlier binary models have very weak He II lines compared to those spectra where we apply a prescription for QHE, and under-predict the observed line strength. This indicates that accounting for binary stellar evolution alone cannot entirely explain the observed He II profile, but rotation in binaries may play an important role in producing the observed spectra.
Because the spectrum analysed here is a composite of a number of different galaxies we can only attempt to determine a mean or range of metallicities. A qualitative analysis suggests an allowed metallicity range of for the ‘typical’ Lyman-break galaxy at . This corresponds to a (or where ), and is consistent with the previous measurements determined by Shapley et al. (2003) and Rix et al. (2004).
4.2.2 Individual galaxies
We address the spectra of the individual lensed galaxies compiled here starting with the sources with the lowest inferred metallicity, based on our model comparisons. In each case, we make the comparison at a constant log(age/years)=8.5 (age=320 Myr), based on the median star-formation derived age of the Lyman-break galaxy population as a whole. We note that, as figure 3 indicates, there is little evolution in the model strengths of our lines of interest at stellar population ages above 100 Myr.
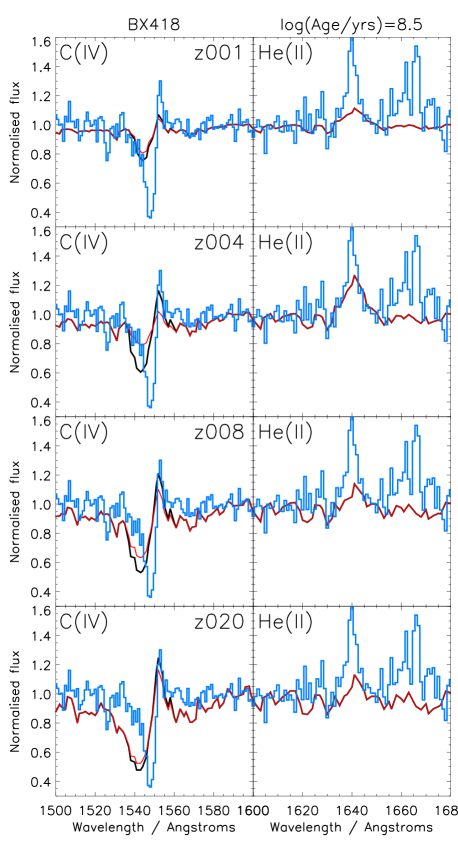
The UV spectrum of the galaxy BX418 from Erb et al. (2010) (shown in Figure 7) has a very weak C IV stellar wind line with a P Cygni profile and strong and broad He II emission. There is clearly a narrow nebular component superposed on the broader He II stellar emission line. This indicates a very hard ionising spectrum present within the galaxy. The He II line implies that the metallicity must be low, especially in carbon, suggesting a metallicity range of to (i.e. significantly sub-Solar). However the more prominent C IV profile implies a slightly higher (but still sub-Solar) carbon abundance in this source. As is the case for the Shapley et al composite, matching both lines simultaneously requires the presence of both a reduced relative carbon abundance and QHE in the population synthesis model.
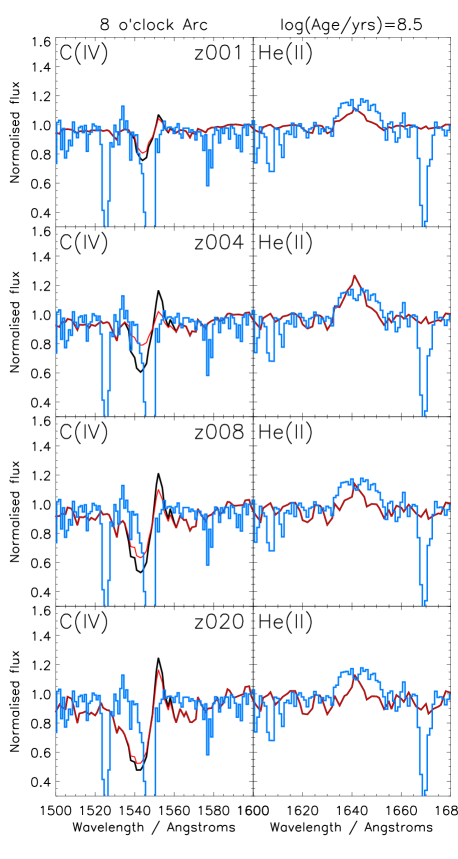
In Figure 8 we consider the 8 o’clock arc, a lensed Lyman break galaxy, with a rest-frame UV spectrum obtained by Dessauges-Zavadsky et al. (2010). This galaxy has reported metallicities higher than others in this sample (Solar, or near-Solar) and has also been reported as relatively massive and dusty (M M⊙, E(B-V)0.67, see Finkelstein et al., 2009; Dessauges-Zavadsky et al., 2010). In this context, its rest-UV spectrum is somewhat surprising. As in the case of BX418, the 8 o’clock arc has a very weak C IV stellar wind line (the absorption is dominated by the narrow nebular component), but strong and broad He II emission, without any obvious nebular component. The lack of a strong C IV wind line indicates that the preferred metallicity in the regions dominating the rest-UV emission must be low, especially in carbon, suggesting a metallicity range of to , with higher metallicities within this range requiring a reduced [C/O] ratio. The strong He II bump suggests metallicities at the high end of the allowed range to reproduce this line. At the lower metallicities fewer WR stars are produced, and weaker line emission in the WR stars also reduces the strength of the line observed. This He II line strength is also only reproducible with QHE in the stellar population.
Based solely on the stellar-dominated spectral features, the similarity between the rest-UV spectrum of this galaxy to that of BX418 (shown in Figure 4) would suggest they are of a similar metallicity, with the deeper absorption features hinting at a slightly more metal rich environment in the 8 o’clock arc. This is somewhat in contradiction to the higher derived metallicity range found by Finkelstein et al. (2009) and Dessauges-Zavadsky et al. (2010) based on nebular ionization models and older stellar population models. It is possible that any discrepancy may arise in part from the different regions probed by these different measurements. If so, it would imply that the youngest star formation (and hence the massive stars that dominate the He II and C IV lines under consideration here) is taking place in regions of lower metallicity than the more metal-rich gas elsewhere in the galaxy. It is, of course, dangerous to over-interpret weak features in data with this signal to noise. However, the flattened line profile of the He II emission may support the hypothesis that metal-rich gas is present to some degree in this system, if interpreted as the superposition of a narrower (perhaps nebular) absorption line on the peak of the broad stellar emission feature.
Interestingly, Cresci et al. (2010) have identified three star-forming galaxies at a similar redshift that show evidence for an inverted metallicity gradient (i.e. central star forming regions with lower metallicity than outlying regions) which may arise from the central accretion of cold gas. Like the 8 o’clock arc, all three are relatively massive (M M⊙) and they also show dynamics that suggest rotational support rather than merger-driven star formation (which may be more dominant in lower-mass UV-luminous systems). A cold-accreting system of this kind is likely to display the same discrepancy between metallicities determined from the youngest stars and from other methods. Cold-mode accretion has been hypothesised as a dominant galaxy formation mechanism at the highest redshifts (Dekel et al., 2009), although this hypothesis remains controversial (see e.g. Steidel et al., 2010). While such a case has not been proven in the 8 o’clock arc, it may prove an interesting target for detailed analysis with integral field spectroscopy, to determine whether there is any evidence for this scenario.
The remaining three galaxies differ to those already discussed in that they do not require the simultaneous invocation of low metallicity, reduced carbon abundance and QHE in their synthetic stellar population to explain the spectral features under consideration, but rather display some or none of these features.
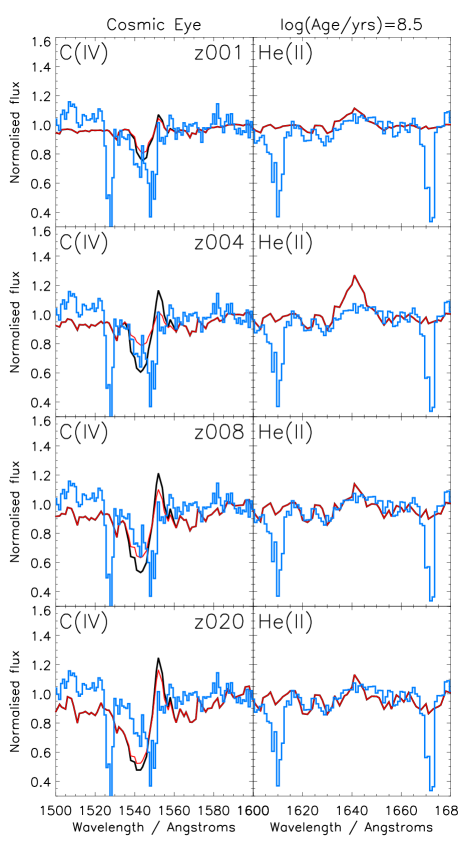
The Cosmic Eye spectrum (Quider et al., 2010) is illustrated in Figure 9 and is notably devoid of strong He II emission. This can be explained if the galaxy lies above the metallicity limit at which QHE no longer occurs. The absorption section of the C IV P Cygni profile also implies a relatively strong metallicity somewhere between and , with a reduced carbon abundance required at the higher metallicity mass fraction. Higher metallicities are ruled out by the relatively shallow absorption.
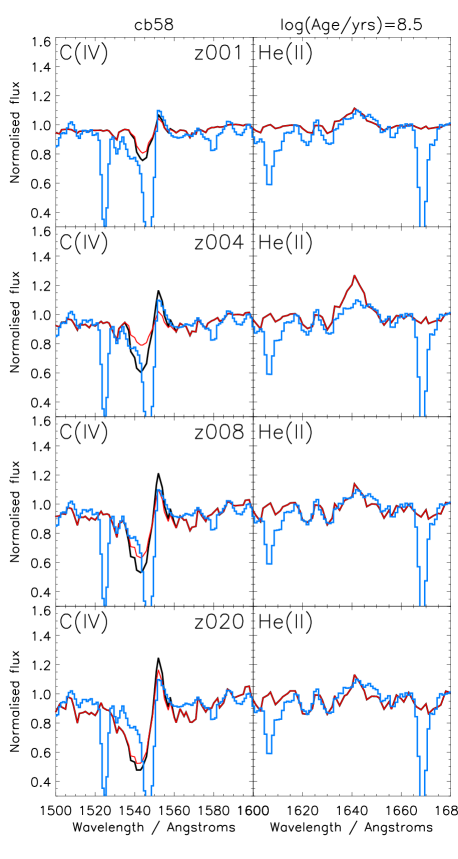
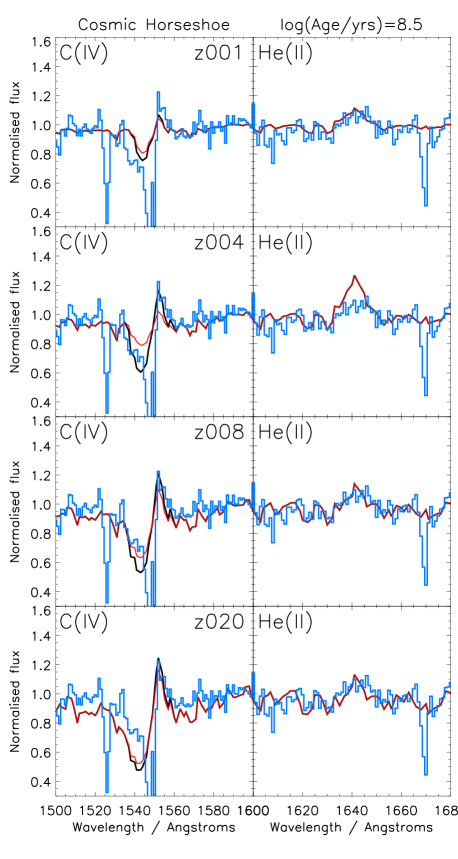
The remaining two examples, cB58 (, Pettini et al., 2002) and the Cosmic Horseshoe (, Quider et al., 2009), in Figures 10 and 11 respectively, tell a similar story. The lack of a strong He II line, yet apparent C IV P-Cygni profiles, suggest higher metallicities for these galaxies, above the range of metallicities for galaxies with stronger He II.
These results suggest that the existence of two populations of LBG galaxies, defined by the presence or absence of broad He II emission as discussed in Section 4.1, may be explained by intrinsic galaxy properties differentiated primarily by the overall metallicity mass fraction of the youngest stellar population (which dominates the UV emission and hence the two stellar features under consideration here). If the metallicity mass fraction is low then QHE is possible in binaries and produces more long lived Of and WR stars, which contribute to the broad He II line. By contrast, when the metallicity is high QHE is no longer possible because stellar wind mass-loss breaks the rotation of stars rapidly to prevent this unusual evolution, and He II emission is comparatively weak. Importantly, in both sets of galaxies we see evidence for a sub-Solar carbon to oxygen ratio in the weaker than expected C IV P-Cygni profiles.
| This Paper | Previous Work | ||||||
| Reduced | Require | ||||||
| Spectrum | [C/O]? | QHE? | [C/O] | Notes | |||
| composite | 7.6–8.5 | 0.001–0.008 | Yes | Yes | 7.7–8.7 | ||
| BX418 | 7.6–8.2 | 0.001–0.004 | Yes | Yes | 7.7–8.1 | 0.2 | Nebular He II contribution |
| 8 o’clock arc | 7.6–8.2 | 0.001–0.004 | Yes | Yes | 8.3–8.6 | – | |
| Cosmic Eye | 8.2–8.5 | 0.004–0.008 | Yes | No | – | Higher preferred | |
| cB58 | 8.2–8.5 | 0.004–0.008 | Yes | No | – | Higher preferred | |
| Cosmic Horseshoe | 8.2–8.5 | 0.004–0.008 | Yes | No | – | Higher preferred | |
5 Conclusions
In this paper we provide evidence that our new synthetic stellar population models can explain the observed stellar emission lines in the UV spectra of LBGs, with best fit models as summarised in Table 2. We see evidence for two main types of LBG UV spectra, differentiated by the presence or absence of broad He II line emission, and explained as the result of varying metallicity in the youngest stellar population. This leads to the absence/presence of an extreme rotational effect (quasi-homogeneous evolution) in the stellar binaries incorporated in our synthesis models. We find three details that must be included to model the spectra accurately: massive binary stars, QHE from the spin-up of the secondary stars in binaries in the event of mass-transfer events, and a reduced carbon-to-oxygen abundance ratio.
Our models support the inference that the sub-Solar [C/O] ratio derived from nebula abundances in the galaxy studied in detail by Erb et al. (2010) may be wide-spread in this population, and that its inclusion in synthesis models is important when fitting individual spectral features. Depletion by a factor of approximately four is consistent with the entirety of the sample discussed here.
In addition, we confirm our earlier work which suggests that binary evolution has significant effects on the spectra of unresolved stellar populations. The main effect of this is increased mass loss in binary stars, and therefore an increase in the overall number of WR stars. Furthermore the effects of rotation (QHE) within a binary system can also lead to dramatic and hither-to unexpected results in the derived model stellar spectra.
Given the near-ubiquity of sub-Solar carbon-to-oxygen ratios in this sample, and the increasing import of QHE effects at low metallicity, it is interesting to consider the possible implications for analysis of Lyman-break galaxies at still higher redshift. This analysis has focused on galaxies at . However similar sources, selected for high rest-UV flux (and hence recent star formation) have now been identified to and beyond. The detailed spectroscopic analysis of these sources is still more difficult than that at due to a combination of increased sky background at long wavelengths, decreased detector sensitivity and increasing luminosity distance, and is not considered further here. However, forthcoming facilities such as the James Clark Maxwell Telescope (JCMT) and the KMOS spectrograph may make analysis of the He II line and other, longer wavelength spectral signatures relatively straightforward at and above. At the low, but non-zero, metallicities inferred at (e.g. Ando et al., 2004; Douglas et al., 2010), the effects of depleted carbon abundance and QHE may have a significant effect on observed spectral features and improved modelling in these areas will be essential for accurate interpretation of spectra obtained.
As the case of the 8 o’clock arc makes clear, it is possible that the youngest star formation is atypical of the galaxy as a whole, which has implications for our understanding of the processes of galaxy formation. If cold-mode accretion is indeed increasingly common at high redshifts as has been suggested (e.g. Cresci et al., 2010; Dekel et al., 2009) then stellar emission and absorption features may be an accessible indicator of this. While the limited sample discussed here is, of course, difficult to interpret, the use of KMOS and the JCMT to build a sample of high redshift sources with high quality rest-UV spectra may allow the identification of galaxies for which the youngest stellar populations are anomalously low in metallicity. Such sources may well prove interesting targets to study as possible examples of the still hotly-debated cold-mode accretion scenario.
Acknowledgements
The authors would like to thank those who kindly provided their spectra and made this paper possible, Miroslava Dessauge, Dawn Erb, Anna Quider and Max Pettini. The authors would also like to thank the anonymous referee for bringing the peculiar nature of the 8 o’clock arc to their attention. The authors would like to thank Malcolm Bremer, Max Pettini, Paul Crowther, Stephen Smartt, Nate Bastian and Norbert Langer for useful discussions. ERS acknowledges postdoctoral research support from the UK Science and Technology Facilities Council (STFC) for part of this work. JJE acknowledges support from the UK Science and Technology Facilities Council (STFC) under the rolling theory grant for the Institute of Astronomy.
References
- Allam et al. (2007) Allam S. S., Tucker D. L., Lin H., Diehl H. T., Annis J., Buckley-Geer E. J., Frieman J. A., 2007, ApJ, 662, L51
- Ando et al. (2004) Ando M., Ohta K., Iwata I., Watanabe C., Tamura N., Akiyama M., Aoki K., 2004, ApJ, 610, 635
- Belokurov et al. (2007) Belokurov, V., et al. 2007, ApJL, 671, L9
- Bouché et al. (2007) Bouché N., Lehnert M. D., Aguirre A., Péroux C., Bergeron J., 2007, MNRAS, 378, 525
- Bouwens et al. (2004) Bouwens R. J., Illingworth G. D., Thompson R. I., Blakeslee J. P., Dickinson M. E., Broadhurst T. J. et al., 2004, ApJL, 606, L25
- Brinchmann, Pettini & Charlot (2008) Brinchmann J., Pettini M., Charlot S., 2008, MNRAS, 385, 769B
- Bruzual & Charlot (2003) Bruzual G., Charlot S., 2003, MNRAS, 344, 1000
- Bruzual (2007) Bruzual G., 2007, ASPC, 374, 303
- Cantiello et al. (2007) Cantiello M., Yoon S.-C., Langer N., Livio M., 2007, A&A, 465L, 29C
- Conroy, Gunn & White (2008) Conroy C., Gunn J.E., White M., 2009, ApJ, 699, 486
- Conroy, White & Gunn (2010) Conroy C., White M., Gunn J.E., 2010, ApJ, 708, 58C
- Conroy & Gunn (2010) Conroy C., Gunn J.E., 2010, ApJ, 712, 833C
- Cresci et al. (2010) Cresci G., Mannucci F., Maiolino R., Marconi A., Gnerucci A., Magrini L., 2010, Nature, 467, 811C
- Crowther et al. (2006) Crowther P. A., Prinja R. K., Pettini M., Steidel C. C., 2006, MNRAS, 368, 895
- Davies et al. (2010) Davies L. J. M., Bremer M. N., Stanway E. R., Birkinshaw M., Lehnert M. D., 2010, MNRAS, 408, L31
- Dekel et al. (2009) Dekel A., et al., 2009, Natur, 457, 451
- Dessauges-Zavadsky et al. (2010) Dessauges-Zavadsky M., D’Odorico S., Schaerer D., Modigliani A., Tapken C., Vernet J., 2010, A&A, 510, A26
- Douglas et al. (2010) Douglas L. S., Bremer M. N., Lehnert M. D., Stanway E. R., Milvang-Jensen B., 2010, MNRAS, 409, 1155
- Eggleton (1971) Eggleton P.P., 1971, MNRAS, 151, 351
- Eldridge, Izzard & Tout (2008) Eldridge J.J., Izzard R.G., Tout C.A., 2008, MNRAS, 384, 1109
- Eldridge & Stanway (2009) Eldridge J. J., Stanway E. R., 2009, MNRAS, 400, 1019
- Eldridge, Langer, & Tout (2011) Eldridge J. J., Langer N., Tout C. A., 2011, MNRAS in press
- Erb et al. (2010) Erb D. K., Pettini M., Shapley A. E., Steidel C. C., Law D. R., Reddy N. A., 2010, ApJ, 719, 1168
- Ferland et al. (1998) Ferland G.J., Korista K.T., Verner D.A., Ferguson J.W., Kingdon J.B., Verner E.M., 1998, PASP, 110, 761
- Finkelstein et al. (2009) Finkelstein S.L., Papovich C., Rudnick G., Egami E., Le Floc’h E., Rieke M. J., Rigby J.R., Willmer C.N.A., 2009, ApJ, 700, 376F
- Hunter et al. (2009) Hunter I., et al., 2009, A&A, 496, 841
- Hunter et al. (2007) Hunter I., Dufton P.L., Smartt S.J., Ryans R.S.I., Evans C.J., Lennon D.J., Trundle C., Hubeny I., Lanz T., 2007, A&A, 466, 277H
- Hurley, Tout & Pols (2002) Hurley J.R., Tout C.A., Pols O.R. 2002, MNRAS, 329, 897
- Kroupa (2002) Kroupa P., 2002, Sci, 295, 82
- Le Borgne et al. (2004) Le Borgne D., Rocca-Volmerange B., Prugniel P., Lançon A., Fioc M., Soubiran C., 2004, A&A, 425, 881
- Leitherer et al. (1999) Leitherer C., et al., 1999, ApJS, 123, 3
- Maraston (2005) Maraston C., 2005, MNRAS, 362, 799
- Maeder (1987) Maeder A., 1987, A&A, 178, 159M
- Meynet & Maeder (2007) Meynet G., Maeder A., 2007, A&A, 464, L11
- Molla et al. (2009) Molla M., Garcia-Vargas M.L., Bressan A., 2009, MNRAS in press
- Pauldrach, Hoffmann, & Lennon (2001) Pauldrach A. W. A., Hoffmann T. L., Lennon M., 2001, A&A, 375, 161
- Pettini et al. (2002) Pettini M., Rix S.A., Steidel C.C., Adelberger K.L., Hunt M.P., Shapley A.E., 2002, ApJ, 569, 742P
- Petrovic, Langer & van der Hucht (2005) Petrovic J., Langer N., van der Hucht K. A., 2005, A&A, 435, 1013P
- Quider et al. (2009) Quider, A. M., Pettini, M., Shapley, A. E., & Steidel, C. C. 2009, MNRAS, 398, 1263
- Quider et al. (2010) Quider A. M., Shapley A. E., Pettini M., Steidel C. C., Stark D. P., 2010, MNRAS, 402, 1467
- Rix et al. (2004) Rix S. A., Pettini M., Leitherer C., Bresolin F., Kudritzki R.-P., Steidel C. C., 2004, ApJ, 615, 98
- Shapley et al. (2001) Shapley A. E., Steidel C. C., Adelberger K. L., Dickinson M., Giavalisco M., Pettini M., 2001, ApJ, 562, 95
- Shapley et al. (2003) Shapley A. E., Steidel C. C., Pettini M., Adelberger K. L., 2003, ApJ, 588, 65
- Smith, Norris & Crowther (2002) Smith L.J., Norris R.P.F., Crowther P.A., 2002, MNRAS, 337, 1309S
- Steidel et al. (2010) Steidel C. C., Erb D. K., Shapley A. E., Pettini M., Reddy N., Bogosavljević M., Rudie G. C., Rakic O., 2010, ApJ, 717, 289
- Yoon & Langer (2005) Yoon S.-C., Langer N., 2005, A&A, 443, 643
- Yoon, Langer, & Norman (2006) Yoon S.-C., Langer N., Norman C., 2006, A&A, 460, 199
- Zackrisson, Bergvall & Leitet (2008) Zackrisson E., Bergvall N., Leitet E., 2008, ApJ, 676L, 9