A Chandra X-ray Observation of the Binary Millisecond Pulsar PSR J1023+0038
Abstract
We present a Chandra X-ray Observatory ACIS-S variability, spectroscopy, and imaging study of the peculiar binary containing the millisecond pulsar J1023+0038. The X-ray emission from the system exhibits highly significant (12.5) large-amplitude (factor of 2–3) orbital variability over the five consecutive orbits covered by the observation, with a pronounced decline in the flux at all energies at superior conjunction. This can be naturally explained by a partial geometric occultation by the secondary star of an X-ray–emitting intrabinary shock, produced by the interaction of outflows from the two stars. The depth and duration of the eclipse imply that the intrabinary shock is localized near or at the surface of the companion star and close to the inner Lagrangian point. The energetics of the shock favor a magnetically dominated pulsar wind that is focused into the orbital plane, requiring close alignment of the pulsar spin and orbital angular momentum axes. The X-ray spectrum consists of a dominant non-thermal component and at least one thermal component, likely originating from the heated pulsar polar caps, although a portion of this emission may be from an optically-thin “corona”. We find no evidence for extended emission due to a pulsar wind nebula or bow shock down to a limiting luminosity of ergs s-1 (0.3–8 keV), of the pulsar spin-down luminosity, for a distance of 1.3 kpc and an assumed power-law spectrum with photon index .
Subject headings:
pulsars: general — pulsars: individual (PSR J1023+0038) — stars: neutron — X-rays: stars1. INTRODUCTION
The Galactic source FIRST J102347.6+003841 was discovered by Bond et al. (2002) who initially classified it as a magnetic cataclysmic variable. Subsequent studies (Thornstensen & Armstrong, 2005; Homer et al., 2006) concluded that this object is more likely a neutron star low-mass X-ray binary. Its true nature was finally unveiled with the Green Bank Telescope discovery of 1.69-ms radio pulsations (Archibald et al. 2009), establishing it as a compact binary containing a rotation-powered millisecond pulsar (MSP). The pulsar, PSR J1023+0038, is in a circular 4.8-hour binary orbit with an optically identified non-degenerate low-mass ( M⊙) companion star (Archibald et al., 2009). Perhaps more importantly, it is the first radio MSP binary to have exhibited past evidence for an accretion disk. In 2001, double-peaked emission lines characteristic of accretion disks, accompanied by short-timescale flickering and a blue spectrum, were observed at optical wavelengths (Bond et al., 2002; Szkody et al., 2003). There is no evidence that a disk is currently present in the system (Wang et al., 2009). A plausible interpretation of this behavior is a very recent transition from an accretion- to a rotation-powered neutron star. If this is indeed the case, PSR J1023+0038 lends strong observational support for the long-suspected evolutionary connection between accreting MSPs in low-mass X-ray binaries (Wijnands, 2010, and references therein) and rotation-powered “recycled” MSPs (Alpar et al., 1982).
In its present “quiescent” state, PSR J1023+0038 exhibits radio eclipses at superior conjunction, when the secondary star is between the pulsar and observer, as well as short, random and irregular eclipses and dispersion measure variations at all orbital phases (Archibald et al., 2009). Based on the orbital parameters of the binary and an assumed M⊙ pulsar, for the implied orbital inclination of 46∘, the line-of-sight between the pulsar and the Earth does not intersect the Roche lobe of the companion at any point in the orbit (Archibald et al., 2010). Therefore, the eclipses must be caused by material driven off the surface of the secondary by the impinging pulsar wind. Such eclipses and dispersion measure variations seen in similar MSP binaries both in globular clusters (see, e.g., D’Amico et al., 2001, for the case of PSR J1740–5340 in NGC 6397) and in the field of the Galaxy (see Hessels et al., 2011, concerning PSR J2215+51) can be attributed to the presence of matter flowing out from the irradiated companion, as is likely the case for J1023+0038.
The J1023+0038 system has been previously observed in X-rays with XMM-Newton (Homer et al., 2006) for 15 ks, with all instruments in full imaging mode, and revisited in a target of opportunity observation for 34.5 ks, with the EPIC pn instrument configured in fast timing mode (Archibald et al., 2010). The latter observation, in addition to detecting variability correlated with orbital phase, has revealed compelling evidence for X-ray pulsations at the pulsar’s rotational period. The X-ray spectrum is relatively hard with power-law spectral photon index and luminosity ergs s-1 (0.5–10 keV), plus a possible thermal component. The nature of the J1023+0038 system and the evidence for variability in the X-ray lightcurve favor interaction of the relativistic particle wind from the pulsar with matter from the close stellar companion as the source of the non-thermal radiation. The detection of X-ray pulsations by Archibald et al. (2010) in the XMM-Newton EPIC pn data implies that a portion of the observed X-rays originates from the pulsar itself. Pulsed X-ray emission from typical MSPs ( ergs s-1) is thermal in nature (Zavlin, 2006; Bogdanov et al., 2006; Bogdanov & Grindlay, 2009), while in the less common energetic MSPs ( ergs s-1) the emission is characteristically non-thermal (see, e.g., Rutledge et al. 2004). Given that PSR J1023+0038 is moderately energetic, with ergs s-1, the true nature of the pulsations is ambiguous (Archibald et al., 2010).
Most of the rotational energy lost by a pulsar is carried away by winds comprised of relativistic particles and magnetic fields (Kennel & Coroniti, 1984). The winds shocked in the ambient medium produce pulsar wind nebulae (PWNe) observable from the radio through -rays. To date, extended X-ray emission has only been observed from two MSPs: the canonical “black widow” PSR B1957+20 (Fruchter et al., 1988; Stappers et al., 2003) and the nearby isolated PSR J2124–3358 (Hui & Becker 2006). As PSR J1023+0038 moves through the ambient interstellar medium, it may also generate sufficient ram pressure to confine the pulsar wind, resulting in the formation of a bow shock, accompanied by a synchrotron-emitting “cometary” tail trailing behind the pulsar. Given the strong possibility that PSR J1023+0038 is a recently activated radio MSP, it is important to search for an associated wind nebula. The spatial structure of any X-ray tail along the proper motion direction could, in principle, be employed as a “timeline” of the pulsar wind activity. This is possible because any accretion onto a radio pulsar would presumably extinguish the pulsar wind, which in turn would result in interruptions in the injection of the energetic wind into the interstellar medium.
Herein, we report on a Chandra X-ray Observatory Advanced CCD Imaging Spectrometer (ACIS) imaging spectroscopic observation of PSR J1023+0038. This investigation offers further insight into the properties of this remarkable binary. The present work is outlined as follows. In §2, we summarize the observations, data reduction and analysis procedure. In §3, we focus on the X-ray variability of PSR J1023+0038. In §4 we present the spectroscopic analysis, while in §5 we conduct an imaging analysis. In §6 we describe a simple geometric model and in §7 the physics of the intrabinary shock emission. We offer conclusions in §8.
2. OBSERVATION AND DATA REDUCTION
The Chandra dataset was acquired on 2010 March 24 (ObsID 11075) in a single, uninterrupted 83.1-ks exposure. The pulsar was placed at the nominal aim point of the back-illuminated ACIS-S3 CCD, configured in VFAINT telemetry mode. To minimize the effect of photon pileup (Davis, 2001), the detector was used in a custom subarray mode with 256 pixel rows, starting from CCD row 385.
The data re-processing, reduction, and analysis were performed using CIAO111Chandra Interactive Analysis of Observations, available at http://cxc.harvard.edu/ciao/ 4.2 and the corresponding calibration products (CALDB 4.3.1). Starting from the level 1 data products of the ACIS-S observation, we first removed pixel randomization from the standard pipeline processing to aid in the search for extended emission near the point-source emission from the pulsar. To search for large-scale diffuse emission, we applied the background cleaning algorithm applicable to the VFAINT telemetry mode. However, this procedure tends to reject real source counts for relatively bright sources. Consequently, for the image subtraction, spectroscopic, and variability analyses discussed below, the data without the background cleaning applied were used.
For the spectroscopic and variability analyses, we extracted the emission from a circular region of radius 2 that encloses 90% of the total source energy at 1.5 keV. The pulsar net count rate in this region is counts s-1 (0.3–8 keV). To permit spectral fitting in XSPEC222Available at http://heasarc.nasa.gov/docs/xanadu/xspec/index.html. 12.6.0q, the extracted source counts in the 0.3–8 keV range were grouped in energy bins so as to ensure at least 15 counts per bin. The background was taken from three source-free regions in the image around the pulsar. For the variability analysis, the photon arrival times were translated to the solar system barycenter using the CIAO tool axbary assuming the DE405 JPL solar system ephemeris and the pulsar position derived from radio timing (Archibald et al., 2009). We note that the 3.2-s time resolution of the ACIS-S precludes the study of pulsations at the pulsar spin period.
3. X-ray Orbital Variability
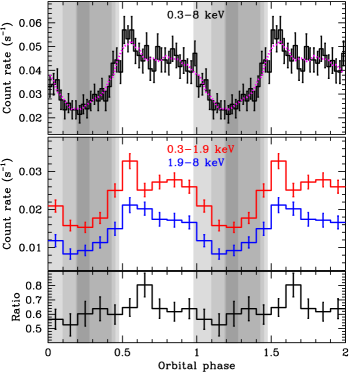
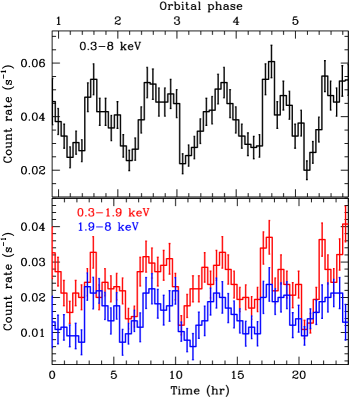
The study by Archibald et al. (2010) uncovered large amplitude X-ray variability from J1023+0038. However, due to the short exposure, it was not possible to establish whether the flux modulations were truly periodic. We have used the radio timing ephemeris of PSR J1023+0038 (Archibald et al., 2009) to fold the barycentered Chandra source photons at the binary period. As the observation covers over five binary orbits, we can definitively confirm that the X-ray flux is modulated at the binary period (Figures 1 and 2). The variations are characterized by a factor of 2-3 decline in the photon count rate at superior conjunction (). A Kuiper test (Paltani, 2004) on the folded, unbinned lightcurve, weighted to account for the non-uniform exposure across the orbit, indicates a (12.5) probability that photons being drawn from a constant distribution would exhibit this level of non-uniformity. Statistically, the individual lightcurves from the five binary orbits are consistent with having the same shape. There is no indication of statistically significant spectral variability throughout the orbit (bottom panel of Figure 2). As discussed in §6, the X-ray modulations can be plausibly interpreted as being due to a partial geometric occultation of an intrabinary shock by the secondary star.
| Total | Joint | |||
|---|---|---|---|---|
| ModelaaAll uncertainties and upper limits quoted are 1. | ||||
| Power-law | ||||
| ( cm-2) | ||||
| ( ergs cm-2 s-1)ccUnabsorbed X-ray flux (0.3–8 keV) in units of ergs cm-2 s-1. | ||||
| /dof | ||||
| Power-law + H atmosphere (NSA)bbFor the NSA model, a M⊙, km neutron star is assumed. The effective emission radius as measured at the stellar surface, , was calculated assuming a distance of 1.3 kpc (Archibald et al., 2009). | ||||
| ( cm-2) | ||||
| ( K) | ||||
| (km) | ||||
| Thermal fractionddFraction of unabsorbed flux from the thermal component in the 0.3–8 keV band. | ||||
| ( ergs cm-2 s-1)ccUnabsorbed X-ray flux (0.3–8 keV) in units of ergs cm-2 s-1. | ||||
| dof | ||||
| Power-law + MEKALeeFor the MEKAL model, solar abundances are assumed. | ||||
| ( cm-2) | ||||
| (keV) | ||||
| Thermal fractionddFraction of unabsorbed flux from the thermal component in the 0.3–8 keV band. | ||||
| ( ergs cm-2 s-1)ccUnabsorbed X-ray flux (0.3–8 keV) in units of ergs cm-2 s-1. | ||||
| dof |
4. Spectroscopy
4.1. Total Spectrum
As found by Homer et al. (2006) and Archibald et al. (2010) based on the set of XMM-Newton observations, the phase-integrated Chandra X-ray spectrum of PSR J1023+0038 is well described by a pure absorbed power-law, while it is poorly fitted by a single thermal (blackbody or neutron star hydrogen atmosphere) model. Moreover, Archibald et al. (2010) found that a slight improvement in the fit quality was obtained with the addition of a thermal (neutron star atmosphere) component. Based on this, in the spectral analysis of the Chandra data we consider both a one-component absorbed power-law model and a composite absorbed power-law plus NS atmosphere. We use the hydrogen atmosphere NSA model (Zavlin et al., 1996) over a blackbody because an atmospheric layer is expected at the surface of a MSP given the standard formation scenario of MSPs, involving accretion of a substantial amount of matter. In addition, the thermal pulsations from the nearest known MSPs require the presence of a light-element atmosphere (Bogdanov et al., 2007; Bogdanov & Grindlay, 2009). In principle, a portion of the observed X-ray emission from the J1023+0038 system could also originate from a thermal plasma within or around the binary, possibly from the active corona of the secondary star or the plasma responsible for the radio eclipses. To explore this possibility, we also conduct fits with a model consisting of a power-law plus MEKAL thermal plasma model in XSPEC. The MEKAL model considers an emission spectrum from hot diffuse gas including line emissions from several elements given a set of metal abundances (Mewe et al., 1985, 1986; Liedahl et al., 1995). The best-fit parameters from the three different models are summarized in column 2 of Table 1.
Both the pure power-law and power-law plus thermal component yield statistically acceptable fits. However, an F-test indicates that the probability the composite model is a better fit purely by chance is only , suggesting that the addition of the thermal component is warranted by the data. By analogy with most MSPs detected in X-rays (Zavlin, 2006; Bogdanov et al., 2006; Bogdanov & Grindlay, 2009), PSR J1023+0038 should have heated magnetic polar caps and hence a thermal component in the predominantly non-thermal spectrum. The evidence for relatively broad pulsations at the pulsar period found by Archibald et al. (2010) in the XMM-Newton EPIC pn data are consistent with a portion of the observed X-rays originating from the neutron star polar caps. The implied thermal luminosity of ergs s-1 and to conversion efficiency () are comparable to those of most nearby (Zavlin, 2006; Bogdanov & Grindlay, 2009) and globular cluster MSPs (Bogdanov et al., 2006, 2011).
As in Archibald et al. (2010), in most of the fits, the hydrogen column density along the line of sight is consistent with zero. This is not surprising, given that the column density along the line of sight and to the edge of the Galaxy is only cm-2. Since such a low only affects the spectrum below 0.3 keV, the fits of the Chandra spectrum are nearly insensitive to this parameter.
4.2. Orbital Phase-resolved Spectrum
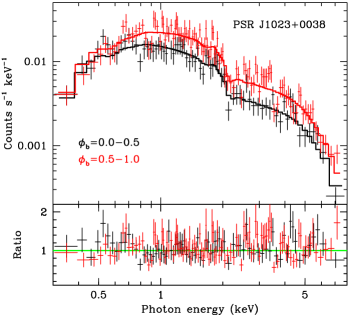
The ample number of photons (3280 within 2 of the pulsar) makes it possible to consider the continuum emission from J1023+0038 from two portions of the orbit: (at the X-ray minimum) and (Figure 3). We fit the two spectra both separately and jointly. In the joint fits, we tied and both the temperature and effective radius of the thermal component in all cases since the radiation from the pulsar is not expected to exhibit any dependence on orbital phase. The results of the orbital phase-resolved spectral fits are summarized in columns 3–5 of Table 1.
Although statistically a pure power-law spectrum provides a good description of the total phase-averaged X-ray spectrum, it yields only marginally acceptable fits of the individual spectra at orbital phases and , with in both cases. The same is true for the joint fit of the two phase intervals. In the individual and joint fits, the inferred spectral photon indices are consistent with being the same. This is in agreement with the finding in §3 regarding the absence of orbital phase-dependent spectral variability although deeper observations are necessary to confirm this.
In general, the spectral fits tend to favor the non-thermal plus thermal model over the purely non-thermal model. It should be noted, however, that the derived temperatures and radii for the NSA model are considerably different between the total, individual and joint spectral fits. One possible explanation is the presence of a multi-temperature thermal spectrum, arising due to non-uniform heating across the face of the magnetic polar caps. Such thermal emission is seen in several nearby MSPs (Zavlin, 2006; Bogdanov & Grindlay, 2009). The variation in the dominant non-thermal component as a function of orbital phase could result in the fits being more sensitive to the different temperatures such that at the X-ray minimum the emission from the cooler portions of the polar cap(s) becomes more prominent. Alternatively, the differences in inferred temperature could be caused by the presence of both polar cap and “coronal” thermal plasma emission, especially if the coronal emission is also modulated at the binary period. Detailed spin and orbital phase-resolved spectroscopic observations are required to unambiguously disentangle the various spectral components.
5. Imaging Analysis
As noted in §1, evidence of past pulsar wind activation and accretion episodes in PSR J1023+0338 may, in principle, be manifested through irregularities or discontinuities in any nebular X-ray emission associated with the pulsar. The expected stand-off angular distance for a bow shock around a pulsar moving supersonically through the ambient medium can be estimated using the expression (Kargaltsev & Pavlov, 2008, and references therein), where is the mean density of the ambient gas, is the pulsar proper motion, the pulsar spin-down luminosity, and the distance. For a distance of kpc (Archibald et al., 2009), mas yr-1, ergs s-1, and cm-3 expected for warm neutral ambient gas (see, e.g., Chatterjee & Cordes, 2002), we obtain a stand-off distance of 4.
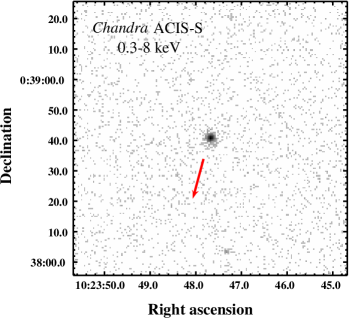
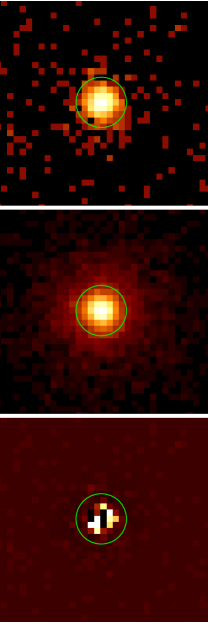
Figure 4 shows the image of the ACIS-S exposure centered on PSR J1023+0038 in the keV band. The binary is the brightest source in the image at the wavdetect-reported position of , . This differs from the optical position , given in the NOMAD catalog (Zacharias et al., 2004) by just and in right ascension and declination, respectively, well within the typical uncertainty in the absolute astrometry of Chandra333See http://cxc.harvard.edu/cal/ASPECT/celmon/. It is evident that beyond 2 of the pulsar, there is no significant excess of photons surrounding the pulsar, as might be expected from a pulsar wind nebula, nor in the direction opposite the pulsar proper motion as expected for a fast-moving pulsar.
PSR B1957+20 ( kpc, ergs s-1) exhibits an X-ray tail of length 16 in the direction opposite the pulsar proper motion (Stappers et al., 2003). Extracting the counts from a rectangular region trailing J1023+0038 yields no appreciable excess of counts above the background count rate near the pulsar position, which is counts s-1 arcsec-2 (0.3–8 keV). Assuming a representative power-law spectrum from the current sample of X-ray PWNe (Kargaltsev & Pavlov, 2008) with , the conservative limit on the wind nebula luminosity is ergs s-1 for a distance of kpc.
To investigate the presence of small-scale ()
diffuse emission that could potentially arise due to a very compact
pulsar wind nebula, we simulated a set of 100 observations of PSR
J1023+0038 with the ChaRT444The Chandra Ray Tracer, available
at http://cxc.harvard.edu/soft/ChaRT/cgi-bin/www-saosac.cgi
and MARX 4.5555Available at
http://space.mit.edu/cxc/marx/index.html. software packages,
based on the parameters of the ACIS-S observation and the spectral
shape of the X-ray emission as determined from the spectral fits (see
§4). We subtracted the resulting average synthetic point spread
function from the observed image and examined the significance of any
residual emission relative to the background level (Figure 5). Within
1 of the center, the difference image exhibits
significant azimuthally asymmetric residuals (both positive and
negative). One possible cause could be a slight offset between the
location of the source centroid reported by wavdetect and the
true source position. To test this possibility, we have simulated
images with a range of displacements along the azimuthal direction in
which the residuals are most pronounced in an effort to reduce the
observed artifacts. However, in all instances there is no improvement
in the difference image. Therefore, it appears more likely that the
artifacts are due to imperfections in the modeling of the
High-Resolution Mirror Assembly optics (Juda & Karovska, 2010)666See
also
http://hea-www.harvard.edu/j̃uda/memos/
HEAD2010/HEAD2010_poster.html
and
http://cxc.harvard.edu/cal/Hrc/PSF/acis_psf_2010oct.html.
Aside from the discrepancies in the central pixels of the PSF, the
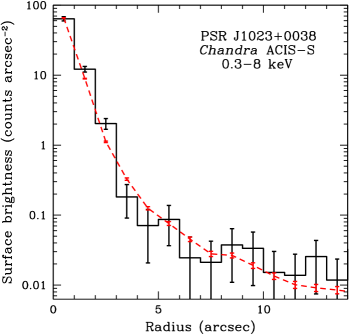
spatial distribution of events beyond 1 of the pulsar
position is consistent with that of a point source (Figure 6).
6. A Geometric Model of the Intrabinary Shock
The morphology and spectral properties of the folded X-ray lightcurve in Figure 2 allow us to make important qualitative statements regarding the properties of the source of the non-thermal X-ray emission in the J1023+0038 system. For instance, the lack of significant accompanying spectral variability indicates that the X-ray variability is not due to photoelectric absorption. An enhanced during eclipse phases would diminish the softest portion of the spectrum causing an apparent hardening of the emission. Instead, a uniform decline at all energies is observed. Thus, a more natural interpretation is obstruction of our view of the X-ray-emitting region by the companion star. Although it is difficult to pinpoint the exact start and end, the approximate duration of the X-ray eclipse (0.1–0.4 in orbital phase) implies that the source of the X-ray emission is much closer to the secondary star (presumably near or at the inner Lagrangian [L1] point) than to the pulsar. For reference, for an assumed pulsar mass of 1.4 M⊙, which implies an orbital inclination of , the L1 point is occulted for 32% of the orbit (). The rounded shape of the X-ray minimum and the gradual ingress and egress indicate that the region is gradually occulted, implying it is extended (of order the size of the star). The factor of 2-3 decline in the X-ray flux implies that at the secondary star blocks our line of sight to at least half of the emission region.
To verify these statements, we have constructed a three-dimensional geometric model of the binary assuming a 1.4 M⊙ pulsar and plus the orbital parameters measured from radio timing (Archibald et al., 2009). Using this model, we generate lightcurves to compare against the Chandra data. For the entire range of orbital phases, we determined the fraction of the emission region under consideration that was occulted by the secondary star as viewed by the observer from a angle. Based on this, we determined the observed flux relative to when the region is in full view. The resulting lightcurves were subsequently fitted to the data, with a flux scaling and DC offset as the only free parameters.
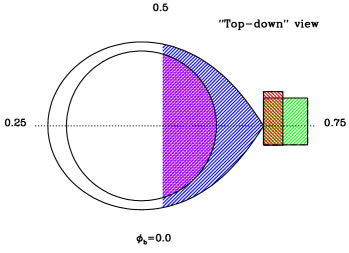
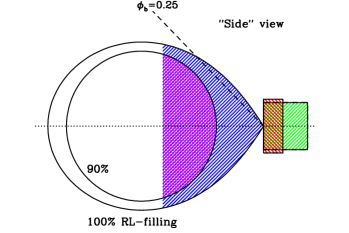
One possibility is that the pulsar wind is interacting with material near the surface of the secondary star. If this is indeed the case, the shape of the X-ray-emitting region would roughly correspond to the shape of the side of the secondary star facing the pulsar (Figure 7). For this scenario, as illustrative examples, we consider both the case of a Roche-lobe filling star and one that is 90% the size of its Roche lobe. It is apparent from Figure 8 that in both cases the resulting lightcurves (blue and magenta lines, respectively) approximate the shape of the observed modulations fairly well.
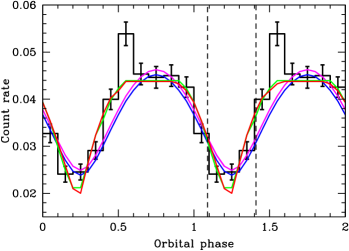
An alternative origin of the observed X-rays is interaction of the pulsar wind with matter issuing from the Roche-lobe filling companion through the L1 point (see, e.g., Figure 2 in Bogdanov et al., 2005). As an approximation to this outflow, we take a cylindrical volume with one of the circular bases centered on the L1 point (Figure 7). In this configuration, it is possible to account for an eclipse minimum occuring before (as suggested by the data, albeit at marginal significance) by considering a region that is offset away from the direction of motion of the secondary star in the binary. Two representative examples of such a “stream” geometry that reproduce the rough shape of the Chandra lightcurve are shown in Figure 8 (green and red lines).
We note that it is also very possible that both emission from the stellar surface and from a stream at L1 contribute to the observed non-thermal X-ray flux. However, due to the limited photon statistics, substantially deeper observations are required to unambiguously determine the shock geometry by way of lightcurve modeling. Nonetheless, Figure 8 illustrates that an intrabinary shock localized primarily near L1 and/or at the face of the companion is a very plausible interpretation of the observed X-ray flux modulations.
7. Constraining the Physics of the Intrabinary Shock
The purely geometric model employed above pays no regard to the actual physical mechanism responsible for the production of the observed X-ray emission. Nevertheless, the geometric information obtained can be used to place constraints on the physics of the shock. Given the small separation between the pulsar and the companion ( cm), the shock must occur in a relatively strong magnetic field. Therefore, synchrotron emission from accelerated charged particles is the likely X-ray production mechanism. The X-ray luminosity in the shock is dependent on both the postshock magnetic field strength and the wind magnetization factor , defined as the ratio between the Poynting flux and particle flux (or, equivalently, the ratio of magnetic and particle energy densities). Since at the shock front is not known a priori, we must consider both a wind dominated by kinetic energy ( as seen in the Crab nebula) and one that is magnetically dominated (). Following the formalism described by Arons & Tavani (1993), the magnetic field strength immediately upstream of the shock is given by . Here is a geometric factor that defines the fraction of the sky into which the pulsar wind is emitted, and is the distance between the MSP and the shock. We take cm, the distance from the MSP to L1 assuming M⊙ and . For an isotropic pulsar wind () and ergs s-1 we obtain G () and G (). The implied magnetic field strength beyond the shock is then G or G. Production of the observed keV photons via synchrotron emission requires relativistic electrons/positrons with Lorentz factors . The corresponding synchrotron radiative loss time is s (Rybicki & Lightman, 1979). The geometric model presented earlier indicates that the shock region is of order the diameter of the secondary star ( cm). From here, the residence times of the radiating particles in the shock region are s (for ) and s (for ).
The expected synchrotron luminosity from the shock can be estimated from , where is the radiative efficiency of the synchrotron emission, is the fraction of the intercepted spin-down energy flux that goes into accelerating electrons with Lorentz factor , is the fraction of the pulsar wind that interacts with matter from the companion, is the portion of the total observed X-ray luminosity that originates from the intrabinary shock, and is the synchrotron luminosity over the energy band . For simplicity, we will assume keV centered at 1 keV. Since , we obtain and for and , respectively. The companion star intercepts of the pulsar’s outflow for the case of an isotropic wind. It is important to note, however, that the MSP outflow most likely exhibits significant anisotropy, with the bulk of the wind emitted equatorially (as seen in the Crab pulsar; Hester et al., 1995; Michel, 1994). Since the spin axis of the pulsar has likely aligned with the orbital angular momentum vector during the LMXB accretion phase (Bhattacharya & van den Heuvel, 1991), the wind of PSR J1023+0038 should thus be preferentially emitted in the orbital plane. In the extreme case of a sheet-like wind confined entirely to the orbital plane, the secondary star would receive of the pulsar wind’s power. Based on this, we set .
Using the count rate maxima predicted by the model lightcurves shown in Figure 8, the intrinsic synchrotron luminosity of the shock in the absence of eclipses is estimated to be ergs s-1 for particles with in a band kev centered on keV. With as deduced from the spectral fits, we obtain () and (). For , the derived for an isotropic wind exceeds unity and even in the highly anisotropic case is unrealistically high. The same applies if we consider a factor of larger emission region and stronger upstream magnetic field. Since it is likely that (e.g., for the Crab pulsar and nebula), the unphysical values of for suggest that at the distance of the shock, the wind of PSR J1023+0038 is magnetically dominated (). Furthermore, for , a value of comparable to that of the Crab pulsar requires significant anisotropy in the wind.
It is interesting to highlight the apparent enhancement of emission at eclipse egress () since it likely arises due to Doppler beaming in the direction of the post-shock flow (Arons & Tavani, 1993). Similar, albeit much less statistically significant features have been seen in other eclipsing MSP systems (see, e.g., Stappers et al., 2003; Bogdanov et al., 2005). For PSR J1023+0038, the implied flow direction is opposite to the sense of motion of the secondary star in its orbit, indicating that the combined effects of the gravitational, pulsar wind pressure, and Coriolis forces together with the outflow velocity relative to the orbital velocity, conspire to force the outflowing gas towards the trailing edge of the eclipse (see, e.g., Tavani & Brookshaw, 1991). This effect can also account for the absence of a matching X-ray flux increase at ingress as it results in a weaker outflow towards the leading edge of the eclipse. Within the available photon statistics, the factor of increase in brightness at relative to the flux outside of eclipse () is in agreement with the range predicted by Arons & Tavani (1993) based on the expected range of post-shock wind flow velocities ().
8. CONCLUSION
We have presented Chandra ACIS-S observations of the PSR J1023+0038 binary system. The data definitively confirm the X-ray flux variability at the binary orbital period. A simple geometrical model can account for the general shape of the X-ray lightcurve of the binary, indicating that the observed variability is primarily due to a partial geometric eclipse of the intrabinary shock by the secondary star. The model suggests that the shock is likely localized near L1 and/or is formed by the interaction of the pulsar wind and matter at the surface of the secondary star. The energetics of the shock emission favor a magnetically dominated () pulsar wind at the shock front. This is not surprising, given that the shock occurs in a times stronger magnetic field than in the case of the Crab pulsar (where the wind is dominated by kinetic energy; see Kennel & Coroniti, 1984). The X-ray data also favor a significantly anisotropic pulsar wind that is preferentially emitted in the orbital plane, which, in turn, requires close alignment of the pulsar spin and orbital angular momentum axes, as expected from binary evolution.
Combined with the study presented in Archibald et al. (2010), the spectral continuum suggests a dominant non-thermal component and the presence of a fainter thermal component that, at least in part, originates from the hot polar caps of the pulsar. In this sense, in terms of its X-ray properties, the pulsar itself appears to be similar to the majority of “recycled” MSPs detected in X-rays to date (Zavlin, 2006; Bogdanov et al., 2006; Bogdanov & Grindlay, 2009; Bogdanov et al., 2011). A portion of the thermal X-ray emission may also come from an optically-thin thermal plasma, possibly the same plasma responsible for the radio eclipses.
We find no evidence for a wind nebula associated with the pulsar. The shape, luminosity, and spectrum of a PWN depend on the angular distribution, magnetization and energy spectrum of the unshocked wind, as well as on the pulsar velocity and the properties of the ambient medium. Therefore, the absence of a nebula down to a fairly deep limit of ergs s-1, corresponding to of the pulsar’s , implies that the combination of low ambient density, moderate space velocity, and/or unfavorable wind geometry are insufficient to drive an X-ray-luminous bow shock.
Owing to its proximity, PSR J1023+0038 is one of the best-suited targets for studies of these rare “transition” systems and thus warrants further X-ray observations, especially in combination with optical spectroscopy and -ray variability study (see Tam et al., 2010, for the recent detection of this system with the Fermi Large Area Telescope). Constraining the properties of the intrabinary shock in J1023+0038 and similar systems has important implications for understanding the X-ray properties of accreting MSPs in quiescence, such as the prototypical SAX J1808.4–3658 (Wijnands & van der Klis, 1998). It has been suggested that the non-thermal X-ray radiation observed from certain quiescent low-mass X-ray binaries is also due to an active rotation-powered wind but this cannot be directly confirmed due to the absence of radio pulsations (Campana et al., 2004). Alternative scenarios such as on-going, low-level accretion (see, e.g., Garcia et al., 2001, and references therein) or a propeller regime (Wijnands, 2003, and references therein) have also been proposed as explanations for the non-thermal emission. An X-ray spectroscopic and variability study analogous to that presented above could reveal the signature of an interacting rotation-powered pulsar wind in such systems, thereby providing further evidence for the evolutionary relation of LMXBs and MSPs.
References
- Alpar et al. (1982) Alpar, M. A., Cheng, A. F., M. A. Ruderman, M. A., & Shaham, J. 1982, Nature, 300, 728
- Archibald et al. (2009) Archibald, A. M., et al. 2009, Science, 324, 1411
- Archibald et al. (2010) Archibald, A. M., Kaspi, V. M., Bogdanov, S., Hessels, J. W. T., Stairs, I. H., Ransom, S. M., McLaughlin, M. A., & Lorimer, D. 2010, ApJ, 722, 88
- Arons & Tavani (1993) Arons, J. & Tavani M. 1993, ApJ, 403, 249
- Bhattacharya & van den Heuvel (1991) Bhattacharya, D. & van den Heuvel, E. P. J. 1991, Phys. Rep. 203, 1
- Bogdanov et al. (2005) Bogdanov, S., Grindlay, J. E., & van den Berg, M. 2005, ApJ, 630, 1029
- Bogdanov et al. (2006) Bogdanov, S., Grindlay, J. E., Heinke, C. O., Camilo, F., Freire, P. C. C., & Becker, W. 2006, ApJ, 646, 1104
- Bogdanov et al. (2007) Bogdanov, S., Rybicki, G. B., & Grindlay, J. E. 2007, ApJ, 670, 668
- Bogdanov & Grindlay (2009) Bogdanov, S. & Grindlay, J. E. 2009, ApJ, 703, 1557
- Bogdanov et al. (2010) Bogdanov, S., van den Berg, M., Heinke, C. O., Cohn, H. N., Lugger, P. M., Grindlay, J. E. 2010, ApJ, 709, 241
- Bogdanov et al. (2011) Bogdanov, S., van den Berg, M., Heinke, C. O., Cohn, H. N., Lugger, P. M., & Grindlay, J. E. 2011, ApJ, in press
- Bond et al. (2002) Bond, H. E., White, R. L.; Becker, R. H.; O’Brien, M. S. 2002, ApJ, 114, 1359
- Camilo & Rasio (2005) Camilo. F. & Rasio, F. A. 2005, ASP Conf. Ser. Vol. 328: Binary Radio Pulsars, eds. F. A. Rasio & I. H. Stairs (San Francisco: ASP), p. 147
- Campana et al. (2004) Campana, S., D’Avanzo. P., Casares, J., Covino, S., Israel, G. L., Marconi, G., Hynes, R., Charles, P., Stella, L. 2004, ApJ, 614, L49
- Chatterjee & Cordes (2002) Chatterjee, S. & Cordes, J. M. 2002, 575, 407
- Cusumano et al. (2003) Cusumano, G., et al. 2003, A&A, 410, L9
- D’Amico et al. (2001) D’Amico, N., Lyne, A. G., Manchester, R. N., Possenti, A., & Camilo, F. 2001, ApJ, 548, L171
- Davis (2001) Davis, J. E. 2001, ApJ, 562, 575
- Fruchter et al. (1988) Fruchter, A. S., Stinebring, D. R., & Taylor, J. H. 1988, Nature, 333, 237
- Garcia et al. (2001) Garcia, M. R., McClintock, J. E., Narayan, R., Callanan, P., Barret, D., & Murray, S. S. 2001, ApJ, 553, L47
- Harding & Muslimov (2002) Harding, A. K. & Muslimov, A. G. 2002, ApJ, 568, 862
- Harding et al. (2005) Harding, A. K., Usov, V. V.; Muslimov, A. G. 2005, ApJ, 622, 531
- Heinke et al. (2007) Heinke, C. O., Jonker, P. G., Wijnands, R., Taam, R. E. 2007, ApJ, 660, 1424
- Heinke et al. (2009) Heinke, C. O., Jonker, P. G., Wijnands, R., Deloye, C. J., & Taam, R. E. 2009, ApJ, 691, 1035
- Hessels et al. (2011) Hessels, J. W. T., et al. 2011, AIPC, in press (arXiv:1101.1742)
- Hester et al. (1995) Hester, J. J., et al. 1995, ApJ, 448, 240
- Homer et al. (2006) Homer, L., Szkody, P., Chen, B., Henden, A., Schmidt, G., Anderson, S. F.; Silvestri, N. M., Brinkmann, J. 2006, AJ, 131, 562
- Huang & Becker (2010) Huang, R. H. H., & Becker, W. 2010, A&A, 510, 67
- Juda & Karovska (2010) Juda, M., & Karovska, M. 2010, BAAS, 41, 722
- Kargaltsev & Pavlov (2008) Kargaltsev, O., & Pavlov, G. G. 2008, AIPC, 983, 171
- Kennel & Coroniti (1984) Kennel, C. F., & Coroniti, F. V. 1984, ApJ, 283, 694
- Liedahl et al. (1995) Liedahl, D. A., Osterheld, A. L., and Goldstein, W. H. 1995, ApJ, 438, L115
- Mewe et al. (1985) Mewe, R., Gronenschild, E. H. B. M., & van den Oord, G. H. J. 1985, A&AS, 62, 197
- Mewe et al. (1986) Mewe, R., Lemen, J. R., & van den Oord, G. H. J. 1986, A&AS, 65, 511
- Michel (1994) Michel, F. C. 1994, ApJ, 431, 397
- Narayan et al. (1997) Narayan, R., Garcia, M. R., & McClintock, J. E. 1997, 478, 79
- Paltani (2004) Paltani, S. 2004, A&A, 420, 789
- Pavlov et al. (2007) Pavlov, G. G., Kargaltsev, O., Garmire, G. P., & Wolszczan, A. 2007, ApJ, 664, 1072
- Pellizzoni et al. (2009) Pellizzoni, A., et al. 2009, ApJ, 695, L115
- Rybicki & Lightman (1979) Rybicki, G. B. & Lightman, A. P. 1979, Radiative Processes in Astrophysics (New York: Wiley)
- Stappers et al. (2003) Stappers, B. W., Gaensler, B. M., Kaspi, V. M., van der Klis, M., & Lewin, W. H. G. 2003, Science, 299, 1372
- Szkody et al. (2003) Szkody, P., et al. 2003, ApJ, 126, 1499
- Tam et al. (2010) Tam, P. H. T., Hui, C. Y.. Huang, R. H. H., Kong, A. K. H., Takata, J., Lin, L. C. C., Yang, Y. J., Cheng, K. S., & Taam, R. E. 2010, ApJ, 724, 207
- Tavani & Brookshaw (1991) Tavani, M., & Brookshaw, L. 1991, ApJ, 381, L21
- Thornstensen & Armstrong (2005) Thorstensen, J. R. & Armstrong, E. 2005, AJ, 130, 759
- Wang et al. (2009) Wang, Z., Archibald, A. M., Thorstensen, J. R., Kaspi, V. M., Lorimer, D. R., Stairs, I., Ransom, S. M. 2009, ApJ, 703, 2017
- Wijnands & van der Klis (1998) Wijnands, R., & van der Klis, M. 1998, Nature, 394, 344
- Wijnands (2003) Wijnands, R. 2003, ApJ, 588, 425
- Wijnands (2010) Wijnands, R. 2010, HiA, 15, 121
- Zavlin et al. (1996) Zavlin, V. E., Pavlov, G. G., & Shibanov, Yu. A. 1996, A&A, 315, 141
- Zacharias et al. (2004) Zacharias, N., Monet, D. G., Levine, S. E., Urban, S. E., Gaume, R., & Wycoff, G. L. 2004, BAAS, 36, 1418
- Zavlin (2006) Zavlin, V. E. 2006, ApJ, 638, 951