Rotons in interacting ultracold Bose gases
Abstract
In three dimensions, non-interacting bosons undergo Bose-Einstein condensation at a critical temperature, , which is slightly shifted by , if the particles interact. We calculate the excitation spectrum of interacting Bose-systems, 4He and 87Rb, and show that a roton minimum emerges in the spectrum above a threshold value of the gas parameter. We provide a general theoretical argument for why the roton minimum and the maximal upward critical temperature shift are related. We also suggest two experimental avenues to observe rotons in condensates. These results, based upon a Path-Integral Monte-Carlo approach, provide a microscopic explanation of the shift in the critical temperature and also show that a roton minimum does emerge in the excitation spectrum of particles with a structureless, short-range, two-body interaction.
pacs:
03.75.Hh, 03.75.Kk, 05.30.JpAppearance of a roton minimum Feynman1998 in the excitation spectrum is an essential part of the phenomenology of superfluidity. Bogoliubov derived Bogoliubov1947 the excitation spectrum of a weakly interacting boson system for small momenta
| (1) |
where denotes the free-particle energy, is the particle density, measures the interaction strength, and is the mass of a particle. The two-body interaction is approximated by a repulsive -potential with strength determined by the -wave scattering length, .
The importance of interactions on the macroscopic scale is characterised by the gas parameter, , which is proportional to the ratio of the volume occupied by the particles compared to that available to them. Bose-Einstein condensates in ultra-cold gases are usually in the weakly interacting limit Cornell2002 ; and away from the Feschbach resonance experiments could only explore the dilute limit, Anderson1995 . However the use of Feshbach resonances in 85Rb has facilitated the creation of condensates with tunable values of up to approximately Papp2008 . In condensates of 7Li, values of up to have been achieved Pollack2009 , although with non-uniform density distribution due to trapping. We note here that is not at all small, , in the case of liquid 4He Reppy2000 ; Leggett2001 .
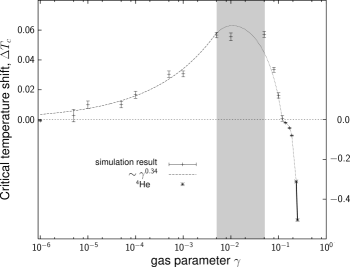
Interactions also induce a shift in the condensation critical temperature, , which was first reported for the 4He-Vycor system Reppy2000 confirming earlier theoretical predictions Stoof1992 ; Bijlsma1996 ; Gruter1997 ; Holzmann1999 ; Arnold2001 ; Kashurnikov2001
| (2) |
where is the critical temperature of an ideal Bose-gas with the same density and is a positive dimensionless constant. Different theoretical approaches aimed at determining this dimensionless constant resulted in significant discrepancy for some time, with consensus finally provided by Monte Carlo simulations Kashurnikov2001 .
For small , the Bogoliubov spectrum (1) accurately describes the excitation spectrum, while for larger , such as in liquid 4He, it deteriorates and a roton minimum is observed Henshaw1961 . Path integral Monte Carlo calculations Gruter1997 ; Pilati2008 and an experiment Reppy2000 have shown that equation (2) becomes invalid for . For even higher , the system freezes and the roton minimum goes soft.
In fact, , has a maximum when as can be seen in Fig. 1. Since the onset of condensation is associated with the energies of available states, we might postulate the peak in to be accompanied by the transition to the roton regime as increases. Below we substantiate this claim.
Contrary to earlier studies in which the condensate was rotating fast Sinha2005 or particles had laser-induced dipole moments ODell2003 , we show that the roton minimum may also occur in a homogeneous system where the two-body interaction is short-range and structureless. This fact may give hope for indirectly observe rotons in Bose-Einstein condensates utilising already existing experimental aparatus. Moreover, our simulations imply that the excitation of rotons is also connected to the shift of the critical temperature of condensation scrutinized in earlier studies.
Theoretical model: We assume that our system can be described using only two-body interaction potentials between the constituents and can be modelled by the hard-sphere potential with diameter . We have varied , while keeping constant, to sample different values of . The systems were homogeneous and periodic boundary condition have been applied.
Numerical details: We have carried out path integral Monte Carlo (PIMC) simulations Ceperley1995 for both 4He and 87Rb in order to determine the energy spectrum, . The configurations of the system are sampled via the density matrix. Although the exact density matrix is only available at high temperature, the low temperature density matrix can be constructed by convolution of a sufficient number of high temperature density matrices. This iteration forms the basis of PIMC simulations.
In our simulations, we used 128 (4He) or 64 (87Rb) particles with 64 density matrices and ensured that increasing the number of density matrices did not alter the final result. Number densities and temperatures of , 10nK (4He) and , 8 nK (87Rb) are utilised. The density for 87Rb is at the lower end of those reported in experiments Anderson1995 ; Thompson2005 , while the 4He density is similar for comparison. Simulations with realistic liquid 4He density have also been carried out with similar conclusion presented below.
Analysis: The essential object of our analysis is the static pair correlation function, , which is proportional to the probability of finding two atoms at a distance from each other. PIMC methods are well suited for the calculation of from which the static structure factor can also be acquired via Feenberg1969 . Finally, is linked to the excitation spectrum by the following relation Bijl1940 ; Feynman1954
| (3) |
providing an upper bound on .
Due to the finite size of the system, can only be calculated over a limited range (repeated use of the periodic boundary condition would lead to unphysical spatial correlation). One may assume that for some cut-off , however, this approach introduces a non-continuous step in at and leads to unacceptable error in below . The truncation error can be suppressed by varying the cut-off, , and taking the average of the values of obtained this way.
An alternative is to fit a trial function to . The trial function used below has been derived from the Ornstein-Zernike equation with the Percus-Yevick (PY) closure Percus1958 providing the analytical, but implicit solution , where stands for the inverse Laplace-transform and is known explicitly Wertheim1963 ; Thiele1963 . The function, , has a pole at the origin, , and infinitely many distinct conjugate pairs of poles, (1, 2, …). The distribution of these zeros completely determines , and thus all thermodynamical quantities of the system, for a fixed value of . Figure 2 depicts the real part of the three lowest lying zeros, while the inset shows all the zeros over the complex plane in the region [-12, 0] []. For moderate values of only contributes significantly Nezbeda1974 and dominates the asymptotic behaviour as
| (4) |
In Fig. 2 the real parts of the first three lowest lying poles are shown. One may notice that approaches zero rapidly, and therefore the corresponding oscillatory contribution to is only weakly damped. The imaginary part (smaller inset) determine the angular wavenumber of the oscillatory contribution. The smallest imaginary part, , falls between and providing a characteristic wavenumber, i.e. a broad qualitative estimate on where the roton minimum may occur, i.e. between and .

In order to check our PIMC results and also to smooth the simulation data of we determine the fitting parameters , , , and for each value of . Although and could be determined from , we treat them as free parameters, and compare their fitted values to those the pole-structure suggests. The comparison provides a test of the accuracy of our PIMC calculation. Satisfactory agreement between the fitted function and raw data can be seen in Fig. 3. The advantage of using the fitted is that it can be extrapolated to larger system sizes and its derivative may be easily calculated.


The key result of our work, the excitation spectra of 4He and 87Rb can be seen in Fig. 4. The maximum in occurs at , while we find that the roton minimum appears at . Although the onset of the roton minimum does not appear to directly coincide with the maximum of , the minimum is preceded by another qualitative change, namely the development of a point of inflection in . By taking the second derivative of , as shown in the inset of Fig. 4(a), we can determine the approximate value of for which the spectrum develops this inflection point. The data indicate that this occurs approximately at which falls exactly into the region where the critical temperature reaches its maximum.
The connection between the development of the inflection point and the maximum of may be illuminated by the following argument. At temperature the occupancy of a state with energy is determined by the Bose-Einstein distribution, . Bose-Einstein condensation occurs if the ground state is macroscopically occupied, i.e. the number of particles in any excited states, , is saturated
| (5) |
It is tacitly assumed that the chemical potential has reached its maximum value. The critical temperature, , is thus determined by the excitation spectrum via the density of states, . If increases for thermally available states, then the temperature must be decreased to reduce and preserve the validity of inequality (5). The critical temperature should therefore decrease as well. The density of states corresponds to , which is the reciprocal of the slope of the excitation spectrum.
For weakly interacting bosons, Bogoliubov’s result (1) indicates that increasing increases the slope of , thus must decrease around . We can therefore conclude that the critical temperature of a weakly interacting Bose-gas must be positive. As increases, develops an inflection point and becomes convex in a certain region. The decrease of the slope in this region opens an abundance of excited states for the particles, manifested as a peak in . These excited states can be populated at lower temperature, thus reducing the population of the ground state. Therefore the system has to be further cooled for macroscopical occupation of the ground state. Consequently, the critical temperature must decrease, resulting in decreasing also.
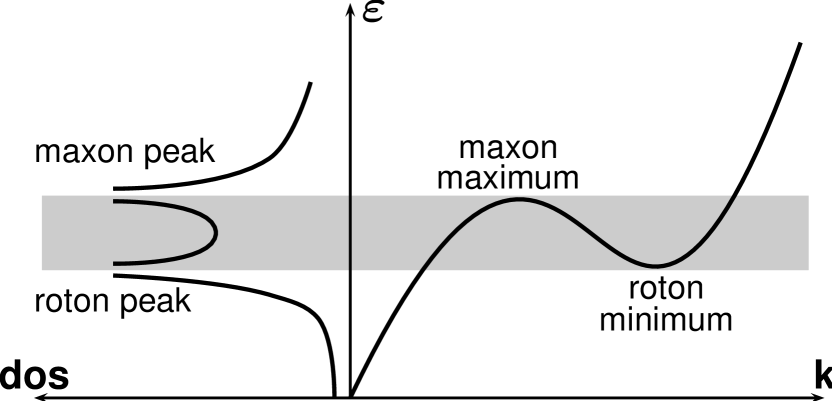
As increases further, the inflection gives rise to the roton minimum in the spectrum for non-vanishing momenta. Although the magnitude of the derivative starts to increase along the sides of the minimum, the density of states continues to increase, as there are now three sets of states which contribute to the density of states for a given energy (See Fig. 5).
Recently, a similar conjecture has been made in the context of two-dimensional dipolar systems Filinov2010 . The interaction parameter corresponding to our is the dipole coupling . As increases the critical temperature developes a maximum. The authors mentioned the apparent coincidence of this maximum and the onset of the roton minimum, although they have not investigated this in detail. We note that their system and ours are dissimilar in two important aspects: dimensionality and the nature of interaction. Dimensionality is significant in that it influences which phases appear in the system, e.g. Berezinksii-Kosterlitz-Thouless phase Berezinskii1971 ; Berezinskii1972 ; Kosterlitz1973 rather than BEC. However the nature of the interactions –we feel– is more fundamental. The two-body interaction in our analysis is spherically symmetric, structureless and short-range, while their dipole interaction has strong angular dependence and long range influence. It is far from obvious a priori that hard core bosons, therefore, should establish a roton structure in the excitation spectrum at all, let alone that its appearance should correspond to the shift of the critical temperature.
Experimental verification of the predicted onset of the roton minimum may be possible by utilising a Feshbach resonance to tune the interaction strength and then using Bragg spectroscopy to probe the excitation spectrum. The values of achieved by Papp et. al. Papp2008 approach the lower end of values for which we predict the inflection point in to occur, while Bragg spectroscopy has previously been used to measure the excitation spectrum of a weakly interacting BEC Steinhauer2002 .
As a second scenario, quantum evaporation could be adapted for pancake shaped Bose-Einstein condensates. This technique proved to be a successful experimental method in the case of liquid 4He Hope1984 . An excitation having enough energy is capable of ejecting an atom from the condensate. However, phonons and rotons carry different momenta at the same energy, therefore the ejected atoms have different angular distribution depending on which type of excitations they interacted with. Therefore detecting the angular distribution of ejected atoms after exciting the condensate in a controlled manner, could prove the existence of rotons in BECs.
In this Letter, we have shown that the maximum observed in of an interacting BEC is related to the appearance of an inflection point in . As increases the inflection point signals the appearance of a roton minimum, characteristic of the excitation spectrum of e.g. superfluid 4He. We have also provided a physical argument as to why this happens and how it could be observed experimentally.
Acknowledgements.
We greatfully acknowledge the discussion with Jean Dalibard. This work was supported under contract NERF-UOOX0703 and also by the University of Otago.References
- (1) R. P. Feynman, Statistical Mechanics: a set of lectures, 2nd ed. (Westview Press, 1998)
- (2) N. N. Bogoliubov, Journal of Physics 11, 23 (1947)
- (3) E. A. Cornell and C. E. Wieman, Rev. Mod. Phys. 74, 875 (August 2002), http://link.aps.org/doi/10.1103/RevModPhys.74.875
- (4) M. H. Anderson, J. R. Ensher, M. R. Matthews, C. E. Wieman, and E. A. Cornell, Science 269, 198 (1995)
- (5) S. B. Papp, J. M. Pino, R. J. Wild, S. Ronen, C. E. Wieman, D. S. Jin, and E. A. Cornell, Phys. Rev. Lett. 101, 135301 (Sep 2008)
- (6) S. E. Pollack, D. Dries, M. Junker, Y. P. Chen, T. A. Corcovilos, and R. G. Hulet, Phys. Rev. Lett. 102, 090402 (Mar 2009)
- (7) J. D. Reppy, B. C. Crooker, B. Hebral, A. D. Corwin, J. He, and G. M. Zassenhaus, Phys. Rev. Lett. 84, 2060 (March 2000), http://link.aps.org/doi/10.1103/PhysRevLett.84.2060
- (8) A. J. Leggett, Rev. Mod. Phys. 73, 307 (April 2001), http://link.aps.org/doi/10.1103/RevModPhys.73.307
- (9) H. T. C. Stoof, Phys. Rev. A 45, 8398 (June 1992), http://link.aps.org/doi/10.1103/PhysRevA.45.8398
- (10) M. Bijlsma and H. T. C. Stoof, Phys. Rev. A 54, 5085 (December 1996), http://link.aps.org/doi/10.1103/PhysRevA.54.5085
- (11) P. Grüter, D. Ceperley, and F. Laloë, Phys. Rev. Lett. 79, 3549 (1997)
- (12) M. Holzmann and W. Krauth, Phys. Rev. Lett. 83, 2687 (October 1999)
- (13) P. Arnold and G. Moore, Phys. Rev. Lett. 87, 120401 (August 2001), http://link.aps.org/doi/10.1103/PhysRevLett.87.120401
- (14) V. A. Kashurnikov, N. V. Prokof’ev, and B. V. Svistunov, Phys. Rev. Lett. 87, 120402 (August 2001), http://link.aps.org/doi/10.1103/PhysRevLett.87.120402
- (15) D. G. Henshaw and A. D. B. Woods, Phys. Rev. 121, 1266 (Mar 1961)
- (16) S. Pilati, S. Giorgini, and N. Prokof’ev, Phys. Rev. Lett. 100, 140405 (Apr 2008)
- (17) S. Sinha and G. V. Shlyapnikov, Phys. Rev. Lett. 94, 150401 (April 2005)
- (18) D. H. J. O’Dell, S. Giovanazzi, and G. Kurizki, Phys. Rev. Lett. 90, 110402 (March 2003), http://link.aps.org/doi/10.1103/PhysRevLett.90.110402
- (19) D. M. Ceperley, Rev. Mod. Phys. 67, 279 (1995)
- (20) S. T. Thompson, E. Hodby, and C. E. Wieman, Phys. Rev. Lett. 95, 190404 (Nov 2005)
- (21) E. Feenberg, Theory of Quantum Fluids (Academic Press, New York, 1969)
- (22) A. Bijl, Physica 7, 869 (November 1940)
- (23) R. P. Feynman, Phys. Rev. 94, 262 (April 1954), http://link.aps.org/doi/10.1103/PhysRev.94.262
- (24) J. K. Percus and G. J. Yevick, Phys. Rev. 110, 1 (Apr 1958)
- (25) M. S. Wertheim, Phys. Rev. Lett. 10, 321 (April 1963), http://link.aps.org/doi/10.1103/PhysRevLett.10.321
- (26) E. Thiele, J. Chem. Phys. 39, 474 (1963), http://link.aip.org/link/JCPSA6/v39/i2/p474/s1
- (27) I. Nezbeda, Chech. J. Phys. Sect. B 19, 411 (1974)
- (28) A. Filinov, N. V. Prokof’ev, and M. Bonitz, Phys. Rev. Lett. 105, 070401 (Aug 2010)
- (29) V. L. Berezinskii, Sov. Phys. JETP 32, 493 (1971)
- (30) V. L. Berezinskii, Sov. Phys. JETP 34, 610 (1972)
- (31) J. M. Kosterlitz and D. J. Thouless, J. Phys. C: Solid State Phys. 6, 1181 (1973)
- (32) J. Steinhauer, R. Ozeri, N. Katz, and N. Davidson, Phys. Rev. Lett. 88, 120407 (Mar 2002)
- (33) F. R. Hope, M. J. Baird, and A. F. G. Wyatt, Phys. Rev. Lett. 52, 1528 (April 1984), http://link.aps.org/doi/10.1103/PhysRevLett.52.1528