Deep Chandra Observations of Edges and Bubbles in the NGC 5846 Galaxy Group
Abstract
We use a combined ks Chandra exposure to analyze X-ray edges produced by non-hydrostatic gas motions (sloshing) from galaxy collisions, and cavities formed by AGN activity. Evidence for gas sloshing is seen in the spiral morphology and multiple cold front edges in NGC 5846’s X-ray surface brightness distribution, while lack of spiral structure in the temperature map suggests the perturbing interaction was not in the plane of the sky. Density and spectral modeling across the edges indicate that the relative motion of gas in the cold fronts is at most transonic. Evidence for AGN activity is seen in two inner bubbles at kpc, filled with GHz and GHz radio plasma and coincident with H emission, and in a ghost bubble at kpc west of NGC 5846’s nucleus. The outburst energy and ages for the inner (ghost) bubbles are ergs and Myr ( ergs and Myr),respectively, implying an AGN duty cycle of Myr. The inner bubble rims are threaded with knots, whose total keV X-ray luminosity is erg s-1 , a factor less than that of the surrounding rims, and keV mean temperature is indistinguishable from that of the rims. We suggest that the knots may be transient clouds heated by the recent passage of a shock from the last AGN outburst. We also observe gas stripping from a cE galaxy, NGC 5846A, in a kpc long () hot gas tail, as it falls towards NGC 5846.
Subject headings:
galaxies: clusters: general – galaxies:individual (NGC 5846) – galaxies: intergalactic medium – X-rays: galaxies1. INTRODUCTION
Over the past decade, deep X-ray observations of significant substructure in the hot gas near the centers of rich clusters have revolutionized our understanding of the evolution of clusters and the galaxies at their cores. Sharp surface brightness discontinuities (edges) are found where the increase in density across the discontinuity is accompanied by a decrease in temperature, opposite to that expected from shocks. These ‘cold fronts’ provide evidence for an ongoing subcluster merger or non-hydrostatic motions of the gas (‘sloshing’) from a prior disturbance in the core (see, e.g. the review by Markevitch & Vikhlinin 2007). Furthermore, episodic outbursts from the active galactic nucleus (AGN) at the centers of the dominant galaxies in groups and clusters, are revealed by outflow shocks and X-ray cavities (deficits in X-ray surface brightness) in the intra-cluster medium (ICM) (see, e.g. Fabian et al. 2003 for the core of the Perseus cluster, Forman et al. 2005 for M87 in the Virgo Cluster). These X-ray cavities correspond to regions where the hot cluster gas has been evacuated by jets from AGN outbursts and the interior of the cavity (bubble) is filled with radio plasma. After an initial momentum driven formation stage, the ’bubble’ of radio plasma rises buoyantly in the group/cluster atmosphere. This feedback between the central AGN and its environment may be key to resolving the cooling flow problem in galaxy clusters, and and may be an essential ingredient in the emerging models for the coevolution of galaxies and their central supermassive black holes (e.g. Best et al. 2006; Croton et al. 2006). While these phenomena have been studied in high angular resolution, deep X-ray observations for many rich clusters (e.g. McNamara et al. 2000; Nulsen et al. 2002; Birzan et al. 2004; Nulsen et al. 2005; McNamara et al. 2005; Allen et al. 2006), their impact on structure formation in the much more common cores of galaxy groups has received far less attention (however, see e.g. Machacek et al. 2010 for the Telescopium group; Gitti et al. 2010 for HCG 62; Randall et al. 2011 for the NGC 5813 group; David et al. 2011 for the NGC5044 group). Yet, it is in groups at high redshift where galaxy evolution is most rapid (Cooper et al. 2006), gas-rich mergers are more common, and, since the gravitational potential is shallower, outbursts from supermassive black holes (SMBHs) may have a greater effect on the surrounding gas than in their richer cluster cousins.
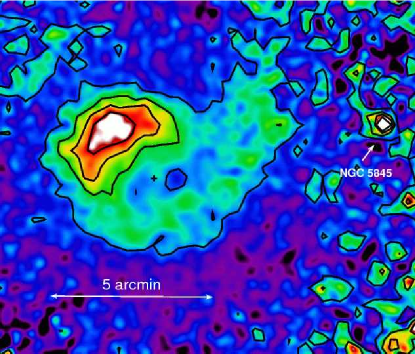
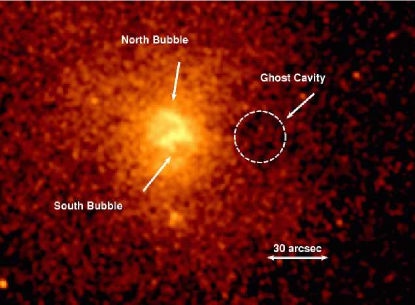
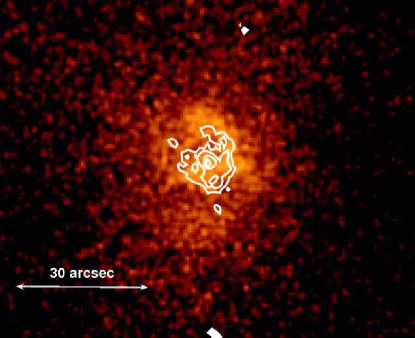
In this paper we present results from the combined ks Chandra observation of the NGC 5846 group. The Digital Sky Survey (DSS) image is shown in Figure 1. Since the NGC 5846 group is only Mpc distant (Tonry et al. 2001), this exposure is one of the deepest high angular resolution X-ray observations of any nearby group of galaxies. The NGC 5846 group consists of bright () galaxy members with a group velocity dispersion of km s-1 (Zabludoff & Mulchaey 1998; Mulchaey et al. 2003). Previous X-ray studies using the Einstein X-ray Observatory (Forman, Jones & Tucker 1985; Biermann, Kronberg & Schmutzler 1989) and using ROSAT and ASCA (Finoguenov et al. 1999 and Trinchieri et al. 1997), show keV diffuse group X-ray emission extending to kpc () from the central, brightest group galaxy NGC 5846 and a total X-ray luminosity within kpc of erg s-1 (Mulchaey et al. 2003). From combined optical and X-ray studies using ROSAT, ASCA and XMM-Newton data, Mahdavi, Trentham & Tulley (2005) found that the NGC 5846 group may be part of a larger () structure, sharing a common Mpc diameter dark matter halo with the NGC 5813 group located kpc away in projection, and that group membership is overwhelmingly dominated by dwarf elliptical galaxies (), similar to that seen in the Virgo cluster. There is, however, no evidence for interaction between the NGC 5846 and NGC 5813 groups (Randall et al. 2011).
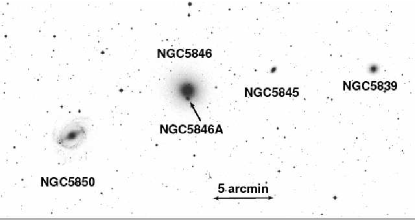
NGC 5846 is a giant E0 elliptical galaxy with an effective radius of kpc (Bender et al. 1992) and an absolute V magnitude of (Faber et al. 1989), comparable to M87 (M), the giant elliptical galaxy in the Virgo Cluster. However, in contrast to M87 whose central velocity dispersion suggests a black hole mass of at least , NGC 5846’s central velocity dispersion of km s-1 corresponds to a supermassive black hole mass of , an order of magnitude smaller (Tremaine et al. 2002; Gebhardt & Thomas 2009). Radio emission from the nuclear region of NGC 5846 is complex, with a central compact, possibly variable, steep spectrum () radio source with radio fluxes of mJy ( mJy) at GHz ( GHz), likely associated with an AGN. Three additional radio components are seen in , , and GHz VLBA maps roughly aligned in the north-south direction with the nuclear emission (Filho et al. 2004). These regions, extended on milli-arcsecond scales, may either be compact supernova remnants or emission from a jet (Filho et al. 2004). XMM-Newton observations suggest at least surface brightness discontinuities (edges) in the gas surrounding NGC 5846 (Finoguenov et al. 2006). Such discontinuities indicate gas motions. These may be residual gas ‘sloshing’ from a previous galaxy merger or from a high velocity galaxy encounter with the large, HI rich, barred spiral galaxy NGC 5850, located ( kpc in projection) to the east (see Fig. 1). The large shift of HI gas to the west and northwest in NGC 5850, in the direction of NGC 5846, and NGC 5850’s distorted stellar arms and spurs, also to the west, suggest a recent ( Myr) tidal interaction between the two galaxies (Higdon et al. 1998).
Non-hydrostatic gas motions also could be induced by AGN activity. A previous short ( ks) Chandra X-ray observation of NGC 5846 shows bright, knotty-rimmed X-ray cavities associated with radio lobes in NGC 5846’s central kpc (Trinchieri & Goudfrooij 2002; Allen et al. 2006). Extensive filamentary H + [NII] line emission and dust also are found in the central region of the galaxy, highly correlated with the X-ray emission (Goudfrooij & Trinchieri 1998). Spitzer MIPS observations of NGC 5846 show extended dust emission to a FWM kpc, suggesting that dust, originating from stellar mass loss from evolved AGB stars, accumulated in the cental kpc of that galaxy and was subsequently transported buoyantly to these larger radii by AGN activity (Temi et al. 2007).
In this paper we use the combined ks Chandra exposure to study in detail the X-ray cavities and surface brightness edges that chronicle AGN activity in NGC 5846 and the relative motions between the galaxy ISM and group gas. In §2 we summarize our observational data reduction and analysis techniques. In §3 we analyze the large scale surface brightness and temperature structure in the core of the NGC 5846 group, discuss evidence for gas sloshing, and model the density, temperature and pressures across observed surface brightness edges. In §4 we focus on the properties of the system of AGN outburst cavities near the center of NGC 5846. In §5 we also present the first observation of gas stripping from a compact elliptical galaxy, NGC 5846A, during its’ infall towards NGC 5846. Our conclusions are summarized in §6. Unless otherwise indicated, quoted uncertainties are CL for spectra and for photon counts. For the standard dominated cold dark matter cosmology ( km s-1 Mpc-1 , , ) and assuming NGC 5846 is at rest at the center of the group potential, the luminosity distance to NGC 5846 is Mpc, and kpc (Wright 2006). This is consistent within uncertainties with the luminosity distance determined from surface brightness fluctuations (Tonry 2001).
2. OBSERVATIONS AND DATA REDUCTION
NGC 5846 was observed with the Chandra X-ray Observatory for s on 2000 January 24 (obsid 788) in FAINT mode with ACIS-S at aimpoint, and for s on 2007 June 12 (obsid 7923) in VFAINT mode with ACIS-I at aimpoint for a total of ks. The data were initially filtered to reject bad pixel grades (, , ) and data that fell on hot pixels. Data flagged in obsid 7923 (VFAINT mode) as having excessive counts in the border pixels surrounding event islands were also removed to optimize signal to noise at energies below keV. We then reprocessed these data with CIAO4.2 using standard tools and calibrations provided by the Chanda X-ray Center, applying corrections for the charge transfer inefficiency on the ACIS CCDs, the time-dependent build-up of contaminant on the optical filter, and the secular drift (tgain111see, http://cxc.harvard.edu/contrib/alexey/tgain/tgain.html) of the average pulse-height amplitude for photons of fixed energy. Periods of anomalously high particle count rates (flares) were excised using lc_clean and a clipping algorithm, resulting in useful exposures of s and s for obsid 778 and obsid 7923, respectively.
Backgrounds for the imaging and spectral analyses, where indicated, were drawn from the source free background data set222see http://cxc.harvard.edu/contrib/maxim/acisbg, i.e. period C ACIS-S ( period D ACIS-I) for OBSID 788 (7923), appropriate for our observation and instrument configuration, using the CIAO acis_bkgrnd_lookup tool. These data were reprocessed using the same gain files as used for the source data, reprojected to the aimpoint of the observation, and then normalized by comparing count rates in the keV energy band, where particle background dominates. This resulted in additional normalization factors of and for obsid 788 and obsid 7923, respectively. Since NGC 5846 lies close to the Northern Spur, there is an additional soft Galactic background component not accounted for in the blank sky background data. This Galactic component is expected to be uniform over the combined ACIS fields-of-view (FOVs). We model this background using the flux measured in a radius circular region on CCD6 centered at (, ), a distance of from NGC 5846 where group emission is expected to be small. This soft Galactic background component was also subtracted from the images analysed in §3. Instrument and exposure maps were generated in keV passband intervals from to keV and keV intervals from keV for both data sets using standard CIAO tools. Background-subtracted, exposure corrected images were constructed in various bandpasses and the data sets coadded for further analysis.
The CIAO tool wavdetect was run on the coadded, background-subtracted keV image to identify point sources, and the source regions were adjusted to eliminate overlapping regions. An ellipse slightly larger than the source region was generated as a background region for each source. Sources outside the central kpc () of NGC 5846, i.e. those not associated with knots on the inner bubble rims or NGC 5846’s nucleus, were excised from the data. The point source regions in the exposure-corrected images were then filled with events sampled from the corresponding background region around each source to produce the images of diffuse gas shown in §3.
Spectra were extracted from the point source cleaned event files using standard CIAO tools and fit with XSpec 11.3.0. Local background regions drawn from the ACIS-I detector are used, when possible, to mitigate the effects of the soft Galactic background. The spectra from both observations were fit jointly, when such a fit reduced uncertainties in the model parameters. Otherwise, we present only the long ks exposure (OBSID 7923) for our spectral analysis, because of its higher number of source counts.
3. Large Scale Structures
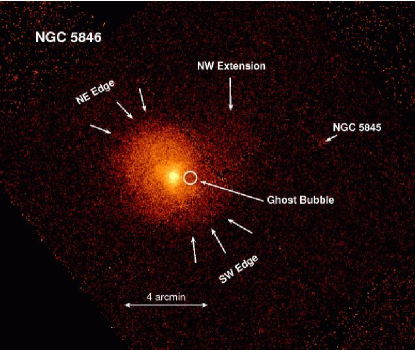
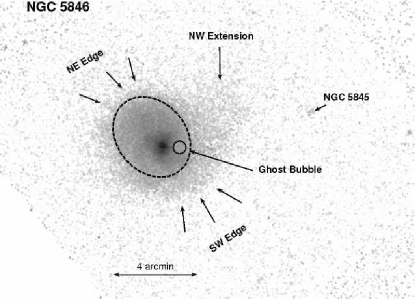
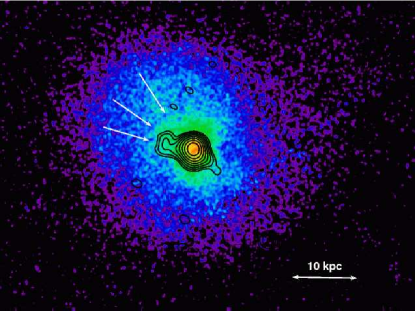
In Figure 2 we show the keV X-ray background subtracted, exposure corrected, coadded image of diffuse gas in and surrounding NGC 5846. The image has been binned by pixels into bins, and smoothed with a Gaussian kernel to highlight faint emission features outside the nuclear region of NGC 5846. The surface brightness distribution is brighter (gas denser) from kpc northeast of the nucleus than at similar distances to the southwest. Surface brightness discontinuities (edges) are found ( kpc) to the northeast and southwest of NGC 5846’s nucleus, with possible inner edges to the southwest at ( kpc) and to the northeast at ( kpc). In §3.3.1 we find that the ratio of gas density across these edges exceeds at confidence level in all cases, confirming that these discontinuities are significant. We also observe a tail-like feature of enhanced emission (NW extension) at significance in the flux over expected background, that extends ( kpc) to the northwest suggesting a spiral pattern. A roughly spherical deficit in X-ray surface brightness is found, at an significance in flux compared to neighboring regions, located ( kpc) west of the nucleus. In contrast to the inner X-ray cavities observed in previous studies (Trinchieri & Goudfrooij 2002; Allen et al. 2006), this X-ray cavity is not found coincident with radio synchrotron emission (see §4 and Fig. 11). Thus it is a ’ghost bubble’ where the electron population in the radio plasma, expected to fill the bubble, has aged such that the synchrotron emission has moved to lower frequencies that are more difficult to observe (Birzan et al. 2004). Diffuse X-ray emission is also observed from the neighboring galaxy NGC 5845.
3.1. Gas Densities: Evidence for Sloshing
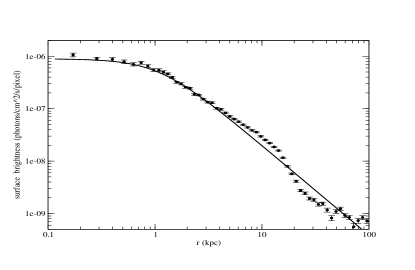
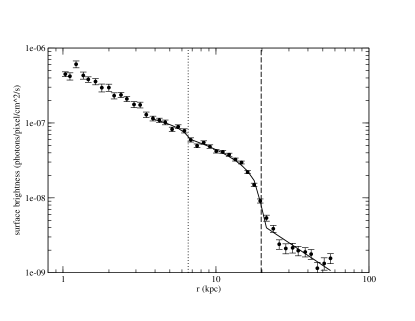
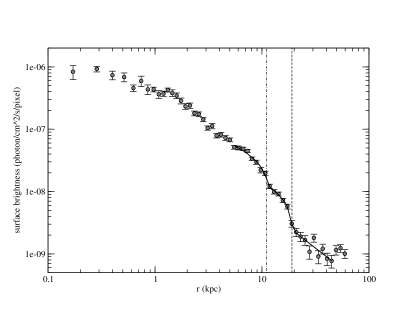
To investigate these asymmetries in more detail, we use SHERPA to fit a single component -model to the mean emission from NGC 5846 and then study deviations from this mean. In the upper panel of Figure 3, we show the keV azimuthally, averaged radial surface brightness profile, centered on the nucleus of NGC 5846 superposed with the best-fit single -model (solid line). We find that within kpc the surface brightness profile is best fit by a single -model with parameters , core radius kpc (), and central surface brightness photons s-1 cm-2 , corresponding to a central electron density of cm-3 . While is in reasonable agreement with previous ROSAT results (), we find a factor smaller core radius and infer a factor lower mean central electron density compared to previous results (Trinchieri et al. 1997; Osmond & Ponman 2004). These discrepancies are likely a reflection of the different angular resolution of the detectors and the failure of a single -model to describe the asymmetric surface brightness distribution.
In Figure 4 we present the fractional difference map between the observed data and the best-fit -dimensional -model for the group gas emission (i.e. left panel of Fig. 3). We see clearly the characteristic spiral pattern in surface brightness (and thus density) generated by ’sloshing’. Gas, initially displaced by the gravitational attraction and/or hydrodynamical forces from the off-axis encounter, is set into oscillation as the ram-pressure suddenly decreases and the gravitational potential energy and angular momentum imparted to the galaxy gas by the close encounter causes the higher density core gas to rebound and overshoot the center of the group dark matter potential (black cross in Fig. 4 east of the X-ray ‘ghost’ cavity) and also spiral outward (see, e.g. simulations by Ascasibar & Markevitch 2006; ZuHone et al. 2010). The faint northwest extension, identified in Figure 2 and seen clearly in Figure 4, is the tail of this spiral structure, as denser core gas is pushed to larger radii in response to the encounter. This tail-like structure is similar to that first found in the X-ray surface brightness map of the NGC 5098 group (Randall et al. 2009). In the lower panel of Figure 4, we show the simulated X-ray emission from a cluster merger adapted from Figure 19 of Ascasibar & Markevitch (2006), showing similar spiral density structure and a tail-like density enhancement caused by the non-hydrostatic bulk motions (sloshing) of gas in the cluster core. Since the simulation was for a more massive cluster merger we do not expect the scales to be the same. However, the similarity of our observation of sloshing in groups with features in simulations of galaxy cluster mergers demonstrates that such surface brightness features are common to off-axis galaxy, group and cluster encounters over a wide range of mass scales (see, e.g., Fig. 1 and Fig. 9 in Johnson et al. 2010 for galaxy cluster Abell 1644; Fabian et al. 2011 for the Perseus cluster; Randall et al. 2009 for the NGC 5098 galaxy group; Machacek et al. 2010 for the NGC 6868 group).
However, as also seen in Figure 19 of Acasibar & Markevitch (2006), the projected surface brightness and corresponding temperature features are highly dependent on the viewing angle between the plane of the encounter and the observer. If one ignores the NGC 5846 ghost bubble and the faint northwestern surface brightness tail, the image of NGC 5846 in Fig. 2 shows two ellipsoidal edges to the southwest and, although the inner features are less pronounced, at least two edges to the northeast. Such multiple surface brightness edges are also characteristic of gas sloshing (Markevitch et al. 2001) and are similar to the y projection of simulated cluster mergers in the right panel of Figure 19 from Ascasibar & Markevitch (2006). The orientation of the plane of the encounter, that caused gas sloshing in NGC 5846, with respect to the observer’s line of sight likely lies between the and simulation projections, such that the sloshing spiral is tilted with respect to the plane of the sky. This is consistent with the identification of the perturber as the disturbed spiral galaxy NGC 5850, whose relative radial velocity with respect to NGC 5846 is large ( km s-1 ). In this scenario, NGC 5850 would have approached in front of NGC 5846 from the west, measured relative to the elliptical galaxy, and is now receding behind NGC 5846 to the east.
3.2. Gas Temperatures
We need to understand the temperature structure of the gas to understand the thermodynamic state of the gas and determine relative gas pressures and velocities. We first extract a mean spectrum for NGC 5846 from OBSID 7923 using a circular region centered at NGC5846’s nucleus (RA, DEC , ) and local background from a circular annulus also centered at the galaxy nucleus, with inner, outer radii of , , respectively. We model the spectrum using a VAPEC model with fixed Galactic absorption ( cm-3 ), and allow
O, Mg, Si, and Fe abundances to vary independently. All other abundances are fixed at a common fixed value . We fit the spectrum over the keV energy range to optimize the signal relative to background. Although we find a mean temperature of keV, and O, Mg, Si,and Fe abundances of , , , and , respectively, this single temperature VAPEC model does not provide a statistically acceptable fit to the data (), suggesting the presence of multi-temperature gas and strong temperature gradients.
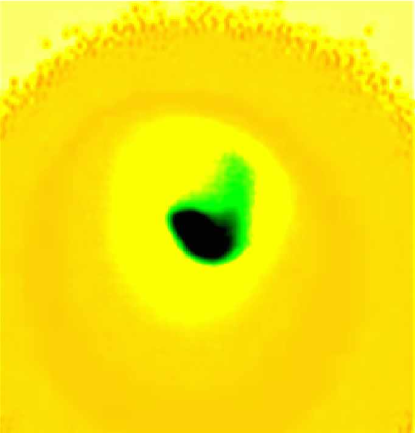
3.2.1 Temperature Maps
We investigate these temperature gradients by constructing a temperature map for the region. From the azimuthally averaged global temperature, we know that the temperature of the ISM and group IGM gas are both cool. The thermal spectrum for gas temperatures keV is dominated by line emission from the the FeL complex. For the ACIS detector, there is a nearly linear correspondence between the mean energy measured in the FeL peak ( keV) and the temperature of the gas, as measured by a single temperature APEC model (see, e.g. David et al. 2009; Machacek et al. 2010, Fig. 9). We exploit this correspondence to construct a temperature map for the core of the NGC 5846 group. We first calibrate the temperature of the gas with the observed mean energy in the keV bandpass by fitting a series of simulated absorbed APEC model spectra, generated from the spectral response files for our observation, for which the mean energy in the Fe peak increases from keV to keV in keV intervals. We assume Galactic absorption and fix the abundance at an average value of . Although this is higher than the metallicities observed near in the intra-group gas in other cool groups (Rasmussen & Ponman 2007), and lower than the mean metallicity for ISM gas in elliptical galaxies, the temperature is insensitive to changes in the abundance over this range, so that this does not significantly affect our results. We average the energy over regions determined by adaptively smoothing the keV Chandra image of the NGC 5846 group and use the derived calibration curve to associate the mean energy in each region to the corresponding temperature of the diffuse gas. Our results are shown in Figure 5.
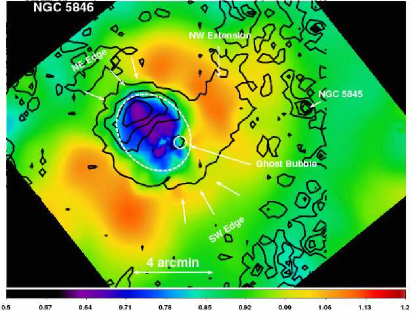
To check these results and investigate possible temperature structure within the central region of NGC 5846, we construct a second temperature map using the methods of Randall et al. (2009) to fit a single temperature APEC model with Galactic absorption to regions, containing a minimum of counts, grown around each pixel. The abundance is allowed to freely vary. The results are shown in the top panel of Figure 6. The temperature maps in Figures 5 and 6 are remarkably similar, suggesting that the features identified are robust. To guide the eye in both maps, we superpose the contours from the fractional difference map that shows the spiral structure in the X-ray surface brightness (Fig 4). The dashed ellipse in both maps traces the outer northeast and inner southwest surface brightness edges. Note that the nucleus of the galaxy, corresponding to the X-ray bright AGN, is offset from the center of the ellipse. Lower temperatures are found interior to this ellipse and to the northeast of the nucleus, confirming that these edges are cold fronts. The
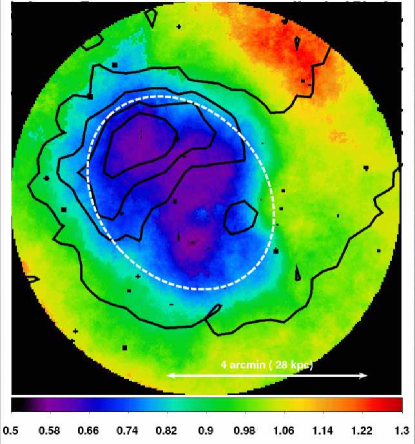
gas temperature is again higher ( keV) on the outside of the outer southwestern edge, confirming that this edge is also a cold front. Most of the lowest temperature ( keV) gas resides northeast of the nucleus, along the contours of maximal fractional difference from the best fit -model for the X-ray surface brightness. A finger of slightly higher ( keV) temperature gas is drawn into the nuclear region. Cluster simulations also show that sloshing bulk gas motions create multiple edges and may push higher temperature gas into the cooler cluster cores. Note, however, that there is no evidence for spiral structure in these temperature maps corresponding to the large scale spiral-like northwest extension seen in the X-ray surface brightness. This is in sharp contrast to the cool, spiral-like tails observed in the NGC 5098 (Randall et al. 2009) and NGC 6868 (Machacek et al. 2010) groups, and would be difficult to explain if the sloshing encounter occurred in the plane of the sky (Ascasibar & Markevitch 2006; ZuHone et al. 2010), again suggesting projection effects are important.
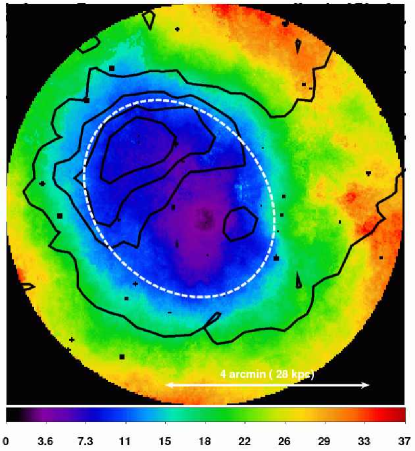
A map of ’pseudo’ entropy () is shown in the lower panel of Figure 6. This map is constructed by using the best-fit APEC model normalization , where
| (1) |
as a proxy for for each of the spectral regions in the temperature map. and are the angular size distance and redshift of NGC 5846, respectively, and for simplicity we assume a constant emission volume for each region. As expected, the lowest entropy gas is found coincident with NGC 5846’s central region. Entropy increases smoothly with radius. However, the distribution is not azimuthally symmetric, but again follows the off-centered ellipse (dashed line) that traces the northeastern outer and southwestern inner edges. While this map is suggestive, it provides only a qualitative picture for entropy throughout the region. First, the uncertainties in the abundances for spectral regions containing only source counts are large. Although the model temperatures do not vary significantly with abundance in this range, the normalization in equation 1 does by a factor of for keV gas and abundances between (see, e.g. Machacek et al. 2006). This increases the uncertainty in the derived density to and in the derived entropy to . Second, the true geometries (volumes) of the emission regions in the disturbed gas are likely complex, as demonstrated by gas distributions in the cores of simulated clusters (see, e.g. Ascasibar & Markevitch 2006; ZuHone & Markevitch 2009; ZuHone et al. 2010), and may not be well represented by the simple model used to construct the maps. Thus the qualitative features shown in these maps need to be checked by more targeted spectral analysis and modeling.
3.2.2 Modeling Abundances
Since we want to constrain the relative densities between differing spectral regions as well as possible, we choose to use the VAPEC thermal plasma model for detailed spectral fits. To optimize signal to noise, the fit range is restricted to the keV band, where emission from cool kev gas dominates. Guided by the temperature maps in Figures 5 and 6, we extract the spectrum for an X-ray luminous region expected to be homogeneous in temperature, defined as the sum of two circular regions with radius of centered at (, ) and centered at (, ), respectively. We model the spectrum of this region using an absorbed VAPEC model with fixed Galactic absorption, but with the abundances for O, Mg, Si, and Fe, expected to be important for low temperature gas, free to vary. The remaining abundances for elements that do not have strong emission features in the keV energy band are fixed at . We find a temperature of keV and O, Mg, Si, and Fe abundances of , , , and , respectively (). We then fix the metal abundances at these values in our spectral models for the less luminous features.
3.2.3 Azimuthally Averaged Temperature Profile
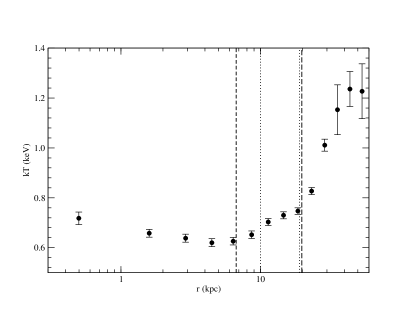
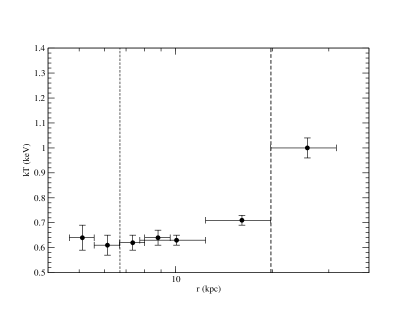
In Figure 7, we show the azimuthally averaged temperature profile of NGC 5846 to a maximum radius of kpc using circular annuli, with logarithmically increasing bin width ranging from ( kpc) for the innermost bin to ( kpc) for the outermost bin (see Table 1). The local background for all bins was chosen to be a radius circular region, centered at RA, Dec of , , placing the background region as far as possible () from NGC 5846 to minimize the contribution from group emission, while still being completely contained on the ACIS-I detector.
We model the spectra with a single absorbed VAPEC model, Galactic absorption and abundances fixed as in §3.2.2 and fit the spectrum over the keV range. Our results are listed in Table 1. A spectral fit is deemed statistically acceptable if the probability of getting a as large or larger than observed if the model is correct, denoted the ‘null’ parameter, is . Although the single temperature VAPEC model provides a reasonable description of the spectra outside the central kpc of the galaxy, the is only marginally acceptable (null ) for bins with mean radii of kpc, kpc and kpc, and the residuals in those bins suggest the presence of multi-temperature gas (Buote 2000). This is not surprising given the elliptical, off-centered distribution of temperatures shown in the temperature maps. Within kpc, the gas temperature is roughly isothermal with temperatures of keV. The mean temperature rises modestly to keV at kpc and then rises steeply to keV at radii beyond kpc, consistent with ROSAT and XMM-Newton results (Trinchieri et al. 1997; Finoguenov et al. 1999; Nagino & Matsushita 2009). The temperature increases for increasing radii at kpc and kpc are approximately coincident with the positions of the inner and outer edges seen in the surface brightness profiles (Fig. 8). In the central kpc, a single temperature VAPEC model, with best fit temperature keV (, ) is not a good description of the data, with the see-saw pattern in the residuals indicating the presence of multi-phase gas. A two temperature VAPEC model with abundances fixed as in §3.2.2 and temperatures keV and keV (, )is a much better description of the data. The single temperature VAPEC model also fails to describe the spectrum in the kpc annulus. This central region kpc) is complex, showing X-ray cavities (bubbles) filled with radio plasma from recent AGN activity, and X-ray bright knots as well as H emission (Fig. 12 and §4). The presence of higher temperature gas in the spectral model for the central region of NGC 5846 is unusual for group dominant elliptical galaxies, whose bright cores tend to be cool. This spectral component may be an artifact of applying a simple spectral model to multi-phase gas in the central region of NGC 5846, or indicate the presence of higher temperature gas that has been heated by the recent passage of a shock.
3.3. Modeling Gas Properties Across the Surface Brightness Edges
3.3.1 Gas Densities
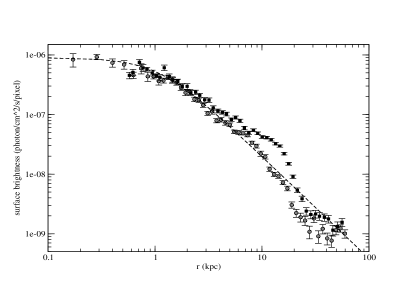
To study the northeastern edges quantitatively, we identify a bounding ellipse centered at NGC 5846’s nucleus with semi-major (-minor) axes of () and position angle , that traces the outer sharp surface brightness discontinuity in the angular sector extending from to . We construct the surface brightness profile, in that angular sector, using concentric elliptical annuli of increasing (decreasing) logarithmic width for radii outside (inside) the bounding ellipse. To the southwest, we construct the radial surface brightness profile using concentric circular annuli, centered again on NGC 5846 and with logarithmically increasing width, constrained to lie in the angular sector extending from to . In the right panel of Figure 3, we compare the mean -model (dashed line) with these surface brightness profiles, confirming the qualitative evidence for multiple edges seen in Figure 2. Not only is the surface brightness and thus gas density much higher at kpc inside the outer northeast edge, as also seen in ROSAT HRI images (Trinchieri et al. 1997), but the edge is sharper and deeper than that to the southwest, suggesting that the ISM gas distribution has been displaced significantly to the northeast. The surface brightness profile to the southwest is a factor fainter at kpc compared to that at the same distance from the nucleus to the northeast. There is a shallower discontinuity near kpc in the southwestern profile than in the northeast, perhaps a remnant from a previous oscillation.
Following Vikhlinin et al. (2001), we denote the edge position and ratio of electron density across the inner (outer) edge in each sector as and ( and ), respectively. The electron density on either side of each edge is modeled with a power law. Thus,
| (2) | |||||
| (3) | |||||
| (4) |
where the power law slopes of the density for radii inside the inner edge, between the edges, and outside the outer edge are , , and , respectively and is a constant normalization. We then integrate the electron density model along the line of sight and use a multivariate minimization scheme iteratively to fit the model parameters for each sector. We first determine and from a fit to the outer edge alone, and then fix these parameters in a fit across both edges while allowing the remaining parameters (, , , , , ) to vary. Our results for the northeast (NE) and southwest (SW) sectors are listed in Table 2 and shown as solid curved lines in the upper and lower panels of Figure 8. Edge locations are denoted by vertical lines. In the northeastern sector, we find a sharp, deep outer edge located kpc from the nucleus with a gas density jump, assuming no strong abundance changes at the boundary, of . The inner edge, located at kpc, is not as well-defined and is a factor shallower with a density jump of . Similarly we find edges at kpc and kpc from the nucleus in the southwest sector with density discontinuities of and , respectively. The inner edge in the southwest sector falls close to a chip gap on the ACIS-I detector. To test whether this might bias our results, we fit the surface brightness profile from the same SW sector using only data from the ks obsid 788 observation, where the inner edge region of interest falls entirely on the S3 CCD, and found no significant differences in the fit results. We also note that the -model parameters derived from the outer power law slopes () for the NE sector () and SW sector () are in good agreement with each other and with the obtained from a single -model fit to the NGC 5846 group’s mean (azimuthally-averaged) radial surface brightness profile, shown in the upper panel of Figure 3.
3.3.2 Gas Temperatures, Pressures and Velocities
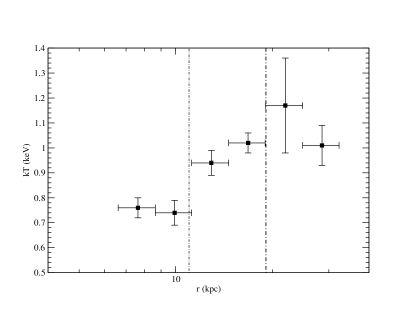
To better understand the temperature changes across the surface brightness edges, we extract spectra from either side of the edge using regions concentric with the edge morphology. For the northeastern edges, we extract spectra from elliptical annular regions concentric to the same bounding ellipse that was used to generate the northeastern sector surface brightness profiles and constrained to lie in the same angular sector (see §3.1 and Fig. 8). Regions NEO-1 (NEO0) fall just inside (outside) the outer northeastern edge at kpc. NEI-1 (NEI0) lie inside (outside) the inner northeastern edge at kpc. Similarly for the southwestern edges, we use concentric circular annuli, centered on NGC5846’s nucleus and constrained to lie in the same sector used to construct the southwestern surface brightness profile, to measure the gas temperatures on either side of each edge. Regions SWO-1(SWO0) fall just inside (outside) the outer southwestern edge at kpc, and SWI-1 (SWI0) lie just inside (outside) the inner southwestern edge at kpc, respectively. Backgrounds are taken from renormalized blank sky backgrounds provided by the Chandra X-ray Center for the same regions, normalized to the observations by comparing count rates in the keV energy band (see §2).
Our results are listed in Table 3 for the northeastern edges and in Table 4 for the southwestern edges, and are plotted in Figure 9. As expected, the temperature profiles are not symmetric. Lower temperature gas has been pushed to larger radii to the northeast. For the outer northeastern edge, the temperature rises from keV inside the edge to outside the edge, such that the temperature jump between undisturbed gas outside the cold front and gas just within the cold front edge is . Given the density jump of from Table 2, we find a pressure ratio across the edge. If this pressure ratio is interpreted as evidence for bulk motion of the cold front, then, following Vikhlinin et al. (2001), we infer that the front is moving transonically with velocity km s-1 (Mach ) relative to the keV gas outside the cold front. Thermal pressures across the inner edge are, within the large uncertainties, consistent with pressure equilibrium and zero relative velocity. Although the uncertainties are larger, the pressure ratios derived across the southwestern inner (outer) edges are remarkably similar to those to the northeast. The pressure ratio across the inner southwestern edge is consistent with thermal pressure equilibrium, while the pressure ratio across the outer southwestern edge is , suggesting possible transonic motion of the gas.
In the upper panel of Figure 9 we also see that there is no statistically significant change in the temperature across the northeastern inner edge. Since these are projected temperatures, higher temperature gas at large radii along the line of sight may reduce the observed projected temperature ratio over that of the true (deprojected) ratio of temperatures across the front.
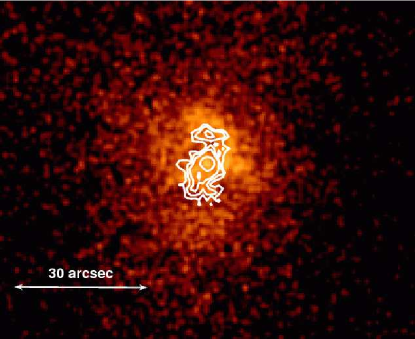
However, the origin of the inner northeastern edge may be more complex than simple gas sloshing. In the radio band, NGC5846 hosts a low radio power ( W Hz-1 at GHz) source (see also Fig. 12). Giacintucci et al. (2011) observed the source with the Giant Metrewave Radio Telescope at MHz. Their -resolution image detected a central unresolved component and an extended feature of only kpc toward the northeast. In Figure 10 we superpose the MHz radio emission contours from Giacintucci et al. (2011) on the kev image of NGC5846, and find that the inner northeastern edge lies, in projection, just outside the extended structure detected at MHz. This suggests the possibility that the inner northeastern edge may be cool gas displaced by radio plasma in a bubble formed during a prior episode of AGN activity.
4. X-ray Cavities and Nuclear Activity
The thermodynamic state of gas in the central kpc of NGC 5846 is complex. with a non-radial, non-azimuthally symmetric distribution due both to merging activity and episodic feedback from the central AGN. Observations in multiple wavebands (radio, optical and X-ray) show that the gas is truly multi-phase with a mix of cool, dusty filaments, warm gas observed through its optical line emission, and hot gas with a range of temperatures and densities. The gas is disturbed both by merging activity and ongoing AGN outbursts, resulting in observed non-radial, non-azimuthally-symmetric gas distributions that are more difficult to interpret.
Evidence for two recent AGN outbursts are seen in the X-ray ‘ghost’ cavity found kpc east of the nucleus, shown in Figure 2, and in two roughly symmetrical, inner cavities (bubbles), observed previously by Trinchieri & Goudfrooij (2002) and Allen et al. (2006), whose centers lie kpc from NGC 5846’s nucleus (see Figures 11 and 12). The inner bubbles are highly significant, with the excess flux in the rims more than greater than that expected from background. While the rims on the bubbles do not appear complete (particularly to the south), it is unclear whether this is the result of actual bubble disruption through the onset of hydrodynamic instabilities or a projection effect caused by the evolution of the bubble through multi-phase gas, already disturbed by merging activity. We have retrieved and reanalyzed and GHz data from the VLA archive (see Table 6 for details). Calibration and imaging were carried out using the NRAO Astronomical Image Processing System (AIPS) using standard methods. We find that radio emission at GHz and GHz is coincident with the inner bubbles,
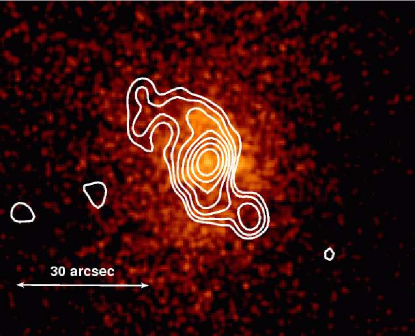
and that the GHz radio emitting plasma appears to extend outside the apparently roughly spherical bubble walls to the northeast and south. However, no radio emission is detected at MHz from the ghost cavity to the west.
In the upper right panel of Figure 12, we show contours from an H+[NII] image taken with the m Southern Observatory for Astrophysical Research telescope. H+[NII] emission is weak, with a total H flux of erg s-1 cm-2 . We assumed the following ratios between the [NII] lines and the H line: and . With the Kennicutt (1998) relation, where the star formation rate is given by
| (5) |
the star formation rate in NGC 5846 is only . The H+[NII] filaments seem dusty and are aligned with the X-ray substructures. H emission is found inside the inner edge of the northern bubble rim, and also just inside the visible rim of the bubble to the south.
4.1. AGN Outburst Energetics
We estimate the energy of the outburst by the enthalpy () carried in the cavity, assuming that the cavity is filled with relativistic () plasma. is the mean thermal pressure in the undisturbed ambient gas at the same radius as the center of the bubble, and is the bubble volume (Birzan et al. 2004, Allen et al. 2006). The undisturbed gas pressure is estimated using the mean -model fit to the density from §3.1 and temperatures of keV and for the inner and ghost bubbles, respectively, taken from the temperature maps at the bubble locations. For simplicity we assume each bubble is spherical. The method used to estimate the bubble age depends on the evolutionary stage of the bubble. For young bubbles that are still momentum driven by the radio jets, the age of the bubble is taken to be the time for the bubble to rise to its given location , where is the projected distance of the center of the bubble from the galaxy nucleus, at the speed of sound in the ambient gas (Omma et al. 2004; Birzan et al. 2004). For more evolved bubbles, the age of the bubble may be better approximated using the time () for the bubble to rise buoyantly at its terminal velocity, , where is the bubble cross-section, is the bubble volume, is the drag coefficient, and is the acceleration of gravity at the projected distance of the bubble center from NGC 5846’s nucleus (Churazov et al. 2001; Birzan et al. 2004). Once the bubble enthalpy and age are determined, the instantaneous mechanical power of the outburst is given by . Our results are given in Table 7, where we have used the buoyancy timescale to estimate .
For the inner bubbles, we find outburst energies ergs, bubble ages Myr and mechanical powers erg s-1 , consistent with previous work (Allen et al. 2006). The outburst energy inferred for the ‘ghost’ bubble is modestly larger ( ergs) and the bubble age is Myr, giving the time between outbursts (AGN duty cycle) Myr. However, the uncertainties in these measurements are large. First the three dimensional cavity geometry is not known and may affect estimates of the bubble volume and, consequently, outburst energy by factors of a few. Second, our simplified model assumes AGN bubbles rising in a static atmosphere. However, both the inner and ghost bubble ages are shorter than the expected gas sloshing timescales given by the time since closest approach of the proposed galaxy perturber NGC 5850 ( Myr; Higdon et al. 1998). Thus non-hydrostatic bulk gas motions may have influenced AGN activity and likely also affect bubble morphology, the observed distance of the bubble from the nucleus, and the probability for bubble disruption. Numerical simulations are required to model bubble evolution in this complex, dynamical environment.
4.2. Knots
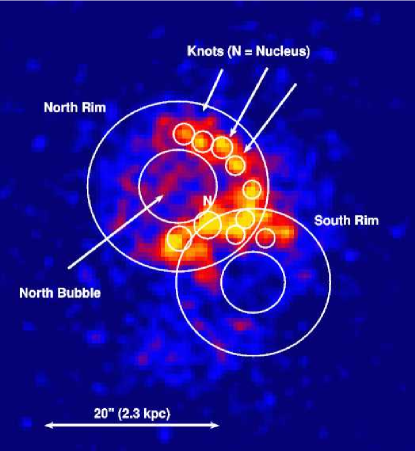
In Figure 13 we use unsharp masking to reveal the internal structure of the northern and southern inner bubbles in NGC 5846. The unsharp masked X-ray image is created using Gaussian smoothing scales of and pixels, respectively, on the full resolution exposure corrected, co-added keV Chandra image. An exposure map threshold of was imposed to maximize signal-to-noise in our result. We see that the inner bubble rims are not smooth, but are threaded by knot-like features (see Table 8). To determine the detection significance of these knots, we calculate the cumulative probability that the observed counts or higher in each knot in the keV energy band could have arisen from a Poisson fluctuation of the surrounding rim emission. Knots and are least significant with a cumulative probability of , while for all other knot features, the cumulative probability that the observed counts or higher might be a fluctuation of the surrounding rim emission is . Thus the significance of the knots as distinct features is high.
We want to compare the spectra of these knot-like structures to the spectrum of diffuse gas in the surrounding rims. In Table 8 we define circular spectral regions around each knot and elliptical annuli excluding the knots and nucleus that trace the north and south bubble rims. An elliptical annulus (excluding point sources) located just outside the rims is taken as the local background for both the knot and rim regions. We model the spectrum of the rims with an absorbed VAPEC model assuming Galactic absorption and fixing the abundances as in §3.2.2. As shown in Table 11, the mean temperature of gas in the north rim is keV for the ks exposure (OBSID 7923). However, the model does not provide a statistically acceptable fit (, ), and the residuals display the characteristic see-saw pattern of multi-temperature gas (Buote 2000). In contrast, hot gas in the south rim region is well modeled by an absorbed single temperature VAPEC model. We find a best fit gas temperature of keV (), where we have used a simultaneous fit to both the ks (OBSID 7923) and ks (OBSID 788) data sets to reduce uncertainties. The more complex spectral structure for gas in the north rim compared to that in the south rim region may be due to projection effects, such that multi-phase gas is more prominent along our line of sight to the north than to the south. Alternatively, the combination of AGN and merging activity may have introduced hydrodynamic instabilities in the fluid that were more efficient at disrupting the bubble to the south than to the north. The intrinsic keV luminosity of diffuse gas in the north rim ( erg s-1 ) is higher than that in the south rim ( erg s-1 ).
The individual knot-like features are X-ray faint. In Table 9 we list the net source counts for the individual knots in four energy bands: keV (FeSS), keV (FeS), keV (M), keV (H). The first two bands are chosen to divide the energies containing the FeL line complex (the Fe peak from keV) in half, such that the hardness ratio constructed from these bands will be sensitive to shifts in the energy of the peak emission from the FeL complex, caused by temperature differences in cool ( keV) gas. For comparison, we also include net source counts in these energy bands for the north and south rims. Notice that in all cases (knots and rims), the X-ray emission is dominated by the Fe peak, confirming that the X-ray emitting gas is cool, and, for all the knot-like features except Knot, the net photon counts above keV are consistent with zero at the confidence level. Since the number of photons in each individual knot is small, we use the hardness ratio across the iron peak, , to search for temperature differences between the individual knots and between the knots and the rims. We also compute the standard medium band hardness ratio , where S is the number of photons in the keV energy band. These hardness ratios along with the total ( keV) net source counts for each region are given in Table 10. Although the hardness ratios for Knot and Knot suggest a mildly softer spectrum than the others, the most striking result from Table 10 is that the hardness ratios of the knots are nearly identical to that of the rims. We stack the knot spectra to determine quantitatively a mean temperature for the knots, and confirm that the best fit temperature (, for the ks exposure) is statistically indistinguishable from that measured in the surrounding rims. The total keV luminosity of the knots is erg s-1 , one third of the X-ray luminosity of diffuse gas in the north rim.
To investigate the gas density and thermal pressure in the knots, we fit the spectrum of the brightest knot (Knot in the north rim with keV luminosity of erg s-1 ) as an example. We fix the VAPEC model temperature to keV, the best fit temperature for the stacked knot spectrum (and gas in the north rim), and allow only the VAPEC model normalization to vary. We then compute the electron density from the VAPEC normalization (see eq. 1), assuming that the knot is a sphere with radius ( kpc) uniformly filled with gas. We find an electron density of cm-3 and corresponding thermal pressure of erg cm-3 where the uncertainties reflect only the statistical uncertainties of the spectral model fit. For such dense gas, the cooling time is short, Myr.
For comparison, we compute the electron density and corresponding thermal pressure for the diffuse gas in the north rim surrounding Knot. Again the largest uncertainty in the analysis is the assumed morphology of the emission region. To bound the electron density in the rim, we compute the electron density assuming first that the observed emission is gas uniformly distributed throughout a cylindrical shell with a cross sectional area that of the spectral extraction region and a height equal to the bubble radius (an upper limit on the emission volume and consequently lower limit on the derived density) and, second, that the X-ray emission comes solely from a spherical shell with dimensions determined by the spectral extraction region (a lower limit on the emission volume), excluding the knot regions in each case. The electron density in the north rim is then bounded by cm-3 . This is somewhat larger, as expected by the greater surface brightness of the rim, but comparable to the electron gas density ( cm-3 ) derived from the mean -model for NGC 5846 (see §3.1). We infer a thermal pressure in the gas surrounding Knot of erg cm-3 . at least a factor lower than that derived for Knot, assuming a spherical geometry.
There are two possible scenarios to explain this discrepancy. If the knots are stable structures in pressure equilibrium with their surroundings, then either the knots are not spherical, cooling blobs or they are stabilized by non-thermal pressures, or both. In this scenario, the most likely explanation is that the true -dimensional morphology of the knot-like structures is more extended and complex. For example if they are filamentary rather than spherical, i.e. more like the X-ray filament observed in M87 (Forman et al. 2007) but viewed with the filament oriented along the line of sight, the emission volume would be larger, implying a lower electron density and allowing the structure to be closer to or in thermal equilibrium with its surroundings. Then the knot-like appearance of the structures would be primarily a projection effect. It may be difficult to explain, however, why all the knots would have this orientation.
The second possibility is that the pressure estimates are, in fact, roughly correct and the knots and surrounding features are the visible result of a strong shock being driven into the ambient gas by the supersonic inflation of the radio lobe. The general morphology of the rim and knots is similar to the high Mach number shocks seen in NGC 4552 (Machacek et al 2006) and Her A (Nulsen et al. 2005). There is a noticeably bright, roughly elliptical, enhancement associated with the radio lobes in both cases. The morphology of the knots and the rim looks similar, albeit at much lower signal to noise. The knotty morphology could be the result of a shock being driven into a multi-phase ISM. In this scenario, the knots are the result of cooler clouds embedded in a hotter medium. A shock driven through such a stratified medium will drive spherical shocks into the clouds. They are brighter because they are denser, while the post-shock gas must be in rough pressure equilibrium.
We can use the density between the rim and the pre-shocked gas in the Rankine-Hugoniot conditions to estimate the Mach number of the shock and the expected temperature increase in the rim (Landau & Lifschitz 1959). Assuming the bubble rims are spherical shells and that the preshock density is given by our mean -model from §3.1 evaluated at the midpoint of the rim, we can use the density jump between the rim and the pre-shocked gas in the Rankine-Huygenot conditions to estimate a shock Mach number. From the more complete northern rim, we find a density jump of , and Mach number . However, the Rankine-Huygenot conditions assume the shock front is thin. Our measured value for the density jump is an average value across the rim, and so will underestimate the true density jump at the shock front. Thus this inferred Mach number should be interpreted as a lower bound on the true Mach number for the shock. These averaged values for the north rim in NGC 5846 are similar to those measured for bubbles in the central region of NGC 4552, where more detailed modeling indicated a shock Mach number of (Machacek et al. 2006). The measured (projected) temperature jump across the northern rim in NGC 5846 () is expected to be smaller than the Rankine-Hugoniot prediction () due to dilution by emission from unshocked gas along the line of sight. Note that knotty features are also seen in X-ray images of NGC 4552’s shocked bubble rims (see, e.g, the right panel of Fig. 1 in Machacek et al. 2006).
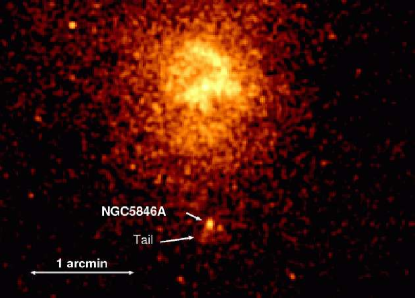
5. NGC5846A: Galaxy Infall & Gas Stripping
NGC 5846A, shown in Figure 1, is directly south of the dominant group elliptical galaxy NGC 5846. NGC 5846A was among the earliest galaxies confirmed to be a compact elliptical galaxy (cE). Compact elliptical galaxies form a rare class of early type galaxies that share many of the unusual properties of M32, companion to M31 (Andromeda) in the Local Group (Faber 1973). Compact elliptical (cE) galaxies have low optical luminosities (), similar to the more common dwarf elliptical galaxies, but their half-light radii ( kpc) are several times smaller, such that their optical surface brightness is much higher than expected for their luminosity (e.g. Faber 1973; Smith Castelli et al. 2008; Chiligarian et al. 2009). All are found near massive companions. They also tend to have higher stellar velocity dispersions and higher metallicities than expected for their luminosities, and lie above the locus of normal dwarf elliptical galaxies on the Faber-Jackson relation (Faber & Jackson 1976). Currently only about a dozen cE galaxies have been found within Mpc, where their properties can be confirmed by ground-based telescopes (for recent searches see Smith-Castelli et al. 2008, 2010 in the Antlia cluster; Price et al. 2009 in Coma; Chiligarian & Bergond 2010 in the NGC 5846 group).
While the origin of cE galaxies and their relationship to galaxy evolution remain under debate, the most likely explanation for their high surface brightness, high velocity dispersion and compact structure is that their progenitors were massive, possibly disky, galaxies that have undergone severe tidal threshing from interactions with a nearby massive companion. The outer stellar layers have been tidally stripped from these galaxies leaving only the compact stellar core (Bekki et al. 2001, 2003). The near-infrared indices for NGC5846A suggest that the progenitor of NGC5846A may have been a massive elliptical galaxy, and that the catastrophic tidal interaction, responsible for stripping of its progenitor’s stellar mass, may also have funneled gas into NGC5846A’s core, resulting in an intermediate age population of stars near its nucleus (Davidge et al. 2008).
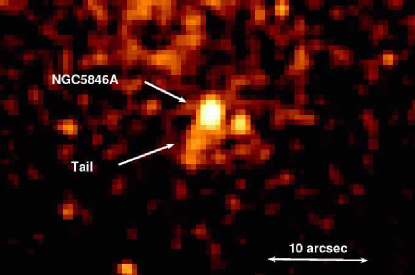
One might expect such strong tidal interactions would also remove any hot gas corona associated with the compact elliptical galaxy, leaving it devoid of X-ray emitting gas. Figure 14 shows, however, an X-ray tail extending kpc () to the south of NGC5846A, evidence for ongoing ram pressure stripping of a residual gaseous corona of the compact elliptical galaxy. Since the radial velocity difference between NGC 5846A and NGC 5846 is km s-1 (NED), already transonic for keV gas, the infall is likely supersonic. Assuming a thermal model with keV, uniform filling and cylindrical geometry for the tail, the mean density of gas in the tail is estimated to be cm-3 and mass in the tail of . The average mass return rate for a simple population of stars in a galaxy of age , where is the end of the galaxy formation epoch and stars are passively evolving, is (Ciotti et al. 1991). Assuming that NGC5846A shares many of the same properties as the compact elliptical galaxy NGC4486B (Davidge et al. 2008), such that Gyr (Soria et al. 2006), and has an absolute B-band magnitude (Davidge 1991), the rate of mass loss by aging stars is . The time between stripping episodes needed to replenish the ISM with sufficient mass to explain the gas mass observed in the tail is Myr.
The central X-ray corona in NGC 5846A has a radius , also of the order of the Chandra point spread function. Since this is consistent with a point source, we can only set an upper limit of pc for the physical radius of NGC 5846A’s gas corona. Interpretation of the X-ray properties of the central region of NGC 5846A is further complicated by the presence of a nuclear point source. The observed keV source count rate in a circular region surrounding the nucleus ( counts s-1 ) is more than an order of magnitude larger than that expected if X-ray emission in the region was due solely to hot the X-ray emission from the region were due to keV hot gas with solar abundance. Assuming a power law model with photon index for the nonthermal emission, we find a keV nuclear luminosity of erg s-1 . Extrapolating this power law model for the nuclear emission to the keV band, we find that the observed count rate exceeds that predicted by the model by . If we assume this excess keV emission is due entirely to a keV hot gas corona with solar abundance that uniformly fills a spherical volume of radius pc, we find an upper limit on the mean electron density and gas mass of the gas corona of cm-3 and , respectively. These should be considered upper limits, because if the nuclear spectrum is steeper, the nuclear contribution to the keV emission increases. For , the nuclear point source alone is sufficient to explain all of the observed soft emission from the central region. Thus most of the hot gas associated with NGC5846A resides in the stripped tail.
6. CONCLUSIONS
NGC 5846 may be the best nearby example of a galaxy group in which we can simultaneously study the dynamics of non-hydrostatic gas motions induced by galaxy interactions, AGN activity and bubble evolution. In this paper we have used the combined ks Chandra exposure for NGC 5846 to analyze the signature X-ray surface brightness edges and cavities produced by this activity, and have compared these data with radio and H images of the same region. We also observed for the first time ram pressure stripping of a compact elliptical galaxy NGC 5846A, during its supersonic infall towards NGC 5846. We find:
-
•
The surface brightness distribution for NGC 5846 is asymmetrically displaced northeast from the nucleus, displaying surface brightness discontinuities (edges) at kpc and kpc from the nucleus to the northeast and at kpc and kpc to the southwest. Assuming a double power law model for the electron density and no strong abundance gradients, the density jump at the outer (inner) edges are () for the edges to the northeast and () to the southeast. These multiple surface brightness edges are likely the signature of non-hydrostatic gas motions (sloshing) caused by the off-axis encounter of NGC 5846 with another group galaxy, possibly the large spiral NGC 5850, or a merging subgroup.
-
•
Temperature maps for NGC 5846 confirm that the observed surface brightness edges correspond to cold fronts. Spectral modeling with a VAPEC thermal plasma model across the northeast and southwest outer edges give temperature ratios of and , respectively, and pressure ratios suggesting that the gas in the cold front may be moving transonically relative to its surroundings. Thermal pressures across the inner edges are consistent with pressure equilibrium and zero relative velocity.
-
•
The surface brightness map of NGC 5846 shows a spiral-like tail extending kpc to the northwest. Such spiral structures are also characteristic of gas sloshing. However, no corresponding spiral structure is observed in the temperature map. This suggests that the perturbing encounter did not occur in the plane of the sky, and may be consistent with the suggestion by Higdon et al. (1998) that NGC 5846 recently experienced a close off-axis interaction with the spiral galaxy NGC 5850.
-
•
Evidence for recent AGN activity in NGC 5846 are seen in two roughly symmetrical bubbles with centers kpc from the nucleus, and in a ghost X-ray cavity kpc to the east. The inner bubbles are coincident with GHz and GHz radio emission. H emission along the inner edge of the northern bubble rim suggests that gas is cooling, supporting the complex, multi-phase nature of gas in the central region. However, the H emission is weak ( erg s-1 cm-2 ), such that the inferred star formation rate is only .
-
•
From the bubble morphology and thermodynamic properties of the surrounding gas, we infer outburst energies, bubble age, and AGN mechanical luminosity of ergs, Myr, and erg s-1 , respectively, for the inner bubbles, consistent with previous results. The outburst energy and age of the ghost cavity are ergs and Myr, implying an AGN duty cycle of Myr. Both the inner bubble and ghost cavity ages are shorter than the time since NGC 5850’s closest approach to NGC 5846, such that non-hydrostatic bulk gas motions from the encounter may have influenced AGN activity, bubble morphology and position, and possibly bubble disruption in NGC 5846.
-
•
The inner bubble rims are threaded with bright, knot-like features with individual keV luminosities erg s-1 . The total keV X-ray luminosity of these ‘knots’ is erg s-1 , compared to X-ray luminosities of erg s-1 and erg s-1 for diffuse gas in the north and south rims, respectively. The mean temperature derived from modeling the stacked spectrum of the ‘knots’ (), is statistically indistinguishable from that of the surrounding gas in the rim. The electron density and thermal pressure in the brightest ‘knot’, derived assuming the ’knot’ is spherical, is at least a factor three higher than that in the surrounding rim gas. We suggest either the ‘knots’ are extended, filamentary structures in equilibrium with the surrounding gas or they are transient structures, i.e. gas clouds heated and compressed by the recent passage of a shock from the last AGN outburst.
-
•
Chandra images of the compact elliptical galaxy NGC 5846A, infalling supersonically towards NGC 5846 from the south, show a compact ( pc radius) corona at the galaxy center and a kpc X-ray tail containing of gas, suggesting ongoing ram-pressure stripping. Assuming that the observed gas originated from passively evolving stars, the time between stripping episodes needed to replenish the galaxy ISM with sufficient mass to explain the gas mass in the tail is Myr.
References
- Allen et al. (2006) Allen, S.W., Dunn, R.J.H., Fabian, A.C., Taylor, G.B. & Reynolds, C.S. 2006, MNRAS, 372, 21
- Ascasibar & Markevitch (2006) Ascasibar, Y. & Markevitch, M. 2006, ApJ, 650, 102
- Bautz et al. (1998) Bautz, M.W., et al. 1998, X-ray Optics, Instruments and Missions,
- Bekki et al. (2001) Bekki K., Couch, W. J., Drinkwater M. J., Gregg M. D., 2001, ApJ, 557, L39
- Bekki et al. (2003) Bekki, K., Couch, W. J., Drinkwater, M. J., Shioya,, 2003, MNRAS, 344, 399
- Bender et al. (1992) Bender, R., Burstein, David, Faber, S. M. 1992, ApJ, 399, 462
- Best et al. (2006) Best P. N., Kaiser C. R., Heckman T. M., Kauffmann G., 2006, MNRAS, 368L, 67
- Biermann etal (1989) Biermann, P. L., Kronberg, P. P., Schmutzler, T. 1989, A&A, 208, 22
- Birzan et al. (2004) Birzan, L., Rafferty, D. A., McNamara, B.R., Wise, M.W., & Nulsen, P.E.J. 2004, ApJ, 607, 800
- Bregman et al. (2006) Bregman, J.N., Otte, B., Miller, E.R., & Irwin, J.A. AJ, 643, 759
- Buote (2000) Buote, D. 2000, MNRAS, 311, 176
- Chiligarian & Bergond (2010) Chilingarian, I. V. & Bergond, G. 2010, MNRAS, 405, 11
- Ciotti et al. (1991) Ciotti, L., D’Ercole, A., Pellegrini, S., Renzini, A. 1991, ApJ, 376, 380
- Condon et al. (1998) Condon, J.J., Cotton, W.D., Greisen, E.W., Yin, Q.F., Perley, R.A., Taylor, G.B., Broderick, J.J. 1998, AJ, 115, 1693
- Cooper et al. (2006) Cooper, M.C. et al. 2006, MNRAS, 370, 198
- Croton et al. (2006) Croton, D., Springel, V., White, S.D.M., De Lucia, G., Frenk, C.S., Gao, L., Jenkins, A, Kauffmann, G., Navarro, J.F., Yoshida, Y., 2006, MNRAS, 365, 11 ; MNRAS367,864
- David et al. (2011) David, L. P., O’Sullivan, E., Jones, C., Giacintucci, S., Vrtilek, J., Raychaudhury, S., Nulsen, P. E. J., Forman, W., Sun, M., Donahue, M. 2011, ApJ, 728, 162
- Davidge (1991) Davidge, T. J. 1991, AJ, 102, 896
- Davidge et al. (2008) Davidge, T.J., Beck, T.L., McGregor, P.J. 2008, ApJ, 677, 238
- Diehl & Statler (2007) Diehl, S. & Statler, T.S. 2007, ApJ, 668, 150
- Diehl & Statler (2008a) Diehl, S. & Statler, T.S 2006, ApJ, 687, 986
- Faber & Jackson (1976) Faber, S.M., Jackson, R.E. 1976, ApJ, 204, 668
- Faber et al. (1989) Faber, S. M., Wegner, Gary, Burstein, David, Davies, Roger L., Dressler, Alan, Lynden-Bell, D., Terlevich, R. J. 1989, ApJS, 69, 763; 1989 ApJS, 71, 173
- Fabian et al. (2003) Fabian, A. C., Sanders, J. S., Allen, S. W., Crawford, C. S., Iwasawa, K., Johnstone, R. M., Schmidt, R. W., Taylor, G. B. 2003, MNRAS, 344, 43
- Fabian et al. (2011) Fabian, A.C., Sanders, J.S., Allen, S.W., Canning, R.E.A., Churazov, E., Crawford, C.S., Forman, W., GaBany, J., Hlavacek-Larrondo, J., Johnstone, R.M., Russell, H.R., Reynolds, C.S., Salome, P., Taylor, G.B., Young, A.J. 2011, MNRAS, submitted, eprint arXiv 1105.5025
- Filho et al. (2004) Filho, M.E., Fraternali, F., Markoff, S., Nagar, N.M., Barthel, P.D., Ho, L.C., & Yuan, F. 2004, A&A, 418, 429
- Finoguenov et al. (1999) Finoguenov, A., Jones, C., Forman, W., David, L. 1999, ApJ, 514, 844
- Finoguenov et al. (2006) Finoguenov, A., Davis, D.S., Zimer,M. & Mulchaey, J.S. 2006, ApJ, 646, 143
- Forman et al. (2007) Forman, W., Jones, C., Churazov, E., Markevitch, M., Nulsen, P., Vikhlinin, A., Begelman, M., Böhringer, H., Eilek, J., Heinz, S., Kraft, R., Owen, F., Pahre, M. 2007, ApJ, 665, 1057
- Forman et al. (1985) Forman, W., Jones, C., Tucker, W. 1985, ApJ, 293, 102; 1986, ApJ, 300, 836
- Forman et al. (2005) Forman, W., Nulsen, P., Heinz, S., Owen, F., Eilek, J., Vikhlinin, A., Markevitch, M., Kraft, R., Churazov, E., Jones, C. 2005, ApJ, 635, 894
- Giancintucci et al. (2011) Giacintucci S., O’Sullivan E., Vrtilek J. 2011, ApJ, submitted
- Gitti et al. (2010) Gitti, Myriam, O’Sullivan, Ewan, Giacintucci, Simona, David, Laurence P., Vrtilek, Jan, Raychaudhury, Somak, Nulsen, Paul E. J. 2010, ApJ, 714, 758
- Goudfrooij & Trinchieri (1998) Goudfrooij, P. & Trinchieri, G. 1998, A&A, 330, 123
- Higdon η (1998) Higdon, J.L., Buta, R.J. & Purcell, G.B. 1998, AJ, 115, 80
- Jetha et al. (2007) Jetha, N.N., Ponman, T.J., Hardcastle, M.J. & Croston, J.H. 2007, MNRAS, 376, 193; 2007, MNRAS, 378, 384
- Johnson et al. (2010) Johnson, R. E., Markevitch, M., Wegner, G. A.; Jones, C.; Forman, W. R. 2010, ApJ, 710, 1776
- Landau & Lifschitz (1959) Landau, L. D. & Lifschitz, E. M. 1959, Fluid Mechanics (London: Pergamon), chapter 9
- Machacek et al. (2010) Machacek, M.E., O’Sullivan, E., Randall, S.W., Jones, C., Forman, W.R. 2010, ApJ, 711, 1316
- Mahdavi et al. (2005) Mahdavi, A., Trentham, N. & Tully, R.B. 2005, AJ, 130, 1502
- Markevitch et al. (2001) Markevitch, M., Vikhlinin, A., Mazzotta, P. 2001, ApJ, 562, 153
- Markevitch & Vikhlinin (2007) Markevitch, M. & Vikhlinin, A. 2007, Physics Reports, 443, 1
- McNamara et al. (2000) McNamara, B. R. et al. 2000, ApJ, 534, 135
- McNamara et al. (2005) McNamara, B. R., Nulsen, P. E. J., Wise, M. W., Rafferty, D. A., Carilli, C., Sarazin, C. L., Blanton, E. L. 2005, Nature, 433, 45
- Mulchaey et al. (2003) Mulchaey, J. S., Davis, D. S., Mushotzky, R. F., Burstein, D. 2003, ApJS, 145, 39
- Morrison & McCammon (1983) Morrison, R. & McCammon, D. 1983, ApJ, 270, 119
- Nagino & Matsushita (2009) Nagino, R. & Matsushita, K. 2009, A&A, 501, 157
- Nulsen et al. (2002) Nulsen, P. E. J., David, L. P., McNamara, B. R., Jones, C., Forman, W. R., Wise, M. 2002, ApJ, 568, 163
- Nulsen et al. (2005) Nulsen, P. E. J., Hambrick, D. C., McNamara, B. R., Rafferty, D., Birzan, L., Wise, M. W., David, L. P. 2005, ApJ, 625, 9
- Osmond & Ponman (2004) Osmond, J.P.F. & Ponman, T.J. 2004, MNRAS, 350, 1511
- O’Sullivan et al. (2001) O’Sullivan, E., Forbes, D. A., & Ponman, T. J. 2001, MNRAS, 328, 461
- Plucinsky et al. (2003) Plucinsky, P.P., Schulz, N.S., Marshall, H.L., Grant, C.E., Chartas, G., Sanwal, D., Teter, M., Vikhlinin, A.A., Edgar, R.J., Wise, M.W., Allen, G.E., Virani, S.N., DePasquale, J.M. & Raley, M.T. 2003, in Proceedings of The SPIE X-ray and Gamma-Ray Telescopes and Instruments for Astronomy, ed. J.E. Trluemper & H. Tannenbaum, Proceedings of The SPIE, 4851, 89
- Price et al. (2009) Price, 2009, MNRAS, 397,1816
- Rasmussen & Ponman (2007) Rasmussen, J. & Ponman, T.J. 2007, MNRAS, 380, 1554
- Randall et al. (2009) Randall, S. W., Jones, C., Markevitch, M., Blanton, E. L., Nulsen, P. E. J., Forman, W. R. 2009, ApJ, 700, 1404
- Randall et al. (2011) Randall, S.W., Forman, W.R., Giacintucci, S., Nulsen, P.E.J., Sun, M., Jones, C., Churazov, E., David, L.P., Kraft, R., Donahue, M., Blanton, E.L., Simonescu, A., Werner, N. 2011, ApJ, 726, 86
- Smith et al. (2001) Smith, R.K., Brickhouse, N.S., Liedahl, D. A. & Raymond, J.D. 2001, ApJ, 556, L91
- Smith Castelli et al. (2008) Smith Castelli, A. V., Faifer, F. R., Richtler, T., Bassino, L.P. 2008, MNRAS, 391, 685
- Smith Castelli et al. (2010) Smith Castelli, A. V., Faifer, F. R., Bassino, L. P., Romero, G. A., Cellone, S. A., Richtler, T. 2010, eprint arXiV1002.3830
- Soria et al. (2006) Soria, R., Graham, A.W., Fabbiano, G., Baldi, A., Elvis, M., Jerjen, H., Pelligrini, S., Siemiginowska, A. 2006, ApJ, 640, 143
- Temi, Brighenti & Mathews (2007) Temi, P., Brighenti, F., Mathews, W. 2007, ApJ, 660, 1215
- Tonry et al. (2001) Tonry, J. L., Dressler, A., Blakeslee, J.P., Ajhar, E. A., Fletcher, A. B., Luppino, G. A., Metzger, M. R., & Moore, C. B. 2001, ApJ, 546, 681
- Tremaine et al. (2002) Tremaine, S. et al. 2002, ApJ, 574, 740
- Trinchieri & Goudfrooij (2002) Trinchieri, G. & Goudfrooij, P. 2002, A&A, 386, 472
- Trinchieri et al. (1997) Trinchieri, G., Noris, L., di Serego Alighieri, S. 1997, A&A, 326, 565
- Vikhlinin et al. (2001) Vikhlinin, A., Markevitch, M. & Murray, S.S. 2001, ApJ, 551, 160
- Wright (2006) Wright, E.L. 2006, PASP, 118, 1711
- Zabludoff & Mulchaey (1998) Zabludoff, A.I. & Mulchaey, J.S. 1998, ApJ, 496, 39
- ZuHone et al. (2010) ZuHone, J.A, Markevitch, M., Johnson, R. E. 2010,ApJ, 717, 908
| , | null | |||
|---|---|---|---|---|
| (arcsec, arcsec) | (kpc) | (keV) | ||
| , | ||||
| , | ||||
| , | ||||
| , | ||||
| , | ||||
| , | ||||
| , | ||||
| , | ||||
| , | ||||
| , | ||||
| , | ||||
| , | ||||
| , | ||||
| , |
Note. — Azimuthally average spectra for the NGC 5846 group from Chandra OBSID 7923, taken in circular annuli centered on the nucleus of NGC 5846 and with logarithmically increasing bin width. , and are the inner, outer, and mean radius of each annulus. All spectra,except the central bin, are modeled with an absorbed VAPEC model with fixed Galactic absorption ( cm-3 ), and abundances for O, Mg, Si,and Fe of , , , and , respectively. All other abundances are fixed at (see §3.2.2).
| Sector | |||||||
|---|---|---|---|---|---|---|---|
| (kpc) | (kpc) | ||||||
| NE | |||||||
| SW |
Note. — Density fit parameters for the double edge model defined in eqns. 1 - 4 for the density profiles shown in Fig. 8. Column definitions are: (1) angular sector, (2) inner edge location, (3) inner density jump, (4) outer edge location (5) outer density jump (6) inner, (7) middle, (8) outer slopes of the density power law. The angular sectors are centered at the nucleus of NGC 5846 and subtend the angle from to (NE) and from to (SW), measured counterclockwise from west. Uncertainties are confidence levels.
| Region | bi,ai | bo,ao | ||
|---|---|---|---|---|
| (arcmin, arcmin) | (arcmin, arcmin) | (keV) | ||
| NEI-2 | , | , | ||
| NEI-1 | , | , | ||
| NEI0 | , | , | ||
| NEI1 | , | , | ||
| NEO-2 | , | , | ||
| NEO-1 | , | , | ||
| NEO0 | , | , |
Note. — Spectral model fits in concentric elliptical annular regions concentric to the bounding ellipse described in Fig. 8 and restricted to the angular sector from to measured counter clockwise from west. The northeast inner edge is at the boundary between NEI-1 and NEI0. The northeast outer edge is at the boundary between NEO-1 and NEO0. The spectral model is an absorbed VAPEC model with Galactic absorption and abundances fixed as in Table 1
| Region | ri,ro | ||
|---|---|---|---|
| (arcmin, arcmin) | (keV) | ||
| SWI-2 | , | ||
| SWI-1 | , | ||
| SWI0 | , | ||
| SWO-1 | , | ||
| SWO0 | , | ||
| SWO1 | , |
Note. — Spectral model fits in concentric circular annular regions centered on NGC5846’s nucleus and restricted to lie in the angular sector from to measured counter clockwise from west. The southwest inner edge is at the boundary between SWI-1 and SWI0. The southwest outer edge is at the boundary between SWO-1 and SWO0. The spectral model is an absorbed VAPEC model with Galactic absorption and abundances fixed as in Table 1
| Edge | Mach | v | ||||
|---|---|---|---|---|---|---|
| (kpc) | (km s-1) | |||||
| NEouter | ||||||
| SWouter | ||||||
| NEinner | ||||||
| SWinner |
Note. — Cold front ratio analyses following Vikhlinin et al. (2001). The edge positions are measured from the center of NGC 5846. Mach numbers are relative to the speed of sound outside each edge.
| Project | Observation | Array | Frequency | Bandwidth | Integration 1 | FWHM, PA 2 | rms |
|---|---|---|---|---|---|---|---|
| date | (GHz) | (MHz) | time (min) | (, ∘) | (Jy b-1) | ||
| AW202 | Jan 1988 | B | , | ||||
| AF389 | Mar 2002 | A | , | ||||
| AF142 | Feb 1987 | CnD | , |
Note. — 1 Integration time on source; 2 full-width half-maximum (FWHM) and position angle (PA) of the full array.
| Label | r | |||||
|---|---|---|---|---|---|---|
| (kpc) | (kpc) | ( ergs) | (Myr) | (Myr) | ( erg s-1 ) | |
| ghost | ||||||
| north | ||||||
| south |
Note. — Columns (1) bubble label, (2) distance from the nucleus of NGC 5846, (3) bubble radius, (4) the work needed to evacuate the cavity for a relativistic plasma (), (5) bubble age for bubble rising at the speed of sound in the ambient gas (6) bubble age for bubble rising buoyantly at its terminal velocity, (7) the instantaneous mechanical power of the outburst estimated using the buoyancy timescale
| Label | RA,Dec | , | , | |
|---|---|---|---|---|
| (J2000.0) | (arcsec) | (arcsec,arcsec) | (arcsec,arcsec) | |
| Knot | … | … | ||
| Knot | … | … | ||
| Knot | … | … | ||
| Knot | … | … | ||
| Knot | … | … | ||
| Knot | … | … | ||
| Knot | … | … | ||
| Knot | … | … | ||
| Knot | … | … | ||
| North Rim | … | , | , | |
| South Rim | … | , | , | |
| Background | … | , | , |
Note. — Spectral regions for features in the central region of NGC 5846. Column (1) region label, (2) spectral extraction region center, (3) radius of circular regions used for knots and the nucleus, (4) outer and (5) inner semi-major, semi-minor axes of elliptical annulus regions used for the north and south rims and common local background. Knots ,, , are located only in the North Rim, knot is only in the South Rim, and knots and are in the projected overlapping region common to both rims.
| Label | keV | keV | keV | keV |
|---|---|---|---|---|
| (net counts) | (net counts) | (net counts) | (net counts) | |
| Knot | ||||
| Knot | ||||
| Knot | ||||
| Knot | ||||
| Knot | ||||
| Knot | ||||
| Knot | ||||
| Knot | ||||
| Knot | ||||
| North Rim | ||||
| South Rim |
Note. — Net source counts in various energy bands for the features identified in Table 8 summed over both observations, and using the common local background also given in Table 8. Knots ,, , are located only in the North Rim, knot is only in the South Rim, and knots and are in the projected overlapping region common to both rims.
| Label | Total Counts | ||
|---|---|---|---|
| Knot | |||
| Knot | |||
| Knot | |||
| Knot | |||
| Knot | |||
| Knot | |||
| Knot | |||
| Knot | |||
| Knot | |||
| North Rim | |||
| South Rim |
Note. — Hardness ratios in the Fe peak and medium energy band for the features identified in Table 8 using the net source counts summed over both observations, given in Table 9. FeSS, FeS, M, H and S denote the keV, keV, keV, keV and keV energy bands, respectively, and total counts are the net source counts in the keV energy band.
| Label | |||
|---|---|---|---|
| (keV) | ( erg s-1 ) | ||
| North Rim | |||
| South Rim | |||
| Stacked Knots | |||
| Knot |
Note. — Spectral models fit over the keV energy range using an absorbed VAPEC model with Galactic absorption and abundances fixed as in §3.2.2. is the keV intrinsic X-ray luminosity, assuming a luminosity distance of Mpc. Spectra for all regions other than the south rim are extracted from OBSID 7923 data only. The south rim is a simultaneous fit to OBSID 7923 and 788.