Post-common-envelope binaries from SDSS. XI:
The white dwarf mass distributions of CVs and pre-CVs
?abstractname?
Context. We have known for a long time that many of the measured WD masses in cataclysmic variables (CVs) significantly exceed the mean mass of single white dwarfs (WDs). This was thought to be related to observational biases, but recent high-precision measurements of WD masses in a great number of CVs are challenging this interpretation. A crucial question in this context is whether the high WD masses seen among CVs are already imprinted in the mass distribution of their progenitors, i.e. among detached post-common-envelope binaries (PCEBs) that consist of a WD and a main-sequence star.
Aims. We review the measured WD masses of CVs, determine the WD-mass distribution of an extensive sample of PCEBs that are representative for the progenitors of the current CV population (pre-CVs) and compare both distributions.
Methods. We calculate the CV formation time of the PCEBs in our sample by determining the post common-envelope (CE) and the main-sequence evolution of the binary systems and define a pre-CV to be a PCEB that evolves into a semi-detached configuration with stable mass transfer within less than the age of the Galaxy. Possible observational biases affecting the WD-mass distribution for the pre-CV and the CV samples are discussed.
Results. The mean WD mass among CVs is ††thanks: The uncertainty refers to the standard deviation of the mass distribution. All uncertainties attached to mean masses quoted throughout this paper are computed this way and do not refer to the standard error of the mean (which is smaller by a factor of ). , much larger than that found for pre-CVs, . Selection effects cannot explain the high WD masses observed in CVs. We also note that compared to the predictions of binary-population models, the observed fraction of He-core WDs is small both among CVs () and pre-CVs ().
Conclusions. We suggest two possible explanations for the high WD masses among CVs, both of which imply substantial revisions to the standard model of CV evolution: either most CVs have formed above the orbital-period gap (which requires a high WD mass to initiate stable mass transfer or a previous phase of thermal-timescale mass transfer), or the mass of the WDs in CVs grows through accretion (which strongly disagrees with the predictions of classical nova models). Both options may imply that CVs contribute to the single-degenerate progenitors of Type Ia supernovae. The number of He-core WDs in CVs () is roughly consistent with the number of He-core WDs in pre-CVs (). This indicates a low value of the CE efficiency.
Key Words.:
binaries: close – novae, cataclysmic variables – white dwarfs1 Introduction
Cataclysmic variables (CVs) are compact binaries containing a white dwarf (WD) that accretes mass from a Roche-lobe filling donor via stable mass transfer (see Warner, 1995, for an encyclopedic review). The standard scenario for the formation of CVs proposed by Paczyński (1976) assumes that the progenitor systems were relatively wide binaries in which the more massive star (the primary) fills its Roche lobe during the first giant branch (FGB) or asymptotic giant branch (AGB) phase. Then, dynamically-unstable mass transfer from the giant to the less massive companion leads to a common-envelope (CE) configuration with the giant’s envelope engulfing the future WD and its companion. Owing to friction within the envelope, angular momentum and orbital energy are transferred from the binary orbit to the CE, and the separation between the primary core and the secondary star decreases in a spiralling-in process until the envelope is expelled, which is thought to happen in yr (Taam & Sandquist, 2000). The CE evolution terminates the mass growth of the core of the primary and produces a short-orbital-period detached post-common-envelope binary (PCEB) consisting of the core of the primary (typically a WD) and a low-mass secondary main-sequence (MS) star. The PCEBs eventually evolve into CVs through orbital-angular-momentum loss by gravitational radiation and magnetic-wind braking.
Since the first systematic studies of CVs were carried out, the mean masses of WDs in CVs have been found to lie in the range of , (Warner, 1973; Ritter, 1976; Warner, 1976; Robinson, 1976; Ritter, 1987), i.e. significantly exceeding the average mass of single WDs of (e.g. Koester et al., 1979; Bergeron et al., 1992; Kepler et al., 2007). This finding strongly contradicts the expectations for the intrinsic distribution of WD masses in CVs. Three evolutionary processes affect the WD masses in CVs: (1) CE evolution terminates the core growth of the primary stars, which reduces the expected CV WD masses compared to single WDs. (2) The second phase of mass transfer must be stable, which allows for a broader range of secondary masses for systems containing high-mass WDs. (3) Classical nova eruptions are supposed to slowly erode the WD masses of CVs (Prialnik, 1986; Prialnik & Kovetz, 1995), which should lower the WD masses of CVs. Processes (1) and (3) will lower the average WD mass, (2) will increase it. According to the most frequently assumed initial-mass-ratio distributions, initial-primary-mass function, and CE efficiency, CE truncation and WD erosion caused by nova eruptions should largely compensate the stability argument and the intrinsic CV WD mass distribution is expected to be dominated by WDs with . In particular, depending on the assumed CE efficiency, up to of CV primaries should be He-core WDs with (e.g. de Kool, 1992; Politano, 1996) but very few, if any, candidates have so far been identified (see e.g. Shen et al., 2009).
The measured high mean CV WD masses and the nearly complete absence of He-core WDs in observed samples have been explained as a selection effect by Ritter & Burkert (1986). Assuming that CVs are in general discovered because of the accretion generated luminosity, which is a strong function of the WD mass (, with ), these authors showed that this would lead to an observational bias in any magnitude-limited CV sample. For , Ritter & Burkert (1986) found that standard CV-population models would result in an observed mean WD mass of , consistent with the observations available at that time. For fainter CV samples, the authors predicted a decreasing mean WD mass, down to for . In addition, the bias considered by Ritter & Burkert (1986) should be much stronger above the orbital-period gap than below the gap, which should cause the mean WD mass of observed samples to be significantly higher above than below the gap.
Thanks to the Sloan Digital Sky Survey (SDSS Adelman-McCarthy et al., 2008; Abazajian et al., 2009), we now have a large, homogeneous sample of faint () CVs (Szkody et al. 2009, and references therein) that contains a substantial number of short-period CVs accreting at very low rates (Gänsicke et al., 2009). If the high masses of CVs in the early samples were indeed related to a selection effect related to their higher luminosity (Ritter & Burkert, 1986), this effect should be much less pronounced among the SDSS CVs. The measured WD masses of SDSS CVs, however, defy this expectation, because they are just as high as those among bright CVs (e.g. Littlefair et al., 2006b, 2008; Savoury et al., 2011). It is thus time to re-assess the WD-mass distribution of CVs, and discuss the findings in the context of CV evolution.
Important in this respect, SDSS has not only provided a deep sample of CVs, but also the first-ever large homogeneous population of detached white-dwarf/main-sequence (WDMS) binaries (e.g. Silvestri et al., 2007; Rebassa-Mansergas et al., 2010) of which a considerable fraction, %, are PCEBs (Rebassa-Mansergas et al. 2007, 2008, 2010; Schreiber et al. 2008; Nebot Gómez-Morán et al. 2009; Pyrzas et al. 2009; Schwope et al. 2009 and Nebot Gómez-Morán et al. 2011, submitted). Those PCEBs that will evolve into semi-detached binaries undergoing stable mass transfer on timescales shorter than the age of the Galaxy are representative of the progenitors of the current-day CV population.
We determine and compare the mass distributions of WDs in CVs and the WDs in their progenitors, investigate potential observational biases, and discuss potential causes for the the high masses of CV WDs. We start with a brief review of mass determinations of CV WDs.
2 The WD masses of CVs
A variety of methods can be used to determine the masses of WDs in CVs. In principle, knowledge of the radial velocity amplitudes of both stars, and , along with the orbital period and binary inclination, allows one to calculate both stellar masses straight away using Kepler’s third law. Knowledge regarding the inclination of the system usually comes from modelling its light curve, with the most accurate values being derived for eclipsing CVs. However, in most CVs, this method is only of limited use, because the WDs (and/or the companion stars) are outshone at optical wavelengths by the accretion disc/stream. Even if the WD (companion star) is sufficiently hot to dominate at ultraviolet (infrared) wavelengths, technological limitations have so far prevented dynamical mass measurements at wavelengths other than the optical.
Hence, much of the published work has been based on radial velocity proxies for either the WD or the companion star. For the WD, one commonly made assumption is that the emission lines of the accretion disc follow the motion of the WD around the centre of mass of the binary, and can hence be used to infer the radial velocity amplitude of the WD. However, in many cases the radial velocity curves of the emission lines are asymmetric, and/or offset in phase with respect to the expected motion of the WD, casting some doubt on the underlying assumption of this method. The pitfalls and limitations of dynamical mass determinations in CVs are discussed in detail by Shafter (1983) and Thorstensen (2000).
Modelling the optical light curves of eclipsing CVs where both WD and bright spot are detected allows one to constrain the stellar masses and radii, based on the assumptions that the bright spot lies along the ballistic trajectory of the accretion stream leaving the secondary star, and a WD mass-radius relation. The concept was pioneered for Z Cha by Smak (1979) and Cook & Warner (1984), and subsequently adopted for a handful of bright eclipsing CVs. The advent of ULTRACAM on large aperture telescopes (Dhillon et al., 2007), and an increasing sample of eclipsing CVs, predominantly from the SDSS (Szkody et al., 2009), led to a significant increase in the number of CVs with published high-precision WD masses (e.g. Feline et al., 2004a; Littlefair et al., 2006b; Savoury et al., 2011).
Another fairly robust method becomes available if the radial velocity amplitudes as well as the systemic (-) velocities of both stars can be measured. The difference between the -velocities of both stars corresponds to the gravitation redshift of the WD, which is a measure of its surface gravity, . An additional input for this method is a mass-radius relation for the WD. An application to U Gem (Sion et al., 1998; Long & Gilliland, 1999) finds a high mass for the WD, consistent with earlier estimates based on eclipse/dynamical studies (Zhang & Robinson, 1987).
Finally, the WD mass can also be inferred from ultraviolet spectroscopy if it dominates the emission from the CV at those wavelengths and has an accurate distance measurement. The ultraviolet spectrum is fitted for the effective temperature over a fixed range of WD masses. The scaling factor between the model flux and observed flux then yields the WD radius, which, combined with a WD mass-radius relation, yields a unique solution for the WD mass. See Long et al. (2004) and Gänsicke et al. (2006) for applications of this method to WZ Sge and AM Her.
2.1 Observational census
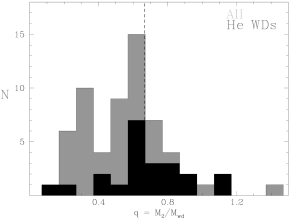
The observational challenge in measuring CV WD masses is underlined by the fact that only 116 out of 849 CVs listed in the catalogue of Ritter & Kolb (2003, V7.14) have an entry for their WD mass. Figure 1 shows the orbital-period distribution of these WD masses, where we exclude systems with no published uncertainty of the WD mass, as well as a lower limit for the mass of the WD in GK Per, and we include the recent results of Savoury et al. (2011). The resulting final sample contains 104 objects. From this list of systems we defined a “fiducial” sub-sample of 32 robust high-quality WD-mass measurements (Table LABEL:tab:cvmass). This selection is necessarily subject to some personal bias, but we felt that comparing a well-defined sub-sample was helpful in assessing the overall quality of CV WD mass measurements. The mean mass of the 32 fiducial CV WDs is , compared to for the whole sample, i.e. both samples are fully consistent with the major difference being the smaller standard deviation among the fiducial CVs. Inspecting Fig. 1 strongly suggests that this standard deviation is related to intrinsic scatter in the CV WD masses, rather than to the uncertainties in the measurements. The mean of the fiducial CV WD masses below and above the period gap are and , i.e. there is no significant difference in the mean WD mass between these two subsets of systems, but the scatter around the mean value is significantly larger above the gap. That there is no significant difference in the mean WD mass above and below the gap clearly disagrees with Ritter & Burkert’s (1986) prediction of a strong dependence of on the orbital period.
The only CV with a WD mass that is significantly below 0.5 is T Leo (aka QZ Vir): Ritter & Kolb (2003) quote an extremely low value of from the PhD thesis of Allen Shafter; however, Shafter & Szkody (1984) state that “The mass of the WD most likely lies in the range 0.35–0.4 .” Only of the 104 CVs with available WD-mass estimates and errors have , and none of the systems in the sub-sample of 32 with presumably more reliable mass determinations. We therefore conclude that the fraction of He-core WDs in the observed sample of CVs is .

2.2 Possible observational biases
Given that the presently observed accretion luminosity of a CV scales as , and for WDs, a higher WD mass will result in a higher accretion luminosity, and hence, at face value, a higher probability of detecting the system in a magnitude-limited sample. Possible selection effects related to the WD mass were discussed in some detail by Ritter & Burkert (1986). Using a simple model for the evolution of CVs and considering a magnitude-limited sample with a limiting magnitude of , they find observational selection effects to be sufficient to explain the observed mean WD masses of found for CVs dominated by accretion disc luminosity, i.e. dwarf novae in outburst and nova-like variables. Ritter & Burkert (1986) further predict that the selection should be weaker for short-orbital-period systems and that selection effects should nearly disappear for limiting magnitudes of .
Over the past decade, a great number of short-period CVs in which the WD dominates the optical emission have been discovered in the SDSS (Szkody et al., 2009; Gänsicke et al., 2009) and the eclipsing systems are prime candidates for detailed stellar parameter studies (e.g. Littlefair et al., 2006b, 2008). In contrast to previous samples, the SDSS CV population was not selected by outburst properties or X-ray emission, but purely on the basis of non-stellar colours. The colour space spanned by the CV population overlaps with that of quasars, and hence the completeness of the SDSS CV sample is similar to that of the quasars, i.e. % (Richards et al., 2002, 2004). The brightness of these systems is predominantly set by the luminosity of the accretion (compressionally) heated WD, and hence depends on the secular mean accretion rate (Townsley & Bildsten, 2002, 2003, 2004; Townsley & Gänsicke, 2009). This possible mass-dependent observational bias is not covered by the discussion of Ritter & Burkert (1986), and hence needs to be investigated.
The quiescent WD luminosity as a function of the secular mean accretion rate and WD mass is given by Eq. (1) in Townsley & Gänsicke (2009). From this, (Fig. 2, top panel). Given that only mildly depends on , the increase of as a function of almost entirely arises because of the decrease in (Fig. 2, second panel form the top). A slight complication is that depends on both and , and hence Eq. (1) from Townsley & Gänsicke (2009) cannot be solved analytically. We account for this by computing with an initial using Nauenberg’s (1972) zero-temperature mass-radius relation, and then iteratively re-compute with from Bergeron et al. (1995)111Updated cooling models are available at http://www.astro.umontreal.ca/bergeron/CoolingModels/. and determine the absolute -band magnitude, , which is again obtained from the cooling models of Bergeron et al. (1995) (Fig. 2, third panels from the top).

The WD-dominated SDSS CVs were predominantly found as a by-product of the main (ultraviolet-excess) quasar survey (Richards et al., 2002), which spans a magnitude range 222Technically, the limiting magnitude of the main quasar survey is a de-reddened , however, given that extinction is low at high galactic latitudes and weak at long wavelengths, this introduces only minute changes as a function of the specific line-of-sight. The bright end of the spectroscopic follow-up is limited by the SDSS imaging saturating., and is % complete (Richards et al., 2004). determined above therefore translates into a minimum and maximum distance at which a system will be spectroscopically followed-up by SDSS (Fig. 2, fourth panels from the top). The effective survey volume of SDSS as a function of and is then given by integration of a spherical cap, adopting galactic latitudes and a scale height of pc, for distances (Fig. 2, fifth panel from the top). The probability of identifying a CV with a given and is proportional to the effective survey volume, and given, relative to the probability of identifying a CV containing a WD of , in the bottom panel of Fig. 2.
While the probability of identifying WD-dominated CVs in SDSS does not depend very strongly on , a clear trend disfavouring more massive WDs is observed. This can be understood qualitatively as follows. For the considered range of and , the WD spectrum in the -band is close to a Rayleigh-Jeans distribution, and hence the flux . As outlined above, is only a mild function of , and as , the WD mass-radius relation dominates, resulting in an increase of as a function of . Two caveats to this investigation are that is the average luminosity over a classical nova cycle, the luminosity of individual systems will scatter somewhat around that value (Townsley & Bildsten, 2004), and the bright spot will contribute some fraction of the -band light, which will lead to a slight compensation of the bias against high-mass WDs.
We can summarize our findings for the WD masses in CVs as follows:
-
•
The mean mass of CV WDs is , independent of their apparent magnitude.
-
•
The mean WD masses of CVs below and above the orbital-period gap do not differ significantly.
-
•
For short-period WD-dominated CVs, similar to those identified by the SDSS, the observed high average mass (Sect. 2.1) has to be taken as a good representation of the intrinsic mass distribution of these systems; in particular, there is no significant bias against finding low-mass/He-core WDs.
Unless the recent high-quality measurements of CV WD masses are systematically wrong, these three findings are in clear contrast to the predictions of Ritter & Burkert (1986), i.e. that the average WD mass within an observed sample of CVs should decrease with increasing limiting magnitude, and that the average WD mass should increase towards longer orbital periods. Therefore the analysis regarding the origin of the high WD masses in CVs has to be revisited, in particular in the context of the information held by the WD mass distribution of CV progenitors.
3 From PCEBs to pre-CVs
A large sample of PCEBs has been identified by follow-up observations of WDMS binaries identified with SDSS. Here, we complement these SDSS PCEBs with systems that have been identified independent of SDSS and extract a sample of PCEBs that could be representative of the progenitors of present day CVs.
3.1 The PCEB sample
The sample of PCEBs analysed here consists of the 60 WDMS PCEBs with accurate parameters (35 new systems identified by SDSS and 25 previously known systems) listed in Zorotovic et al. (2010, hereafter Z10) with the exception that we excluded SDSS because its WD mass is extremely uncertain (). We also added three PCEBs from SDSS for which we determined orbital periods since the publication of Z10 (a full overview on the PCEBs from SDSS for which orbital periods have been measured will be presented in Nebot Gómez-Morán et al. 2011, submitted). Hence, our final sample contains 62 PCEBs (Table LABEL:tab:prop). Note that some of the masses listed in Table LABEL:tab:prop slightly differ from those in Z10 because we refined our spectral-fitting routine (see Rebassa-Mansergas et al., 2011). The sixth column labelled “Type” indicates the most probable type of WD (He-core or C/O-core) according to the mass derived from observations. For systems with we cannot decide which type of WD is the most probable because this range of WD masses is not allowed by stellar evolution models333Strictly speaking, these primary masses may result from CE evolution occurring when the core of the giant is not yet fully degenerate, which leads to hybrid HeC/O core sdB post-CE primary stars. However, here we ignore this channel because it is not an important CV formation channel.. We determine the type of the WD (He-core or C/O-core) for a given value of the CE efficiency using our reconstruction algorithm in Sect 3.4.
3.2 The past and future evolution of known PCEBs
The first step in our reconstruction is to compute the time that passed since the binary left the CE (), which is estimated by interpolating cooling tracks of Althaus & Benvenuto (1997) for He-core WDs and Wood (1995) for C/O-core WDs. To reconstruct the post-CE evolution we follow Schreiber & Gänsicke (2003). As evidence for a discontinuity in the braking law for low-mass secondary stars is growing (Schreiber et al., 2010, and references therein), we here assume the latest version of disrupted magnetic braking from Hurley et al. (2002) with the normalization provided by Davis et al. (2008) to obtain the period the binary had just after the CE phase (), i.e.,
| (1) |
where the masses and the radius of the secondary are in solar units, the observed period () is in years, , and is the mass of the secondary’s convective envelope, given by
| (2) |
for (see Hurley et al., 2000). For we assume that the binary is losing angular momentum only due to gravitational radiation.
We then use Eq. (11) from Schreiber & Gänsicke (2003, corrected as in Z10) to compute the period the PCEBs will have when becoming semi-detached again (), i.e. the period when they will start mass transfer as CVs. Replacing by and by in Eq. 1 finally gives the corresponding duration ().
To compute the duration of the pre-CE evolution, i.e. the time the systems needed to enter the first phase of mass transfer, we need to derive the mass of the progenitor of the WD for each system. To reconstruct the CE evolution of the PCEBs in our sample we use the energy equation, including a fraction of internal energy of the envelope, and assume based on the results of Z10. As in Z10 we include the effects of internal energy in the structural parameter . The energy equation then becomes
| (3) |
where , and are the total mass, envelope mass, and radius of the WD progenitor at the onset of the mass transfer, and is the structural parameter including a fraction of the internal energy available in the giants envelope. We further assume that the observed WD mass is equal to the core mass of the giant progenitor at the onset of mass transfer and use the single-star evolution (SSE) code from Hurley et al. (2000) to calculate as well as the equations from the latest version of the binary-star evolution (BSE) code from Hurley et al. (2002)444The latest version of the BSE code provides an algorithm that computes including a user-defined fraction of internal energy. This routine is based on fits to detailed stellar models from Pols et al. (1998). to compute the values of , for different values of (in steps of 0.01 ). Using this in Eq. 3, we numerically obtain a solution for . The SSE code also gives us for each system in our sample the age () and the actual mass of the progenitor (considering mass-loss) when it fills the Roche lobe. We adopt a minimum initial mass of for the progenitor because stars with smaller initial masses have not had enough time to evolve off the MS in less than yr. For more details and a discussion of the assumption see Z10.
Finally, the total time since the binary was born until it becomes a CV, , is given by the sum of the estimated lifetime of the primary before it fills the Roche lobe, , the present cooling age, , and the time the PCEB still needs to become a CV, .
3.3 Pre-CVs: representative for progenitors of current CVs
Because the following analysis of CV progenitors is motivated by the WD-mass distribution of the present-day CV population, we define a pre-CV to be a PCEB that could have been a progenitor of a present-day CV. These systems need to have CV formation times () shorter than the age of the Galaxy and the second mass-transfer (CV) phase must be stable.
Assuming full conservation of mass and orbital angular momentum of the binary, Hjellming & Webbink (1987) obtained a limit on the mass ratio for dynamically-stable mass transfer of for complete polytropes that represent an excellent approximation for fully convective stars. According to Warner (1995) this limit remains very similar, , for secondaries up to (see also de Kool, 1992, their Fig. 2). Throughout this work we use (but note that for non-conservative mass transfer the value of can significantly differ from this value). Systems with mass ratios exceeding and experience unstable mass transfer that is likely to cause a second CE phase resulting in a merger or the generation of double-degenerate systems instead of CVs. For more massive secondaries () the second mass-transfer phase can be dynamically stable but thermally unstable if the mass ratio is . These systems may evolve into CVs following a period of thermal-timescale mass transfer (Rappaport et al., 1994; Schenker & King, 2002; Schenker et al., 2002). However, because all the systems in our sample have (except IK Peg which, owing to its long orbital period and high secondary mass, will start mass transfer when the secondary becomes a giant, and the system will probably enter a second CE phase), we decided to use as a limit to become a CV for all the PCEBs in our sample.
For the age of the Galaxy we assume yr (Pasquini et al., 2004).
3.4 The future zero-age CV population
Using the tools described in the previous section, we have reconstructed the evolutionary history of the PCEBs in our sample as well as calculated their future evolution into CVs. Table LABEL:tab:res lists the corresponding results for each system, i.e. the mass of the WD we used for all the subsequent computations (), the current mass ratio (), the period the PCEB had just after the CE phase (), the initial mass of the progenitor of the WD (), the mass of the progenitor of the WD when it fills the Roche lobe (), the initial orbital separation (), the period that it will have when it becomes a CV (), and the durations of the different evolutionary phases as well as the total CV formation time (, , , ). Pre-CVs, i.e. PCEBs that are representative of the progenitors of the present-day CV population, are set in bold. Note that slightly differs in some cases from the spectroscopic mass estimate because, e.g., WD masses in the range of contradict fundamental predictions of CE evolution. As noticed, e.g., by Politano (1996) WD masses in this range should not appear in the mass distribution of WDs in PCEBs because they are larger than the maximum core mass of stars on the FGB and smaller than the core mass on the AGB having the same radius. In these cases we use the WD mass closest to the observed value in Table LABEL:tab:prop that provides a solution for in the range of . Because the real value of is still uncertain, we give priority to find a core mass closer to the observed WD mass for these systems, allowing to vary within this range. Although the fraction of systems with He-core WDs may be slightly different for different values of , the main conclusions of this work are not affected by this uncertainty.
3.4.1 Notes on individual systems
For five systems containing He-core WDs (EC, UX CVn, SDSS, SDSS, and SDSS), we could not determine the cooling age because the cooling tracks from Althaus & Benvenuto (1997) corresponding to their masses start at lower temperatures. However, this means that these systems are young enough ( Gyr) to neglect the cooling age and to assume the current period to be very similar to the period the PCEB had at the end of the CE phase, i.e. .
SDSS has notionally , i.e. according to the mass ratio and measured period, this systems should already be a CV. We exclude this system from our list of pre-CVs because the small separation implies that it might not be a PCEB, but a detached CV in the period gap (Davis et al., 2008).
WD is a well-studied PCEB containing a WD plus brown dwarf (Burleigh et al., 2006), which will start mass transfer at a very short period below the orbital-period minimum.
3.4.2 Mass-ratio distribution
Inspecting Table. LABEL:tab:res, our sample contains 22 PCEBs with He-core () and 40 with C/O-core WDs ( ), corresponding to a He-core WD fraction of . Figure 3 shows the mass-ratio distribution of the 62 PCEBs. Applying the criterion for outlined in Sect. 3.3, only 43 of the 62 systems will evolve into CVs with stable mass transfer. Among those, 11 () contain a He-core WD (black histogram in Fig. 3).
3.4.3 Evolution timescales
Figure 4 shows the different timescales we computed for all systems. We use different symbols to distinguish between systems with He-core and C/O-core WDs. The main difference between the two populations is related to the pre-CE evolution time (), which is continuously decreasing with increasing . The PCEBs containing He-core WDs need at least yr to be formed (see also Politano, 1996), i.e. these systems were already old when they entered the CE phase. In contrast, PCEBs containing C/O-core WDs can have massive progenitors and short pre-CE lifetimes. It is also evident from Fig. 4 that, in general, our sample is dominated by systems with , which implies that most currently observed PCEBs have so far only completed a small fraction of the time they will spend as PCEBs. This may introduce a minor bias against high-mass WDs in pre-CVs because the undetected systems with longer need to have shorter to become CVs within the age of the galaxy.

If we apply both cuts in and , we are left with 24 systems that we consider to be genuine pre-CVs, i.e. representative for the progenitors of the current-day CV population. The fraction among these pre-CVs that have He-core WDs is (4 of 24 systems).
3.4.4 The WD-mass and orbital-period distribution
Figure 5 shows the relation between the mass of the WDs in our sample and the orbital period they will have when they start the future CV mass-transfer phase. Most PCEBs are going to start the mass transfer above or in the period gap. Pre-CVs (solid symbols) containing low-mass WDs ( ) tend to start the mass transfer in or below the gap. This is consistent with the results of de Kool (1992) and Politano (1996), who predicted that CVs that start mass transfer in or below the gap are usually older than those formed above the gap, and that the CV population above the gap should not contain systems with He-core WDs.
The average mass of the pre-CV WDs is , which is slightly larger than the average for single WDs, but still well below the observed average for CVs.

3.5 Potential selection effects in the PCEB sample
In Sect.2.2 we have shown that the WD-mass distribution of CVs from SDSS is not significantly biased. Before comparing the pre-CV WD-mass distribution obtained here with the WD-mass distribution of CVs from Sect. 2.1, we have to carefully inspect potential observational selection effects for our PCEB and pre-CV samples that could have affected our pre-CV WD-mass distribution.
3.5.1 Identifying PCEBs in SDSS
Identifying WDMS binaries using SDSS spectra requires both stellar components to be clearly visible in the spectrum. This introduces a bias towards bigger less massive WDs that are easier to detect against a companion. This effect has recently been analysed in detail by Rebassa-Mansergas et al. (2011), who obtained the following result. Assuming a scale height of pc and considering only systems containing WDs hotter than K and M-dwarf companions, the detection of a PCEB containing a He-core WD is times more likely than of a PCEB containing a C/O-core WD. This implies that the PCEB and pre-CV samples analysed here are also slightly biased towards systems containing low-mass WDs and that the intrinsic fraction of He-core pre-CVs is likely lower than the we obtained.
3.5.2 Bias against early-type companions
Stable mass transfer (in the second mass-transfer phase of the binary) is one of the crucial conditions for a PCEB to become a CV, and therefore possible biases concerning the mass of the secondary star also have to be considered. The PCEBs with secondary stars earlier than M3 are underrepresented in our sample because of two reasons. First, because magnetic braking is inefficient in fully convective stars but a strong source of angular momentum loss in systems with non-fully convective secondary stars (), the latter spend significantly less time in the evolutionary phase between the CE and the second mass-transfer phase (Politano & Weiler, 2006; Schreiber et al., 2010). Second, our PCEB survey (e.g. Rebassa-Mansergas et al., 2007) is limited to M-dwarf secondary stars and we therefore entirely miss pre-CVs with K- to F-type companions. The mass distribution of the secondaries in our sample, shown in the top panel of Fig. 6, peaks at (spectral type M3–M4) and steeply declines towards higher masses. Because PCEBs with secondaries earlier than M3 must contain C/O-core WDs to become stable-mass-transfer systems, the bias against high-mass secondary stars in PCEBs implies a bias against high-mass WDs in pre-CVs. Whether or not this bias results in a dramatic bias against high-mass WDs in the emerging pre-CV sample depends entirely on the initial-mass-ratio distribution.
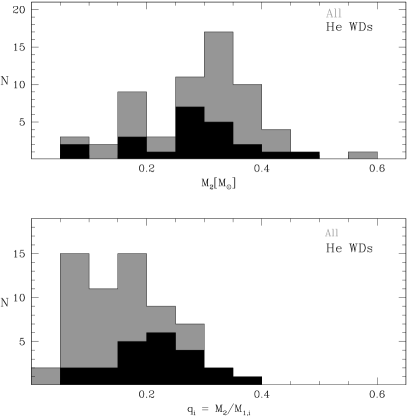
In the bottom panel of Fig. 6 we show the initial-mass-ratio distribution reconstructed from our systems. The shape is similar to those obtained in most studies of the mass-ratio distributions of MS binaries in the range of , i.e. the distribution increases towards low values of and steeply declines for very low values (see e.g. Trimble, 1990; Duquennoy & Mayor, 1991; Mazeh et al., 1998). This seems to support the assumption of an initial-mass-ratio distribution favouring unequal masses. One should, however, keep in mind that the distribution shown in Fig. 6 may significantly differ from true the initial-mass-ratio distribution because of two reasons. First, the initial-mass-ratio distribution reconstructed from PCEBs might be slightly different from the intrinsic mass-ratio distribution because a higher fraction of systems containing very low-mass secondaries may merge instead of expelling the envelope. Second, and probably more important, as we already mentioned our PCEB sample is biased against systems containing secondary stars earlier than M3, which might have strongly contributed to the observed decline in the number of systems towards larger mass ratios.
3.5.3 Spectroscopic WD masses
As discussed in detail in Rebassa-Mansergas et al. (2010), recent work (Falcon et al., 2010; Tremblay & Bergeron, 2009) suggests that WD mass determinations from fitting model atmospheres to observed spectra may underestimate the masses of the WDs. Because the WD masses used in this work have been obtained with such an algorithm combined with spectral-decomposition methods (Rebassa-Mansergas et al., 2010), it might be that the WD masses given here are systematically smaller than the true WD masses by . This may again reduce the intrinsic number of PCEBs and pre-CVs containing He-core WDs but will certainly not change the overall appearance of the WD-mass distribution.
In summary, all the possible biases mentioned above point towards a higher intrinsic mean mass of the WDs in our PCEB sample. How dramatic these biases are mainly depends on the still unknown initial-mass-ratio distribution, as we will discuss in more detail in Sect. 5
4 Comparing pre-CV, PCEB, and CV WD-mass distributions
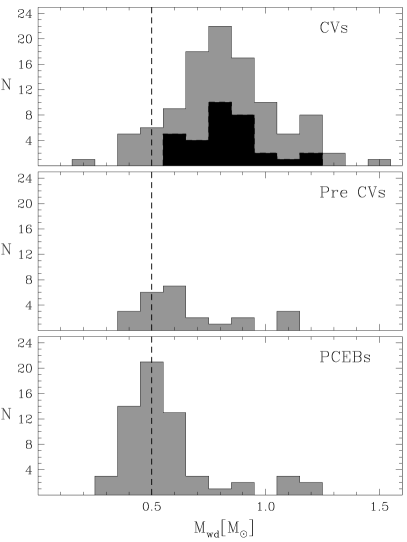
After reviewing the measurements of the WD masses in CVs and determined the WD-mass distributions of PCEBs and pre-CVs, we may now compare these distributions. Figure 7 shows the WD-mass distributions of CVs (top), pre-CVs (middle), and PCEBs (bottom). The main difference between PCEBs and pre-CVs is that in the latter we had to exclude mostly systems with low-mass WDs, mainly because of their long evolutionary timescales or unstable mass ratios, an exclusion consistent with the lack of low-mass WDs in CVs. The mean WD mass for PCEBs is and it increases to for pre-CVs. The low-mass tail of the CV and pre-CV distributions look similar, i.e. increasing towards higher masses up to . However, a dramatic difference between the distributions is that CVs are dominated by systems containing high-mass WDs (), which are nearly absent in the pre-CV or PCEB sample.
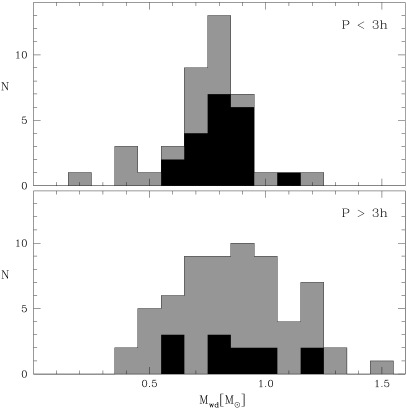
Important information concerning the origin of the high WD masses in CVs might be provided by inspecting the dependence on the orbital period. In Fig. 8 we divided the WD-mass distribution of CVs into systems that are in or below the period gap (top panel) and systems above the period gap (bottom). As mentioned in Sect. 2.1, the mean WD masses do not differ significantly, however, systems above the period gap show a broad distribution, while systems with h show a strong peak at . This result remains if we only consider those systems with the most reliable WD mass determinations, the fiducial sub-sample of 32 systems (black histogram in both panels).
However, we advocate some caution when interpreting this result: The fiducial sub-sample is subject to small number statistics and the apparent difference between short- and long-orbital-period systems might be related to the more inhomogeneous combination of methods used for WD mass determinations in CVs above the gap (see Table LABEL:tab:cvmass), which might introduce significant scatter.
5 Discussion
The main results obtained in the previous sections can be summarized as follows. The masses of CV WDs do significantly exceed the WD masses of both pre-CVs and single WDs. The high masses of CV WDs cannot be explained as the consequence of observational biases. The mean CV WD masses below and above the period gap are very similar but the mass distribution seems to be broader above the gap. Finally, very few, if any, He-core WD candidates are known in CVs and the fraction of He-core WDs in pre-CVs is . Below we briefly review the predictions of binary-population-synthesis (BPS) models of CVs before discussing possible explanations for the high mean WD masses in CVs.
5.1 BPS models of CVs
The first BPS model of CVs and their progenitors has been presented in a pioneering work by de Kool (1992), who calculated the formation rates of CVs for different initial-mass-ratio distributions and CE efficiencies (for similar studies see de Kool & Ritter, 1993; Kolb, 1993; King et al., 1994; Politano, 1996; Howell et al., 2001). The conclusions of these early works can be summarized as follows.
-
•
The most crucial uncertain parameters are the initial-mass-ratio distribution and the CE efficiency. The peak of the orbital-period distribution predicted by BPS models of PCEBs depends crucially on the initial-mass-ratio distribution, while the width of the peak depends on the CE efficiency .
-
•
The WD-mass distribution of newly formed CVs is bimodal with maxima at (He-core WDs) and (C/O-core WDs). The fraction of He-core WDs in CVs can be up to but decreases for low values of the CE efficiency.
-
•
If the initial-mass-ratio distribution favours unequal masses, most CVs are born below the gap.
-
•
If the initial-mass-ratio distribution favours equal masses and/or the CE efficiency is small and/or CVs descending from super soft X-ray binaries are included, most CVs might be born above the orbital-period gap.
-
•
Most importantly in the context of this paper, the predicted mean WD mass of BPS models for CVs are typically well below the mean WD mass of single stars (see e.g. Politano, 1996, who predicts ).
5.2 Initial-to-final mass relations
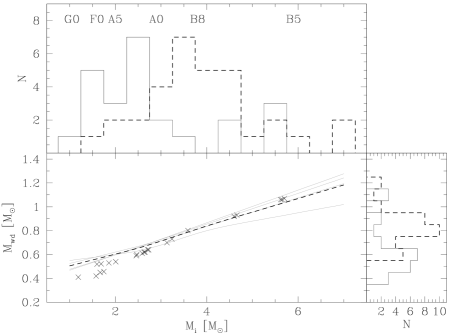
Before discussing the implications of our results for the standard theory of CV evolution, we emphasize and illustrate our main finding once more, i.e. the obtained difference of WD masses in pre-CVs and CVs. The right-hand side of Fig. 9 shows the distribution of WD masses for the pre-CVs in our sample (solid histogram) and for the sample of 32 fiducial CVs (dashed histogram). In the bottom left panel we compare the initial-to-final mass (IFM) of the WDs in our pre-CV sample (crosses) with different theoretical and empirical IFM relations for single-star evolution (grey lines, from top to bottom: Catalán et al. 2008, Williams et al. 2009, Casewell et al. 2009, and Weidemann 2000). The black dashed line corresponds to the average of the four IFM relations. The differences between the reconstructed initial masses for the pre-CVs and the average IFM relation are negligible for , which is true for all fiducial CVs. Therefore we can use the average IFM relation to obtain a reasonable guess of the initial mass for the WDs in CVs. The top panel, finally, compares the distribution of reconstructed initial masses for the WDs in our sample of pre-CVs (solid histogram) with the distribution of initial masses for the WDs in the 32 fiducial CVs obtained from the average IFM relation (dashed histogram). Even considering that there might be an error of in the progenitor masses for the CV WDs, the far-reaching consequences of the high WD masses in CVs are evident: Either CV WDs grow in mass, or the vast majority of the currently known CV WDs must be the descendants of very massive progenitors (). In the following sections we discuss both options.
5.3 Mass growth in CVs?
First, we assume that the initial-mass-ratio distribution favours unequal masses and that both the measured mean WD masses of CVs and pre-CVs are good approximations of the corresponding intrinsic population. In this case, CV WD masses must grow through accretion as suggested also by Savoury et al. (2011). Most CVs below or in the gap would have been born there. The formation time would be dominated by the slow post-CE evolution driven only by angular momentum loss through gravitational radiation with total CV formation times longer than yr. Because virtually all WD masses are allowed by the stability criterion, one would expect a superposition of the corresponding pre-CV WD-mass distributions shifted towards higher masses depending on their age as a CV. Furthermore, one would expect a slight increase of the WD mass towards shorter orbital periods below the gap. Inspecting Figs. 1 and 8 one might like to speculate that this is the case but more high-quality WD-mass measurements of CVs are certainly required. In contrast, CV formation above the gap would have started earlier because magnetic braking significantly reduces the time between the CE and CV phases. For each starting orbital period a different range of WD masses is allowed and the evolution towards shorter orbital periods is fast. One would therefore expect a fairly broad distribution similar to the observed one.
However, this scenario has the obvious and dramatic disadvantage that it contradicts all current theories of nova eruptions. Simulations of nova outbursts predict that the amount of ejected mass is larger than the amount of accreted matter (see e.g. Prialnik & Kovetz, 1995; Yaron et al., 2005), except in the case of very high mass-transfer rates (), which implies that in most of the cases the mass of the WD decreases during the CV phase. The observed abundances of nova ejecta are found to be enriched in heavy elements, which is used as an argument in favour of core erosion (see e.g. Truran & Livio, 1986; Livio & Truran, 1994). If mixing of accreted material with the core of the WD is not very efficient, the observed abundances can only be explained by expelling more mass than has been accreted (Livio & Truran, 1992). However, the mixing theory is far from being understood, and there is not even agreement on the most important mechanisms. In the last decade, some efficient mechanisms have been proposed, such as gravitational waves at the interface between the envelope and the WD (Alexakis et al., 2004), or Kelvin-Helmholtz instabilities that occur when the interface becomes convectively unstable (Casanova et al., 2010). The amount of enhancement these studies obtain seems to agree with the observations. In addition, the amount of ejected mass predicted by the models is very sensitive on the nuclear-reaction rates used in the model calculations, and also on the specific nuclear reactions that are taken into account (see e.g. Starrfield et al., 2009). Finally, one key point to keep in mind is that the observed classical novae are not at all representative of the entire CV population, because the nova recurrence time is decreasing with increasing mass-transfer rate and increasing WD mass, and therefore the classical novae are strongly biased towards high-mass WDs in novalike variables with high mass-transfer rates.
In summary, observations of nova ejecta and theoretical predictions seem to indicate erosion of the WDs in CVs during a nova cycle, but considering the remaining caveats we tend to not generally exclude the possibility of WD mass growth in CVs.
5.4 Are the known pre-CVs just the tip of the iceberg?
The second option to explain the high WD masses in CVs considers the possibility that the currently known sample of pre-CVs presented here is not really representing the intrinsic properties of the galactic pre-CV population. We already know that there are strong selection effects disfavouring companion stars with spectral types earlier than M3, i.e. masses , both because of the limited contrast ratio of the optical surveys (predominantly SDSS), and because of efficient magnetic braking in these systems that leads to short evolutionary timescales. This bias can be dramatic if the initial-mass-ratio distribution is flat, i.e. , or even worse if it favours the formation of binaries with equal masses (often referred to as the “twin peak”, see e.g., Söderhjelm, 2007; Lucy, 2006; Simon & Obbie, 2009). In this case, the intrinsic population of pre-CVs would be dominated by systems with relatively massive secondary stars. For pre-CVs with massive secondaries the mass-ratio limit for stable mass transfer requires the WD masses to be relatively high () in order to start stable mass transfer, or the binary must evolve through a period of thermal-timescale mass transfer before it becomes a CV. In the latter case the system appears as a super-soft X-ray source with stable nuclear burning on the surface of the WD allowing the WD mass to grow (Schenker et al., 2002). Indeed, direct evidence for CVs descending from super-soft sources has been provided by Gänsicke et al. (2003), who find CNO abundances to agree with previous thermal-timescale mass transfer in of CVs with UV spectra. Hence, CVs descending from pre-CVs with high-mass secondaries, which have not been identified so far, may represent an important fraction of the current CV population. However, whether the bias against high-mass secondaries in our pre-CV sample can be strong enough to explain the high WD masses of the observed CV sample has to be clarified by performing BPS models. In addition, if indeed the vast majority of CVs below the gap are descendants from CVs above the gap, one would expect the shape of the CV WD-mass distributions above and below the gap to be very similar, which does not seem to be the case (see Fig.8 and the discussion in the corresponding section).
5.5 A note on Type Ia supernovae progenitors
The two currently most popular candidates for Type Ia supernovae (SNe Ia) progenitors are either close double C/O-core WDs with a total mass exceeding the Chandrasekhar limit (the double-degenerate channel, see e.g. Webbink 1984; Iben & Tutukov 1984) or super-soft X-ray sources, i.e. close WDMS binaries with thermal-timescale mass transfer (the single-degenerate channel, see e.g. van den Heuvel et al. 1992; Kahabka & van den Heuvel 1997). Recent studies of the time-delay distribution of SNe Ia (see e.g. Maoz 2010, and references therein) indicate the existence of two populations of SNe Ia, a prompt channel that leads to explosions in Myr and a delayed population that produces SNe Ia on much longer timescales (Gyr, Mannucci et al., 2006; Scannapieco & Bildsten, 2005; Sullivan et al., 2006).
Both options proposed above as possible explanation of the high WD masses in CVs may have implications for the still open question of which objects actually produce SNe Ia. If most CVs descend from super-soft sources, great numbers of SNe Ia emerging from the single-degenerate channel mostly with short delay times are expected. If, on the other hand, CV WDs grow in mass through accretion, those born with sufficiently large WD masses may explode as a SNe Ia. Owing to their long formation times and their relatively low accretion rates, CVs would contribute to the long delay time SNe Ia population.
We note in passing that the importance of the single-degenerate channel is questioned by recent observational results. The observed X-ray fluxes of early-type galaxies seems to be too low to be consistent with the prediction of large populations of super-soft sources (Gilfanov & Bogdán, 2010; Di Stefano, 2010) unless the super-soft phase is very short (Hachisu et al., 2010). Also, the non-detection of radio emission in a sample of 27 SNe Ia (Panagia et al., 2006) appears to contradict the single-degenerate scenario unless the accretion process onto the WD in the SN progenitor system proceeds without significant systemic mass loss to the interstellar medium.
6 Conclusion
We have investigated the WD-mass distributions of CVs and pre-CVs and draw the following conclusions.
-
•
The fraction of He-core WDs is small in both samples i.e. (pre-CVs) and (CVs), which agrees better with BPS models if a low efficiency for CE evolution () is assumed.
-
•
There is no significant evolution of WD mass with orbital period.
-
•
The mean WD mass of CVs significantly exceeds that of pre-CVs and PCEBs. This cannot be explained as an observational bias towards the detection of CVs containing high-mass WDs.
To the best of our knowledge, the two only plausible options to explain the measured high mean WD masses in CVs are either a large population of PCEBs with early-type secondaries (partly evolving into CVs through thermal-timescale mass transfer) that has so far not been identified, or WD mass growth in CVs through accretion. While the latter option contradicts theories of nova eruptions, the first implies an initial-mass-ratio distribution that favours equal masses, which contradicts most observational studies of MS binaries. Both alternatives are very uncomfortable solutions, and proving either of them correct would have far-reaching implications for our understanding of compact-binary formation and evolution. Both alternatives also have possible implications for the pathways to SN Ia: the first option would imply a large population of super-soft X-ray binaries, representing an important fraction of CV progenitors; the second option would imply that a fraction of main-stream CVs can become SN Ia with long delay times. A crucial step towards a more definitive answer to this question is to overcome the observational biases against PCEBs with F, G, or K-type companions.
Acknowledgements.
MZ is supported by an ESO studentship. MRS acknowledges support from FONDECYT (grant 1061199 and 1100782). We thank the referee, Ronald Webbink, for his excellent comments that helped to improve this paper.?refname?
- Abazajian et al. (2009) Abazajian, K. N., Adelman-McCarthy, J. K., Agüeros, M. A., et al. 2009, ApJS, 182, 543
- Adelman-McCarthy et al. (2008) Adelman-McCarthy, J. K., Agüeros, M. A., Allam, S. S., et al. 2008, ApJS, 175, 297
- Alexakis et al. (2004) Alexakis, A., Calder, A. C., Heger, A., et al. 2004, ApJ, 602, 931
- Althaus & Benvenuto (1997) Althaus, L. G. & Benvenuto, O. G. 1997, ApJ, 477, 313
- Araujo-Betancor et al. (2003) Araujo-Betancor, S., Knigge, C., Long, K. S., et al. 2003, ApJ, 583, 437
- Bergeron et al. (1992) Bergeron, P., Saffer, R. A., & Liebert, J. 1992, ApJ, 394, 228
- Bergeron et al. (1994) Bergeron, P., Wesemael, F., Beauchamp, A., et al. 1994, ApJ, 432, 305
- Bergeron et al. (1995) Bergeron, P., Wesemael, F., Lamontagne, R., et al. 1995, ApJ, 449, 258
- Bleach et al. (2000) Bleach, J. N., Wood, J. H., Catalán, M. S., et al. 2000, MNRAS, 312, 70
- Bragaglia et al. (1995) Bragaglia, A., Renzini, A., & Bergeron, P. 1995, ApJ, 443, 735
- Burleigh et al. (2006) Burleigh, M. R., Hogan, E., Dobbie, P. D., Napiwotzki, R., & Maxted, P. F. L. 2006, MNRAS, 373, L55
- Casanova et al. (2010) Casanova, J., José, J., García-Berro, E., Calder, A., & Shore, S. N. 2010, A&A, 513, L5
- Casewell et al. (2009) Casewell, S. L., Dobbie, P. D., Napiwotzki, R., et al. 2009, MNRAS, 395, 1795
- Catalán et al. (2008) Catalán, S., Isern, J., García-Berro, E., & Ribas, I. 2008, MNRAS, 387, 1693
- Cook & Warner (1984) Cook, M. C. & Warner, B. 1984, MNRAS, 207, 705
- Copperwheat et al. (2010) Copperwheat, C. M., Marsh, T. R., Dhillon, V. S., et al. 2010, MNRAS, 402, 1824
- Davis et al. (2010) Davis, P. J., Kolb, U., & Willems, B. 2010, MNRAS, 403, 179
- Davis et al. (2008) Davis, P. J., Kolb, U., Willems, B., & Gänsicke, B. T. 2008, MNRAS, 389, 1563
- de Kool (1992) de Kool, M. 1992, A&A, 261, 188
- de Kool & Ritter (1993) de Kool, M. & Ritter, H. 1993, A&A, 267, 397
- Dhillon et al. (2007) Dhillon, V. S., Marsh, T. R., Stevenson, M. J., et al. 2007, MNRAS, 378, 825
- Di Stefano (2010) Di Stefano, R. 2010, ApJ, 712, 728
- Drake et al. (2009) Drake, A. J., Djorgovski, S. G., Mahabal, A., et al. 2009, ApJ, 696, 870
- Duquennoy & Mayor (1991) Duquennoy, A. & Mayor, M. 1991, A&A, 248, 485
- Echevarría et al. (2007) Echevarría, J., de la Fuente, E., & Costero, R. 2007, AJ, 134, 262
- Echevarría et al. (2008) Echevarría, J., Smith, R. C., Costero, R., Zharikov, S., & Michel, R. 2008, MNRAS, 387, 1563
- Falcon et al. (2010) Falcon, R. E., Winget, D. E., Montgomery, M. H., & Williams, K. A. 2010, ApJ, 712, 585
- Feline et al. (2004a) Feline, W. J., Dhillon, V. S., Marsh, T. R., & Brinkworth, C. S. 2004a, MNRAS, 355, 1
- Feline et al. (2004b) Feline, W. J., Dhillon, V. S., Marsh, T. R., et al. 2004b, MNRAS, 354, 1279
- Feline et al. (2004c) Feline, W. J., Dhillon, V. S., Marsh, T. R., et al. 2004c, MNRAS, 347, 1173
- Fulbright et al. (1993) Fulbright, M. S., Liebert, J., Bergeron, P., & Green, R. 1993, ApJ, 406, 240
- Gänsicke et al. (2003) Gänsicke, B. T., Szkody, P., de Martino, D., et al. 2003, ApJ, 594, 443
- Gänsicke et al. (2009) Gänsicke, B. T., Dillon, M., Southworth, J., et al. 2009, MNRAS, 397, 2170
- Gänsicke et al. (2006) Gänsicke, B. T., Long, K. S., Barstow, M. A., & Hubeny, I. 2006, ApJ, 639, 1039
- Gilfanov & Bogdán (2010) Gilfanov, M. & Bogdán, Á. 2010, Nature, 463, 924
- Green et al. (1978) Green, R. F., Richstone, D. O., & Schmidt, M. 1978, ApJ, 224, 892
- Guinan & Sion (1984) Guinan, E. F. & Sion, E. M. 1984, AJ, 89, 1252
- Hachisu et al. (2010) Hachisu, I., Kato, M., & Nomoto, K. 2010, ApJ, 724, L212
- Hillwig et al. (2000) Hillwig, T. C., Honeycutt, R. K., & Robertson, J. W. 2000, AJ, 120, 1113
- Hjellming & Webbink (1987) Hjellming, M. S. & Webbink, R. F. 1987, ApJ, 318, 794
- Horne et al. (1993) Horne, K., Welsh, W. F., & Wade, R. A. 1993, ApJ, 410, 357
- Horne et al. (1991) Horne, K., Wood, J. H., & Stiening, R. F. 1991, ApJ, 378, 271
- Howell et al. (2001) Howell, S. B., Nelson, L. A., & Rappaport, S. 2001, ApJ, 550, 897
- Hurley et al. (2000) Hurley, J. R., Pols, O. R., & Tout, C. A. 2000, MNRAS, 315, 543
- Hurley et al. (2002) Hurley, J. R., Tout, C. A., & Pols, O. R. 2002, MNRAS, 329, 897
- Iben & Tutukov (1984) Iben, Jr., I. & Tutukov, A. V. 1984, ApJS, 54, 335
- Kahabka & van den Heuvel (1997) Kahabka, P. & van den Heuvel, E. P. J. 1997, ARA&A, 35, 69
- Kawka et al. (2000) Kawka, A., Vennes, S. ., Dupuis, J., & Koch, R. 2000, AJ, 120, 3250
- Kawka et al. (2008) Kawka, A., Vennes, S., Dupuis, J., Chayer, P., & Lanz, T. 2008, ApJ, 675, 1518
- Kepler et al. (2007) Kepler, S. O., Kleinman, S. J., Nitta, A., et al. 2007, MNRAS, 375, 1315
- Kepler & Nelan (1993) Kepler, S. O. & Nelan, E. P. 1993, AJ, 105, 608
- King et al. (1994) King, A. R., Kolb, U., De Kool, M., & Ritter, H. 1994, MNRAS, 269, 907
- Koester et al. (1979) Koester, D., Schulz, H., & Weidemann, V. 1979, A&A, 76, 262
- Kolb (1993) Kolb, U. 1993, A&A, 271, 149
- Landsman et al. (1993) Landsman, W., Simon, T., & Bergeron, P. 1993, PASP, 105, 841
- Lanning & Pesch (1981) Lanning, H. H. & Pesch, P. 1981, ApJ, 244, 280
- Littlefair et al. (2006a) Littlefair, S. P., Dhillon, V. S., Marsh, T. R., & Gänsicke, B. T. 2006a, MNRAS, 371, 1435
- Littlefair et al. (2007) Littlefair, S. P., Dhillon, V. S., Marsh, T. R., et al. 2007, MNRAS, 381, 827
- Littlefair et al. (2008) Littlefair, S. P., Dhillon, V. S., Marsh, T. R., et al. 2008, MNRAS, 388, 1582
- Littlefair et al. (2006b) Littlefair, S. P., Dhillon, V. S., Marsh, T. R., et al. 2006b, Science, 314, 1578
- Livio & Truran (1992) Livio, M. & Truran, J. W. 1992, ApJ, 389, 695
- Livio & Truran (1994) Livio, M. & Truran, J. W. 1994, ApJ, 425, 797
- Long et al. (2006) Long, K. S., Brammer, G., & Froning, C. S. 2006, ApJ, 648, 541
- Long & Gilliland (1999) Long, K. S. & Gilliland, R. L. 1999, ApJ, 511, 916
- Long et al. (2004) Long, K. S., Sion, E. M., Gänsicke, B. T., & Szkody, P. 2004, ApJ, 602, 948
- Lucy (2006) Lucy, L. B. 2006, A&A, 457, 629
- Mannucci et al. (2006) Mannucci, F., Della Valle, M., & Panagia, N. 2006, MNRAS, 370, 773
- Maoz (2010) Maoz, D. 2010, in AIP Conference Proceedings, Vol. 1314, Binary star evolution: Mass loss, accretion, and mergers, ed. V. Kalogera & M. van der Sluys, 223
- Marsh & Duck (1996) Marsh, T. R. & Duck, S. R. 1996, MNRAS, 278, 565
- Maxted et al. (2004) Maxted, P. F. L., Marsh, T. R., Morales-Rueda, L., et al. 2004, MNRAS, 355, 1143
- Maxted et al. (1998) Maxted, P. F. L., Marsh, T. R., Moran, C., Dhillon, V. S., & Hilditch, R. W. 1998, MNRAS, 300, 1225
- Maxted et al. (2007) Maxted, P. F. L., O’Donoghue, D., Morales-Rueda, L., Napiwotzki, R., & Smalley, B. 2007, MNRAS, 376, 919
- Mazeh et al. (1998) Mazeh, T., Goldberg, D., & Latham, D. W. 1998, in ASP Conf. Ser. 134, Brown Dwarfs and Extrasolar Planets, ed. R. Rebolo, E. L. Martin, & M. R. Zapatero Osorio (San Francisco: ASP), 188
- Nauenberg (1972) Nauenberg, M. 1972, A&A, 175, 417
- Naylor et al. (2005) Naylor, T., Allan, A., & Long, K. S. 2005, MNRAS, 361, 1091
- Nebot Gómez-Morán et al. (2009) Nebot Gómez-Morán, A., Schwope, A. D., Schreiber, M. R., et al. 2009, A&A, 495, 561
- Orosz et al. (1999) Orosz, J. A., Wade, R. A., Harlow, J. J. B., et al. 1999, AJ, 117, 1598
- Paczyński (1976) Paczyński, B. 1976, in IAU Symp. 73, Structure and Evolution of Close Binary Systems, ed. P. Eggleton, S. Mitton & J. Whelan (Dordrecht: Kluwer), 75
- Panagia et al. (2006) Panagia, N., Van Dyk, S. D., Weiler, K. W., et al. 2006, ApJ, 646, 369
- Parsons et al. (2010) Parsons, S. G., Marsh, T. R., Copperwheat, C. M., et al. 2010, MNRAS, 402, 2591
- Pasquini et al. (2004) Pasquini, L., Bonifacio, P., Randich, S., Galli, D., & Gratton, R. G. 2004, A&A, 426, 651
- Patterson et al. (2008) Patterson, J., Thorstensen, J. R., & Knigge, C. 2008, PASP, 120, 510
- Politano (1996) Politano, M. 1996, ApJ, 465, 338
- Politano & Weiler (2006) Politano, M. & Weiler, K. P. 2006, ApJ, 641, L137
- Pols et al. (1998) Pols, O. R., Schroder, K.-P., Hurley, J. R., Tout, C. A., & Eggleton, P. P. 1998, MNRAS, 298, 525
- Prialnik (1986) Prialnik, D. 1986, ApJ, 310, 222
- Prialnik & Kovetz (1995) Prialnik, D. & Kovetz, A. 1995, ApJ, 445, 789
- Pyrzas et al. (2009) Pyrzas, S., Gänsicke, B. T., Marsh, T. R., et al. 2009, MNRAS, 394, 978
- Rappaport et al. (1994) Rappaport, S., Di Stefano, R., & Smith, J. D. 1994, ApJ, 426, 692
- Rebassa-Mansergas et al. (2007) Rebassa-Mansergas, A., Gänsicke, B. T., Rodríguez-Gil, P., Schreiber, M. R., & Koester, D. 2007, MNRAS, 382, 1377
- Rebassa-Mansergas et al. (2010) Rebassa-Mansergas, A., Gänsicke, B. T., Schreiber, M. R., Koester, D., & Rodríguez-Gil, P. 2010, MNRAS, 402, 620
- Rebassa-Mansergas et al. (2008) Rebassa-Mansergas, A., Gänsicke, B. T., Schreiber, M. R., et al. 2008, MNRAS, 390, 1635
- Rebassa-Mansergas et al. (2011) Rebassa-Mansergas, A., Nebot Gómez-Morán, A., Schreiber, M. R., Girven, J., & Gänsicke, B. T. 2011, MNRAS, 413, 1121
- Richards et al. (2002) Richards, G. T., Fan, X., Newberg, H. J., et al. 2002, AJ, 123, 2945
- Richards et al. (2004) Richards, G. T., Nichol, R. C., Gray, A. G., et al. 2004, ApJS, 155, 257
- Ritter (1976) Ritter, H. 1976, MNRAS, 175, 279
- Ritter (1987) Ritter, H. 1987, Mem. Soc. Astron. Italiana, 58, 133
- Ritter & Burkert (1986) Ritter, H. & Burkert, A. 1986, A&A, 158, 161
- Ritter & Kolb (2003) Ritter, H. & Kolb, U. 2003, A&A, 404, 301
- Robinson (1976) Robinson, E. L. 1976, ApJ, 203, 485
- Saffer et al. (1993) Saffer, R. A., Wade, R. A., Liebert, J., et al. 1993, AJ, 105, 1945
- Savoury et al. (2011) Savoury, C. D. J., Littlefair, S. P., Dhillon, V. S., et al. 2011, MNRAS, 415, 2025
- Scannapieco & Bildsten (2005) Scannapieco, E. & Bildsten, L. 2005, ApJ, 629, L85
- Schenker & King (2002) Schenker, K. & King, A. R. 2002, in ASP Conf. Ser. 261: The Physics of Cataclysmic Variables and Related Objects, ed. Gänsicke, B. T. and Beuermann, K. and Reinsch, K. (San Francisco: ASP), 242
- Schenker et al. (2002) Schenker, K., King, A. R., Kolb, U., Wynn, G. A., & Zhang, Z. 2002, MNRAS, 337, 1105
- Schmidt et al. (1995) Schmidt, G. D., Smith, P. S., Harvey, D. A., & Grauer, A. D. 1995, AJ, 110, 398
- Schreiber & Gänsicke (2003) Schreiber, M. R. & Gänsicke, B. T. 2003, A&A, 406, 305
- Schreiber et al. (2010) Schreiber, M. R., Gänsicke, B. T., Rebassa-Mansergas, A., et al. 2010, A&A, 513, L7
- Schreiber et al. (2008) Schreiber, M. R., Gänsicke, B. T., Southworth, J., Schwope, A. D., & Koester, D. 2008, A&A, 484, 441
- Schwope et al. (2009) Schwope, A. D., Nebot Gomez-Moran, A., Schreiber, M. R., & Gänsicke, B. T. 2009, A&A, 500, 867
- Shafter (1983) Shafter, A. W. 1983, ApJ, 267, 222
- Shafter & Szkody (1984) Shafter, A. W. & Szkody, P. 1984, ApJ, 276, 305
- Shen et al. (2009) Shen, K. J., Idan, I., & Bildsten, L. 2009, ApJ, 705, 693
- Silvestri et al. (2007) Silvestri, N. M., Lemagie, M. P., Hawley, S. L., et al. 2007, AJ, 134, 741
- Simon & Obbie (2009) Simon, M. & Obbie, R. C. 2009, AJ, 137, 3442
- Sion et al. (1997) Sion, E. M., Cheng, F. H., Sparks, W. M., et al. 1997, ApJ, 480, L17
- Sion et al. (1998) Sion, E. M., Cheng, F. H., Szkody, P., et al. 1998, ApJ, 496, 449
- Smak (1979) Smak, J. 1979, Acta Astron., 29, 309
- Smith et al. (2006) Smith, A. J., Haswell, C. A., & Hynes, R. I. 2006, MNRAS, 369, 1537
- Söderhjelm (2007) Söderhjelm, S. 2007, A&A, 463, 683
- Southworth et al. (2009) Southworth, J., Hickman, R. D. G., Marsh, T. R., et al. 2009, A&A, 507, 929
- Starrfield et al. (2009) Starrfield, S., Iliadis, C., Hix, W. R., Timmes, F. X., & Sparks, W. M. 2009, ApJ, 692, 1532
- Stauffer (1987) Stauffer, J. R. 1987, AJ, 94, 996
- Steeghs et al. (2007) Steeghs, D., Howell, S. B., Knigge, C., et al. 2007, ApJ, 667, 442
- Steeghs et al. (2003) Steeghs, D., Perryman, M. A. C., Reynolds, A., et al. 2003, MNRAS, 339, 810
- Sullivan et al. (2006) Sullivan, M., Le Borgne, D., Pritchet, C. J., et al. 2006, ApJ, 648, 868
- Szkody et al. (2009) Szkody, P., Anderson, S. F., Hayden, M., et al. 2009, AJ, 137, 4011
- Taam & Sandquist (2000) Taam, R. E. & Sandquist, E. L. 2000, 38, 113
- Tappert et al. (2007) Tappert, C., Gänsicke, B. T., Schmidtobreick, L., et al. 2007, A&A, 474, 205
- Tappert et al. (2009) Tappert, C., Gänsicke, B. T., Zorotovic, M., et al. 2009, A&A, 504, 491
- Thoroughgood et al. (2005) Thoroughgood, T. D., Dhillon, V. S., Steeghs, D., et al. 2005, MNRAS, 357, 881
- Thoroughgood et al. (2004) Thoroughgood, T. D., Dhillon, V. S., Watson, C. A., et al. 2004, MNRAS, 353, 1135
- Thorstensen (2000) Thorstensen, J. R. 2000, PASP, 112, 1269
- Townsley & Bildsten (2002) Townsley, D. M. & Bildsten, L. 2002, ApJ, 565, L35
- Townsley & Bildsten (2003) Townsley, D. M. & Bildsten, L. 2003, ApJ, 596, L227
- Townsley & Bildsten (2004) Townsley, D. M. & Bildsten, L. 2004, ApJ, 600, 390
- Townsley & Gänsicke (2009) Townsley, D. M. & Gänsicke, B. T. 2009, ApJ, 693, 1007
- Tremblay & Bergeron (2009) Tremblay, P. & Bergeron, P. 2009, ApJ, 696, 1755
- Trimble (1990) Trimble, V. 1990, MNRAS, 242, 79
- Truran & Livio (1986) Truran, J. W. & Livio, M. 1986, ApJ, 308, 721
- Tulloch et al. (2009) Tulloch, S. M., Rodríguez-Gil, P., & Dhillon, V. S. 2009, MNRAS, 397, L82
- van den Besselaar et al. (2007) van den Besselaar, E. J. M., Greimel, R., Morales-Rueda, L., et al. 2007, A&A, 466, 1031
- van den Heuvel et al. (1992) van den Heuvel, E. P. J., Bhattacharya, D., Nomoto, K., & Rappaport, S. A. 1992, A&A, 262, 97
- Vennes et al. (1999) Vennes, S., Thorstensen, J. R., & Polomski, E. F. 1999, ApJ, 523, 386
- Wade & Horne (1988) Wade, R. A. & Horne, K. 1988, ApJ, 324, 411
- Warner (1973) Warner, B. 1973, MNRAS, 162, 189
- Warner (1976) Warner, B. 1976, in IAU Symp. 73, Structure and Evolution of Close Binary Systems, ed. P. Eggleton, S. Mitton, & J. Whelan (Dordrecht: Kluwer), 85
- Warner (1995) Warner, B. 1995, Cataclysmic Variable Stars (Cambridge: Cambridge University Press)
- Webbink (1984) Webbink, R. F. 1984, ApJ, 277, 355
- Weidemann (2000) Weidemann, V. 2000, A&A, 363, 647
- Welsh et al. (2007) Welsh, W. F., Froning, C. S., Marsh, T. R., et al. 2007, in ASP Conf. Ser. 362: The Seventh Pacific Rim Conference on Stellar Astrophysics, ed. Y. W. Kang, H.-W. Lee, K.-C. Leung, & K.-S. Cheng (San Francisco: ASP), 241
- Williams et al. (2009) Williams, K. A., Bolte, M., & Koester, D. 2009, ApJ, 693, 355
- Wood et al. (1986) Wood, J., Horne, K., Berriman, G., et al. 1986, MNRAS, 219, 629
- Wood et al. (1989) Wood, J. H., Horne, K., Berriman, G., & Wade, R. A. 1989, ApJ, 341, 974
- Wood (1995) Wood, M. A. 1995, in Lecture Notes in Physics Vol. 443, White Dwarfs, ed. D. Koester & K. Werner (Berlin: Springer), 41
- Yaron et al. (2005) Yaron, O., Prialnik, D., Shara, M. M., & Kovetz, A. 2005, ApJ, 623, 398
- Zhang & Robinson (1987) Zhang, E. & Robinson, E. L. 1987, ApJ, 321, 813
- Zorotovic et al. (2010) Zorotovic, M., Schreiber, M. R., Gänsicke, B. T., & Nebot Gómez-Morán, A. 2010, A&A, 520, A86
| System | Method | References | ||||
|---|---|---|---|---|---|---|
| [min] | [] | [] | [] | & Notes | ||
| SDSS | 66.6 | 0.892 | 0.008 | 0.058 | e | 1,2,3 |
| SDSS | 78.1 | 0.865 | 0.005 | 0.057 | e | 1,4,5 |
| WZ Sge | 81.6 | 0.85 | 0.04 | 0.078 | d,g,sp | 6,7 |
| SDSS | 81.9 | 0.767 | 0.027 | 0.077 | e | 1,4 |
| SDSS | 82.1 | 0.835 | 0.009 | 0.048 | e | 1,8 |
| SDSS | 84.8 | 0.709 | 0.004 | 0.078 | e | 1,4 |
| SDSS | 85.1 | 0.872 | 0.011 | 0.099 | e | 1,4 |
| XZ Eri | 88.1 | 0.769 | 0.017 | 0.091 | e | 1,9 |
| SDSS | 90.7 | 0.796 | 0.018 | 0.089 | e | 1 |
| OY Car | 90.9 | 0.84 | 0.04 | 0.086 | e | 4,10 |
| CTCV | 94.4 | 0.935 | 0.031 | 0.103 | e | 1 |
| SDSS | 97.5 | 0.560 | 0.028 | 0.087 | e | 1 |
| OU Vir | 104.7 | 0.703 | 0.012 | 0.115 | e | 1,11,12 |
| HT Cas | 106.1 | 0.61 | 0.04 | 0.09 | e | 13 |
| IY UMa | 106.4 | 0.79 | 0.04 | 0.10 | e | 14 |
| VW Hyi | 107.0 | 0.71 | 0.22 | 0.11 | g | 15,16 |
| Z Cha | 107.3 | 0.84 | 0.09 | 0.125 | e,d | 17,18 |
| DV UMa | 123.6 | 1.098 | 0.024 | 0.195 | e | 1,9 |
| CTCV | 128.1 | 0.736 | 0.014 | 0.177 | e | 1 |
| SDSS | 144.1 | 0.91 | 0.03 | 0.226 | e | 1,19 |
| AM Her | 185.7 | 0.78 | 0.15 | - | sp | 20 |
| DW UMa | 196.7 | 0.87 | 0.19 | 0.16 | e | 21 |
| IP Peg | 227.8 | 1.16 | 0.02 | 0.55 | e | 22 |
| GY Cnc | 252.6 | 0.99 | 0.12 | 0.38 | e | 23 |
| U Gem | 254.7 | 1.20 | 0.09 | 0.42 | d,g,sp | 24,25,26,27,28,29 |
| SDSS | 267.7 | 0.78 | 0.12 | 0.466 | e | 30 |
| DQ-Her | 278.8 | 0.60 | 0.07 | 0.40 | d | 31 |
| V347 Pup | 334.0 | 0.63 | 0.04 | 0.52 | d | 32 |
| EM Cyg | 418.9 | 1.00 | 0.06 | 0.77 | d | 33 |
| AC Cnc | 432.7 | 0.76 | 0.03 | 0.77 | d | 34 |
| V363 Aur | 462.6 | 0.90 | 0.06 | 1.06 | d | 34 |
| AE Aqr | 592.8 | 0.63 | 0.05 | 0.37 | d | 35 |
References (1) Savoury et al. (2011),(2) Littlefair et al. (2007),(3) Patterson et al. (2008),(4) Littlefair et al. (2008),(5) Tulloch et al. (2009),(6) Steeghs et al. (2007),(7) Long et al. (2004),(8) Littlefair et al. (2006b),(9) Feline et al. (2004a),(10) Wood et al. (1989),(11) Feline et al. (2004c),(12) Feline et al. (2004b),(13) Horne et al. (1991),(14) Steeghs et al. (2003),(15) Smith et al. (2006),(16) Sion et al. (1997),(17) Wade & Horne (1988),(18) Wood et al. (1986),(19) Littlefair et al. (2006a),(20) Gänsicke et al. (2006),(21) Araujo-Betancor et al. (2003),(22) Copperwheat et al. (2010),(23) Thorstensen (2000),(24) Echevarría et al. (2007),(25) Zhang & Robinson (1987),(26) Sion et al. (1998),(27) Long & Gilliland (1999),(28) Naylor et al. (2005),(29) Long et al. (2006),(30) Southworth et al. (2009),(31) Horne et al. (1993),(32) Thoroughgood et al. (2005),(33) Welsh et al. (2007),(34) Thoroughgood et al. (2004),(35) Echevarría et al. (2008)
| Object | Type | Ref. | ||||
|---|---|---|---|---|---|---|
| [] | [] | [d] | [K] | |||
| WD | He | 1 | ||||
| GD | He | 2, 3 | ||||
| NN Ser | C/O | 4 | ||||
| LTT | C/O | 5 | ||||
| MS Peg | ? | 6 | ||||
| LM Com | He | 7 | ||||
| CC Cet | He | 8 | ||||
| CSS | He | 9, 1 | ||||
| RR Cae | He | 11 | ||||
| BPM | ? | 12, 13, 14 | ||||
| GK Vir | ? | 15, 16 | ||||
| EC | C/O | 17 | ||||
| EC | C/O | 17 | ||||
| EC | He | 17 | ||||
| DE CVn | C/O | 18 | ||||
| RXJ | C/O | 19 | ||||
| HZ 9 | ? | 20, 21, 22, 23 | ||||
| UX CVn | He | 24 | ||||
| UZ Sex | C/O | 8, 25 | ||||
| EG UMa | C/O | 26 | ||||
| RE J | C/O | 27, 28 | ||||
| RE J | C/O | 27, 28 | ||||
| IN CMa | C/O | 27, 29 | ||||
| Feige 24 | C/O | 30 | ||||
| IK Peg | C/O | 29, 31 | ||||
| SDSS | C/O | 32 | ||||
| SDSS | He | 10 | ||||
| SDSS | ? | 33 | ||||
| SDSS | C/O | 32 | ||||
| SDSS | C/O | 10 | ||||
| SDSS | C/O | 33 | ||||
| SDSS | C/O | 33 | ||||
| SDSS | ? | 33 | ||||
| SDSS | He | 34 | ||||
| SDSS | C/O | 33 | ||||
| SDSS | He | 35 | ||||
| SDSS | C/O | 33 | ||||
| SDSS | C/O | 33 | ||||
| SDSS | C/O | 34 | ||||
| SDSS | C/O | 33 | ||||
| SDSS | ? | 33 | ||||
| SDSS | He | 10 | ||||
| SDSS | He | 33 | ||||
| SDSS | C/O | 33 | ||||
| SDSS | C/O | 33 | ||||
| SDSS | He | 32 | ||||
| SDSS | C/O | 10 | ||||
| SDSS | C/O | 33 | ||||
| SDSS | C/O | 33 | ||||
| SDSS | C/O | 33 | ||||
| SDSS | C/O | 33 | ||||
| SDSS | He | 32 | ||||
| SDSS | He | 33 | ||||
| SDSS | C/O | 33 | ||||
| SDSS | C/O | 33 | ||||
| SDSS | C/O | 33 | ||||
| SDSS | He | 33 | ||||
| SDSS | He | 33 | ||||
| SDSS | He | 33 | ||||
| SDSS | He | 33 | ||||
| SDSS | ? | 33 | ||||
| SDSS | C/O | 32 |
References. (1) Burleigh et al. (2006), (2) Marsh & Duck (1996), (3) Maxted et al. (1998), (4) Parsons et al. (2010), (5) Tappert et al. (2007), (6) Schmidt et al. (1995), (7) Orosz et al. (1999), (8) Saffer et al. (1993), (9) Drake et al. (2009), (10) Pyrzas et al. (2009), (11) Maxted et al. (2007), (12) Kawka et al. (2000), (13) Bragaglia et al. (1995), (14) Koester et al. (1979), (15) Fulbright et al. (1993), (16) Green et al. (1978), (17) Tappert et al. (2009), (18) van den Besselaar et al. (2007), (19) Maxted et al. (2004), (20) Stauffer (1987), (21) Lanning & Pesch (1981), (22) Guinan & Sion (1984), (23) Schreiber & Gänsicke (2003), (24) Hillwig et al. (2000), (25) Kepler & Nelan (1993) (26) Bleach et al. (2000), (27) Vennes et al. (1999), (28) Bergeron et al. (1994), (29) Davis et al. (2010), (30)Kawka et al. (2008), (31) Landsman et al. (1993), (32) Rebassa-Mansergas et al. (2008), (33) Nebot Gómez-Morán et al. (2011, submitted), (34) Schreiber et al. (2008), (35) Nebot Gómez-Morán et al. (2009).
| Object | q | Notes | ||||||||||
|---|---|---|---|---|---|---|---|---|---|---|---|---|
| [] | [d] | [] | [] | [] | [h] | [yr] | [yr] | [yr] | [yr] | |||
| WD | c | |||||||||||
| GD 448 | 0.41 | 0.23 | 0.105 | 1.190 | 1.120 | 152.23 | 1.282 | 6.57E+09 | 1.18E+08 | 1.84E+09 | 8.53E+09 | a |
| NN Ser | 0.54 | 0.21 | 0.130 | 2.010 | 1.964 | 287.58 | 1.825 | 1.47E+09 | 1.18E+06 | 2.26E+09 | 3.73E+09 | a |
| LTT 560 | 0.52 | 0.36 | 0.168 | 1.690 | 1.615 | 251.56 | 2.204 | 2.15E+09 | 1.04E+09 | 1.88E+09 | 5.07E+09 | a |
| MS Peg | 0.46 | 0.48 | 0.174 | 1.750 | 1.725 | 225.23 | 2.651 | 1.80E+09 | 7.82E+07 | 2.67E+09 | 4.55E+09 | a |
| LM Com | 0.45 | 0.62 | 0.259 | 1.670 | 1.641 | 224.19 | 2.660 | 2.09E+09 | 3.24E+07 | 8.23E+09 | 1.04E+10 | a |
| CC Cet | c | |||||||||||
| CSS 080502 | b | |||||||||||
| RR Cae | c | |||||||||||
| BPM 6502 | c | |||||||||||
| GK Vir | c | |||||||||||
| EC 12477-1738 | 0.61 | 0.62 | 0.386 | 2.590 | 2.525 | 372.82 | 3.467 | 7.24E+08 | 1.13E+08 | 4.42E+08 | 1.28E+09 | a |
| EC 14329-1625 | 0.62 | 0.61 | 0.397 | 2.650 | 2.583 | 383.44 | 3.471 | 6.78E+08 | 2.20E+08 | 3.98E+08 | 1.34E+09 | a |
| EC | b | |||||||||||
| DE CVn | b | |||||||||||
| RXJ | b | |||||||||||
| HZ 9 | c | |||||||||||
| UX CVn | b | |||||||||||
| UZ Sex | c | |||||||||||
| EG UMa | 0.64 | 0.66 | 0.683 | 2.730 | 2.641 | 439.15 | 3.659 | 6.23E+08 | 3.13E+08 | 3.94E+09 | 4.88E+09 | a |
| RE J | c | |||||||||||
| RE J | c | |||||||||||
| IN CMa | b,c | |||||||||||
| Feige 24 | b,c | |||||||||||
| IK Peg | * | |||||||||||
| SDSS | d | |||||||||||
| SDSS | b | |||||||||||
| SDSS | b | |||||||||||
| SDSS0246+0041 | 0.80 | 0.47 | 0.735 | 3.590 | 3.519 | 573.02 | 3.514 | 2.88E+08 | 2.03E+08 | 5.85E+09 | 6.34E+09 | a |
| SDSS0303+0054 | 0.92 | 0.27 | 0.207 | 4.600 | 4.505 | 614.05 | 2.840 | 1.49E+08 | 2.25E+09 | 2.88E+08 | 2.68E+09 | a |
| SDSS0833+0702 | 0.54 | 0.59 | 0.351 | 2.010 | 1.968 | 290.08 | 2.889 | 1.47E+09 | 1.57E+08 | 2.45E+08 | 1.88E+09 | a |
| SDSS | c | |||||||||||
| SDSS0949+0322 | 0.52 | 0.62 | 0.408 | 1.600 | 1.509 | 291.89 | 2.880 | 2.53E+09 | 6.65E+07 | 5.83E+08 | 3.18E+09 | a |
| SDSS | b,c | |||||||||||
| SDSS1143+0009 | 0.60 | 0.53 | 0.409 | 2.470 | 2.393 | 379.70 | 2.905 | 8.27E+08 | 1.29E+08 | 6.07E+08 | 1.56E+09 | a |
| SDSS | c | |||||||||||
| SDSS1348+1834 | 0.59 | 0.54 | 0.319 | 2.460 | 2.400 | 352.99 | 2.902 | 8.37E+08 | 1.84E+08 | 1.27E+08 | 1.15E+09 | a |
| SDSS | b | |||||||||||
| SDSS | c | |||||||||||
| SDSS1429+5759 | 1.07 | 0.36 | 0.568 | 5.700 | 5.517 | 810.37 | 3.547 | 8.83E+07 | 4.18E+08 | 2.76E+09 | 3.27E+09 | a |
| SDSS | c | |||||||||||
| SDSS1435+3733 | 0.42 | 0.62 | 0.140 | 1.580 | 1.554 | 169.85 | 2.256 | 2.50E+09 | 4.73E+08 | 8.19E+08 | 3.79E+09 | a |
| SDSS | b,c | |||||||||||
| SDSS | c | |||||||||||
| SDSS1524+5040 | 0.73 | 0.44 | 0.596 | 3.240 | 3.142 | 531.79 | 2.928 | 3.83E+08 | 1.07E+08 | 2.94E+09 | 3.43E+09 | a |
| SDSS | b | |||||||||||
| SDSS1548+4057 | 0.62 | 0.32 | 0.192 | 2.630 | 2.556 | 359.75 | 1.736 | 6.93E+08 | 3.98E+08 | 3.64E+09 | 4.74E+09 | a |
| SDSS1558+2642 | 1.06 | 0.30 | 0.681 | 5.620 | 5.418 | 824.56 | 2.956 | 9.13E+07 | 6.09E+08 | 5.75E+09 | 6.45E+09 | a |
| SDSS | c | |||||||||||
| SDSS | c | |||||||||||
| SDSS1718+6101 | 0.53 | 0.60 | 0.678 | 1.860 | 1.802 | 359.97 | 2.886 | 1.65E+09 | 7.86E+07 | 3.56E+09 | 5.29E+09 | a |
| SDSS | b | |||||||||||
| SDSS | b | |||||||||||
| SDSS2112+1014 | 1.06 | 0.19 | 0.109 | 5.650 | 5.516 | 682.31 | 1.742 | 9.00E+07 | 2.29E+08 | 1.98E+08 | 5.17E+08 | a |
| SDSS2114-0103 | 0.70 | 0.54 | 0.413 | 3.130 | 3.063 | 463.72 | 3.493 | 4.23E+08 | 1.66E+07 | 7.62E+08 | 1.20E+09 | a |
| SDSS2120-0058 | 0.64 | 0.50 | 0.469 | 2.710 | 2.615 | 427.85 | 2.913 | 6.37E+08 | 1.65E+08 | 1.06E+09 | 1.86E+09 | a |
| SDSS | c | |||||||||||
| SDSS | b | |||||||||||
| SDSS | c | |||||||||||
| SDSS | c | |||||||||||
| SDSS | b,c | |||||||||||
| SDSS2339-0020 | 0.93 | 0.34 | 0.674 | 4.660 | 4.526 | 706.93 | 2.948 | 1.44E+08 | 5.08E+08 | 5.00E+09 | 5.66E+09 | a |
*For IK Peg the values of and
were computed based on the nuclear evolution timescale of the secondary as it is much shorter
than the time required to bring the systems into contact by angular momentum loss.
Notes:
a) The system is representative for the progenitors of the current CV population.
b) The mass ratio exceeds the critical value for stable mass transfer.
c) The system has a CV formation times longer than the age of the galaxy.
d) This system is probably not a PCEB but a detached CV in the period gap.