Large-Area Sandwich Veto Detector with WLS Fibre Readout for Hadron Spectroscopy at COMPASS
Abstract
A sandwich detector composed of scintillator and steel-covered lead layers was introduced in the fixed-target COMPASS experiment at CERN for vetoing events not completely covered by the two-stage magnetic spectrometer. Wavelength shifting fibres glued into grooves in the scintillator tiles serve for fast read-out. Minimum ionizing particles impinging on the detector outside of a central hole, sparing the spectrometer’s entry, are detected with a probability of 98%. The response to charged particles and photons is modeled in detail in Monte Carlo calculations. Figures of merit of the veto trigger in (or nucleus) experiments are an enrichment of exclusive events in the recorded data by a factor of 3.5 and a false-veto probability of 1%.
keywords:
Lead-plastic sandwich, WLS readout, veto trigger, MC simulation1 Introduction
COMPASS campaigns 2008 and 2009 were devoted mainly to light meson spectroscopy via diffractive or central production. A liquid hydrogen target or, alternatively, a staggered Pb and W target, was bombarded with positive and negative hadron beams (, , ) from the CERN M2 beamline. Forward going particles were detected in a two-stage magnetic spectrometer with tracking and calorimetry in both stages [1].
The requested event types have in common that the target proton remains intact. It is emitted at large angles compared to the beam direction with momenta on the order of a few hundred . This proton is detected by a recoil proton detector (RPD) which encloses the target with an angular range from to as seen from the centre and delivers a trigger signal on seeing a charged particle track [2]. Apart from the recoiling proton no other particle is expected in the target fragmentation region. Inelastic, non-diffractive processes and diffractive excitations of the target produce the dominant background, yielding additional particles in the target fragmentation region. Mostly these fall outside the opening angle of the COMPASS spectrometer which amounts to approx. about the beam direction as seen from the upstream target edge. In order to enrich the recorded data with kinematically complete events of the required type, a veto trigger counter was needed that spans a large part of the angular range between the acceptances of the spectrometer and that of the RPD.
The sandwich detector (SW) covered in this report is a detector with optically active wavelength shifting (WLS) fibre readout that detects photons and charged particles falling in a solid angle of outside of the spectrometer’s geometric acceptance (Fig. 1). In principle the detector is a thin electromagnetic-calorimeter-type detector complying with the following demands: high rate capability, good time resolution, compact geometry, high efficiency for minimum ionizing particles and photons with energy above , low false-veto probability.
In coincidence with the RPD trigger, a beam defining trigger and a veto from a small counter for non-interacting beam particles, placed at downstream from the target, the SW veto contributes to the hadron physics trigger. At full use of the data recording capacity of , it is found that inclusion of the SW veto enriches the recorded sample with good candidate events by a factor of about . Apart from the event type described above, the SW veto is also useful in studies of exclusive events with excited recoil protons detected by the RPD or with nuclear recoils unnoticed by the RPD.
2 Detector Setup
2.1 Scintillators with WLS fibre readout
Light signals from scintillating material can be collected, converted and transported to photomultipliers by wavelength shifting fibres. This technique has been optimized by the Moscow-Protvino groups [3, 4, 5, 6] with regard to good efficiency, fast timing and radiation hardness. It allows for compact large-area calorimeter designs.
The scintillator material used here is a polystyrene (DOW Styron 637) with additives of pTP ( weight fraction) as primary fluor and POPOP ( weight fraction) as secondary fluor. The intensity of the scintillation light assumes its maximum at , the refractive index is .
Tiles of an area and thickness of were manufactured at the the Institute of High-Energy Physics (Protvino) by means of molding techniques 444Details at http://www.ihep.ru/scint/index-e.htm. Eight grooves of width and depth run in parallel over each tile for fibre accomodation. Four of these were included in the mold, the other four milled subsequently. Two small knobs were molded and a central hole was drilled to allow for stable stacking in sandwich layers.
Optically active fibres of length are used for readout. The chosen type of multiclad fast green wavelength shifters (Bicron BCF-92, [7]) are characterised by absorption and emission maxima at and , respectively. Core and cladding refractive indices are and , respectively, and the attenuation length is .
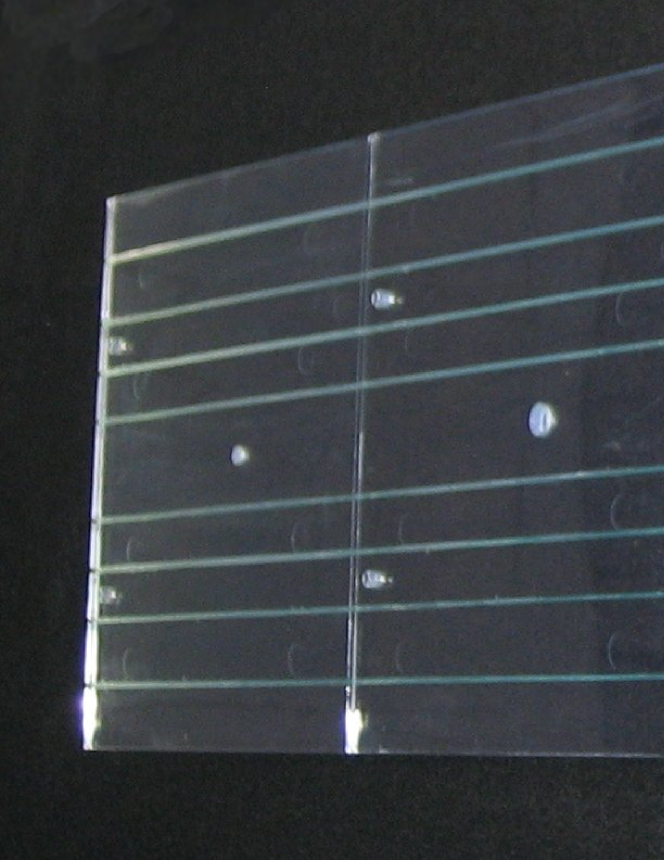
For installation in the sandwich detector, 4 scintillator tiles or 4 stacked pairs of tiles are grouped in bars of an area of and thickness or , respectively. A four-tile bar has eight pairs of fibres for common readout (Fig. 2). Double layers consist of a layer as above, the fibres running on the upper side, on which another layer is stacked carrying only one fibre per groove, altogether fibres.
The fibres are glued into the grooves with optical cement BC-600 [8] which has a refractive index . After mixing, this two-component glue is extruded into the groove with a syringe. The fibres are inserted such that they are fully covered with glue. For fibre-pair readout, a second string of glue is overlayed on the first fibre before inserting the second fibre. The far-side ends as seen from the photomultiplier are cut at an angle to suppress light reflection. This is validated by the absence of reflected photon signals. After hardening of the optical cement, scintillator bars have sufficient mechanical stability for subsequent handling.
In the final assembly the scintillator bars are wrapped with a single layer of white Tyvek paper R1025D (thickness ). This diffusive reflector is found to increase the light output by .
Bundles of fibres from a single detector block (see below) are fed through a plexiglas cylinder. After fixation with epoxy glue, ends are cut and the front side is polished. It is attached to a XP2262B phototube. Initially XP2020 phototubes were employed, which have less gain but elsewise are suited as well. Both tubes are fast and provide quantum efficiencies of about . The efficiency curves are rather flat, peaking at [9].
Cosmic ray tests were performed with trigger counters above and below scintillator tiles. Pulses from muons in a double layer, with most probable energy deposit of , produce signals of about 10 photoelectrons (Fig. 3). Rise times and decay times (20%-80%) of 3 and are found. Comparing signals from the far and near end, we find a light attenuation of 25% over the length of .
2.2 Sandwich Assembly

The SW has a total thickness of 5.1 radiation lengths. It consists of 12 blocks, each of an area of minus cutouts for the central hole arranged on the surface (Fig. 4). Each block is assembled from 5 steel-covered lead-plates and 5 scintillator layers, 3 of and 2 of thickness. As seen from the target entry, the hole is approximately conical with an opening angle of . Each block is mounted on a steel plate of thickness which is attached to an outer support frame. The complete detector has a mass of . It is held in the vertical position by a welded H-iron support frame which is stabilized by struts across the corners. These allow mounting the detector blocks in the horizontal position. The frame also carries a small multiplicity counter covering the inner hole on the spectrometer side [2].
2pt
\pinlabelPMT at 39 180
\pinlabelDetector Block at 252 237
\endlabellist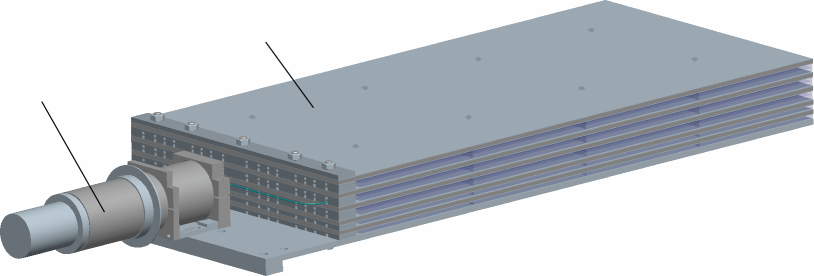
2pt
\pinlabelSteel [l] at 153 305
\pinlabelLead [l] at 292 305
\pinlabelScintillator [l] at 438 305
\pinlabel
[r] at 0 245
\pinlabel
[r] at 0 108
\pinlabelAl shims [l] at 750 214
\pinlabel at 360 -16
\endlabellist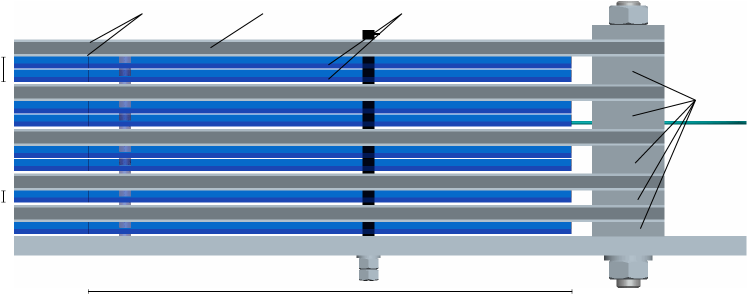
The optically inactive layers of the calorimeter consist of lead plates which have steel glued to each side to accomplish sufficient stiffness for the assembly (Figs. 5, 6). Each scintillator layer is formed by a pair of scintillator bars lying side-by-side. Their positions are fixed by two knobs per tile, mentioned above, and by 8 bolts per detector block, traversing the central holes of the scintillator tiles (Fig. 5, 6), four of which have sleeves between the lead/steel plates ensuring their proper distance. To accomplish mechanical stability without exerting pressure on the scintillators, the lead/steel plates are cramped onto the rear steel plate where the correct distance is enforced by aluminium shims. In total a block has 64 scintillator plates which are grouped in 3 double layers on the upstream side (top in Figs. 5, 6) and 2 single layers on the downstream side. For the given amount of scintillators this order gives the best efficiency for low-energy photons according to Monte Carlo simulations (see below).
The light fibres are fed through channels in the shims. For common readout, the total of 208 fibres per block are bundled in a plastic cylinder which is attached to the entrance window of a XP2262B phototube. The stray magnetic field of the spectrometer’s first stage dipole magnet necessitates magnetic shielding of the photomultipliers. This is accomplished by double cylinders made of -metal and soft iron, respectively (Fig. 5).
2.3 Monte Carlo Studies
The response of the detector to photons and charged particles was simulated with the Monte Carlo code Geant4 [10, 11].555All plots were created using the QGSP_BIC physics list. No significant dependency on the choice of physics list was observed. The energy deposit in the scintillator layers for perpendicularly impinging photons of various energies (Fig. 7) is characterized by a broad peak from showers and narrow peaks superimposed at lower energies. The first (second) narrow peaks are due to single electrons or, less frequently, positrons traversing only one of the scintillator layers of () thickness, respectively. Shown for comparison is the energy deposit of muons with and (used at COMPASS for spectrometer alignment). The most probable energy deposit of muons is almost independent of their energy in this range. This comes in spite of the energy loss at being considerably larger than in the minimum ionizing case () because of the occurence of radiative processes: the ensuing photons and pairs are mostly produced and stopped in a lead layer depositing no energy in the scintillators.
The fraction of photons with energy deposit above gives the efficiency for discriminator threshold corresponding to (Fig. 7). For threshold corresponding to one third of , the most probable energy deposit of minimum ionizing particles, the efficiency is above for energies above and drops to for photons. This threshold was chosen in COMPASS runs after a pulse height calibration with muons of high energy (next section), however, halving the threshold is feasible at the noise level observed in the experiment.
In order to suppress delayed energy deposits from secondary processes induced by very soft hadrons, the simulated energy deposits were integrated over a timespan of . This timespan is adapted to the observed signal broadening coming from light collection and conversion in the scintillators and the WLS fibres (see below). Significant differences from the complete energy deposits occur only for hadrons of low energy.
For pions with kinetic energy above , efficiencies above are obtained (Fig. 8). The edge at of the distribution of energy deposits for pions is due to their stopping in the second lead/steel layer. The integration time of is relevant for pions. For larger time spans the distribution develops a broad shoulder towards larger values (not shown). In the case of stopped negative pions, this is mostly due to secondary neutrons scattering in the scintillator material after being produced in the Pb layers. In the case of stopped positive pions, the broadening can be traced back to decay. These effects are not important for the present vetoing at sufficiently low threshold but should be kept in mind when pile-up is a concern. Pions with energy at or above yield a peak above or at (Fig. 8, right) with insignificant dependence on the integration time and insignificant / difference, since the pions traverse the detector.
The first lead/steel layer corresponds to the range of pions. Up to this energy pions are not vetoed. This layer was chosen for the entry to suppress false vetoes from delta electrons accompanying valid events in the target. Monte Carlo simulations of delta electron production by pions traversing the liquid hydrogen target give a probability for a veto signal induced by delta electrons.
3 Performance of the Veto Detector
The SW detector was integrated into the hardware trigger in the 2008 and 2009 COMPASS campaigns with pion, proton and short-time muon runs. The so-called physics trigger incorporated in addition the recoil proton and beam triggers, see sec. 1.
Photomultiplier signals from cosmic muons traversing the final detector assembly have average rise times (20%-80%) of , logarithmic decay times of , and widths at half maximum of (Fig. 3). These values are larger by a factor of almost 3 than those obtained for single photons and they are also larger than the corresponding values for a single double layer. These differences are attributed to the statistical spread of light collection times.
The total number of photoelectrons for minimum ionizing particles (MIP) impinging perpendicularly on the detector amounts to 45. Taking the quantum efficiency into account, this corresponds to 220 photons entering the photomultiplier window. More relevant for fast discrimination is the signal height. Because of the photoelectrons’ time spread the resulting signal height corresponds to a lower number of single photoelectrons. It is found that the average signal height for MIPs corresponds to 18.7 single photoelectrons. For the COMPASS veto trigger a discriminator threshold corresponding to six times the single photoelectron level was chosen. The coincidence time requirement of the COMPASS veto system was easily fulfilled.
The veto efficiency for MIPs was determined with muon beams using a halo trigger. A veto flag probability of 98% was obtained for muons with a reconstructed track traversing the SW detector. This value refers to homogeneous irradiation of the complete detector plane excluding the central hole. Tracks at the block edges contribute more than half of the missing 2%.
Hadron beam test runs with the SW excluded from the hardware trigger but recorded as flag demonstrate its proper operation. For events carrying the flag, the total momentum distribution of particles detected in the spectrometer is shifted towards lower momenta with respect to the incoming momentum of (Fig. 9 left) due to the momentum carried away into the sandwich veto detector. This is attributed to target fragmentation. Such kind of events are strongly suppressed in the distribution without veto flag where a peak characteristic of exclusive kinematics stands out (Fig. 9 right). This group of events is attributed to the processes of interest here, namely peripheral production of mesons. For this example, events with three reconstructed tracks in the spectrometer were selected, defining a total momentum vector. This vector and the momentum vector of the incoming pion define an (oriented) plane which can be compared with the (oriented) plane defined by and the momentum vector of the target-like recoil detected with the recoil detector. The “coplanarity angle” between these planes shows a peak at zero, characteristic of exclusive kinematics, for events with no SW veto signal, whereas events with a SW veto signal have a broad distribution (Fig. 10). A peak in the latter distribution would indicate false vetoes. For these plots a total reconstructed momentum was required, which largely suppresses events where momentum was carried away by neutrals not taken into account here.
Important figures of merit are the enrichment factor of useful data in the recorded events and the probability of false vetos. The former is defined as the factor by which the physics trigger rate increases if the sandwich is not included in the veto. At given data recording capability of about in the present case, the rate of physics data recording is increased by this factor due to the SW veto. Enrichment factors of 3.3 to 3.8 were obtained in the hadron runs. Typical beam rates were particles per spill with spill length and repetitions rate of 16.8 and , respectively, and SW rate of about . The probability for wrong vetoes was extracted from SW coincidences with noninteracting beam particles and also from the distributions as in Fig. 10. A probability of 1% was found for faulty SW vetoes, which agrees with estimates from the simulation of delta electron production.
4 Summary
A compact sandwich detector of 5.1 radiation lengths total thickness was installed around the COMPASS spectrometer’s entry for vetoing on incomplete detector events. Read-out by WLS fibres running in grooves over the scintillators allowed for MHz rates and fast triggering. A total energy deposit in the scintillators of , obtained for minimum ionizing particles (MIP), results in 220 photons entering the photomultipliers (PM). Statistical spread of light collection times leads to a signal rise time of and logarithmic decay time of , corresponding to 3 times the single photo electron values. The resulting MIP signal height corresponds to 18.7 photo electrons. The PM output was fed directly into the veto discriminator.
The veto efficiency for MIP’s was found to amount to for a discriminator threshold corresponding to one third of the MIP signal height. Monte Carlo simulations yield efficiencies for this threshold which are above for pions with kinetic energy above 50 MeV and above () for () photons. The detector performed well for about 12 months of running time in 2 years, mostly with pion beams of impinging on a liquid hydrogen target. Rejecting events not completely covered by the spectrometer, it increased the fraction of useful data with complete kinematics by a factor of 3.5 as compared to data recording with inactive sandwich veto. Since this factor was obtained at full use of the data recording capacity of , it translates directly into a gain in statistics for the diffractive and central production processes under study.
Acknowledgements
We are grateful for the skillful design engineering by P. Hartung (MLL Garching), for valuable advice from V.A. Polyakov, and for assistance by H. Yang. We also acknowledge financial support by BMBF and by the DFG cluster of excellence “Origin and Structure of the Universe”.
References
- [1] P. Abbon, et al., The COMPASS Experiment at CERN, Nucl. Instrum. Meth. A577 (2007) 455–518. arXiv:hep-ex/0703049, doi:10.1016/j.nima.2007.03.026.
- [2] M. Alekseev, et al., The COMPASS 2008 Spectrometer, to be submitted to Nucl. Inst. Meth. A (2011).
- [3] A. Karyukhin, et al., Radiation hardness study on molded scintillation tiles and wavelength shifting fibers, Nucl. Instrum. Meth. B117 (4) (1996) 415 – 420. doi:DOI:10.1016/0168-583X(96)00301-1.
- [4] A. P. Ivashkin, et al., Scintillation ring hodoscope with WLS fiber readout, Nucl. Instrum. Meth. A394 (3) (1997) 321 – 331. doi:DOI:10.1016/S0168-9002(97)00657-8.
- [5] O. Mineev, et al., Photon sandwich detectors with WLS fiber readout, Nucl. Instrum. Meth. A494 (1-3) (2002) 362 – 368. doi:DOI:10.1016/S0168-9002(02)01493-6.
- [6] N. Yershov, et al., Long sandwich modules for photon veto detectors, Nucl. Instrum. Meth. A543 (2-3) (2005) 454 – 462. doi:DOI:10.1016/j.nima.2004.11.051.
- [7] Saint-Gobain Inc., Data Sheet 03-05 (2005).
- [8] Saint-Gobain Inc., Data Sheet 06-02 (2002).
- [9] Photonis, Photomultiplier Tubes Catalogue (2007).
- [10] S. Agostinelli, et al., Geant 4 – a simulation toolkit, Nucl. Instrum. Meth. A506 (2003) 250–303. doi:10.1016/S0168-9002(03)01368-8.
- [11] J. Allison, et al., Geant4 developments and applications, IEEE Trans. Nucl. Sci. 53 (2006) 270. doi:10.1109/TNS.2006.869826.