Herschel-ATLAS Galaxy Counts and High Redshift Luminosity Functions:
The Formation of
Massive Early Type Galaxies⋆⋆\star⋆⋆\starHerschel is an ESA space observatory
with science instruments provided by European-led Principal Investigator
consortia and with important participation from NASA.
Abstract
Exploiting the H-ATLAS Science Demonstration Phase (SDP) survey data, we have determined the luminosity functions (LFs) at rest-frame wavelengths of and m and at several redshifts , for bright sub-mm galaxies with star formation rates (SFR) . We find that the evolution of the comoving LF is strong up to , and slows down at higher redshifts. From the LFs and the information on halo masses inferred from clustering analysis, we derived an average relation between SFR and halo mass (and its scatter). We also infer that the timescale of the main episode of dust-enshrouded star formation in massive halos () amounts to yr. Given the SFRs, which are in the range , this timescale implies final stellar masses of order of . The corresponding stellar mass function matches the observed mass function of passively evolving galaxies at . The comparison of the statistics for sub-mm and UV selected galaxies suggests that the dust-free, UV bright phase, is times shorter than the sub-mm bright phase, implying that the dust must form soon after the onset of star formation. Using a single reference Spectral Energy Distribution (SED; the one of the galaxy SMM J2135-0102), our simple physical model is able to reproduce not only the LFs at different redshifts but also the counts at wavelengths ranging from m to mm. Owing to the steepness of the counts and their relatively broad frequency range, this result suggests that the dispersion of sub-mm SEDs of galaxies around the reference one is rather small.
Subject headings:
galaxies: formation - galaxies: evolution - galaxies: elliptical - galaxies: high redshift - submillimeter1. Introduction
The star formation history in galaxies is one of the key issues we have to understand in order to reconstruct how the Universe evolved from small matter perturbations at the recombination epoch to the present richness of structures.
Star formation proceeds at a different pace for different galaxies, depending on the physical conditions of the available gas. Early Type Galaxies (ETGs) and massive bulges of S galaxies are composed of relatively old stellar populations with mass-weighted ages of Gyr (corresponding to formation redshifts ), while the disc components of spiral and irregular galaxies are characterized by significantly younger stellar populations. For instance, the luminosity-weighted age for most of S or later-type spirals is Gyr (cf. Bernardi et al. 2010, their Fig. 10), corresponding to a formation redshift . In general, the old stellar populations feature low specific angular momentum as opposed to the larger specific angular momentum of the younger ones.
How can these facts be interpreted in the framework of the hierarchical evolution of the dark matter (DM) galaxy halos that have proven to be remarkably successful in accounting for the power-spectrum (or the spatial correlation function) of the large-scale matter distribution (e.g. Springel et al. 2006)? A widely held view is that the merging of halos is also the principal mechanism driving the evolution of the visible part of galaxies (see Benson 2010 for a recent review). However, several bodies of evidence are difficult to reconcile with this scenario.
-
•
ETGs are characterized by old and homogeneous stellar populations. Correlations tight enough to allow little room for random processes such as a sequence of mergers (apart from small mass additions through minor mergers at late epochs, see Kaviraj et al. 2008), and sensitivity to the environment (colorluminosity; fundamental plane relations; dynamical massluminosity) have been known for a long time and have been recently confirmed with very large samples, and shown to persist up to substantial redshifts (Renzini 2006; Clemens et al. 2009; Thomas et al. 2010; Rogers et al. 2010; Peebles & Nusser 2010, and references therein). More recently, a remarkably tight luminositysize correlation has been reported (Nair et al. 2010). In addition, ETGs were found to host supermassive black holes whose mass is proportional to the bulge and to the halo mass of the host galaxy (see Magorrian et al. 1998; also Ferrarese & Ford 2005 for a review). All that indicates that the formation and evolution of ETGs is almost independent of environment, and driven mainly by self-regulation processes and intrinsic galaxy properties such as mass.
-
•
There are rather tight, albeit not inescapable, observational constraints on the star-formation timescale in the most massive ETGs. An upper limit comes from the observed -enhancement or, more properly, iron under-abundance compared to elements. Depending on the slope of the assumed initial mass function (IMF), the observed Fe element ratios requires star formation timescales yr (e.g. Matteucci 1994; Thomas et al. 1999). But in merger-driven galaxy formation models star formation in ellipticals typically does not truncate after 1 Gyr (Thomas & Kauffmann 1999; however, see Arrigoni et al. 2010, Khochfar & Silk 2010). If a standard IMF is assumed a lower limit comes from (sub-)mm counts, implying that several percent of massive galaxies are forming stars at rates of thousands yr-1 at (see Chapman et al. 2003, 2005). This requires that this star-formation rate (SFR) is sustained for Gyr, much longer than the timescale of a merger-induced starburst, which is of order of the dynamical time ( Gyr for the massive ETGs of interest here; see, e.g., Benson 2010; Hopkins 2011). In other words, a single starburst episode is too short to account for the space density of (sub-)mm bright galaxies as well as for their present-day stellar masses. And indeed models envisage a sequence of mergers, and associated starbursts, throughout the galaxy lifetime, i.e. over a time span much longer than the upper limit set by the -enhancement. The problem of accounting for the counts of sub-mm galaxies may be eased assuming a top-heavy IMF (Baugh et al. 2005). Indeed, recent observational evidences (Gunawardhana et al. 2011; Dunne et al. 2011) indicate that highly star forming galaxies have IMFs with flatter high-mass power-law slopes than galaxies with low star formation rates. Gunawardhana et al. (2011), using a sample of galaxies from the Galaxy And Mass Assembly (GAMA) survey (Driver et al. 2009) covering the redshift range , find a dependence of on the SFR that, extrapolated to an yr-1, would give , substantially flatter than the Salpeter (1955) slope (). However, it is not clear that these results apply to the high- proto-spheroidal galaxies considered in this paper, since the IMF may depend on other parameters, such as age and metallicity. Moreover, the most recent study of the evolution of galaxies in the far-infrared/sub-mm based on starbursts triggered by mergers (Lacey et al. 2010) resorts to an even flatter high-mass IMF () and has still serious problems with reproducing the Herschel counts (see § 7).
-
•
Integral-field near-IR spectroscopy of galaxies with less extreme SFRs (of few yr-1) at , that appear to be very productive star formers in the universe (Dekel et al. 2009), has shown that in many cases they have ordered, rotating velocity fields with no kinematic evidence for ongoing merging (Genzel et al. 2006; Förster-Schreiber et al. 2009). Still, they harbor several starforming clumps: a complex morphology is not necessarily a symptom of merging. These galaxies show tight SFRmass correlations, with small dispersions (Daddi et al. 2007; Pannella et al. 2009; Dunne et al. 2009; Rodighiero et al. 2010; Maraston et al. 2010). This is not easily reconciled with a scenario in which star formation proceeds through a series of short starbursts interleaved by long periods of reduced activity and these galaxies have been caught in a special, starburst moment of their existence. The data are more easily accounted for if the high SFRs are sustained for some Gyr, much longer that a dynamical time typical of starbursts. Although the duration of the star-formation phase for these objects is longer than that of the more extreme objects considered in the previous bullet by a factor of 2 to 3, their final stellar mass is several times lower because the SFR is about an order of magnitude smaller. For these galaxies a weak -enhancement is predicted, consistent with observations.
-
•
A comparison of the stellar mass functions at with the local one shows that little additional growth can have occurred for through minor mergers (Mancone et al. 2010; Fan et al. 2010; Kaviraj et al. 2009).
It is clear from the above that the reconstruction of the star formation history through cosmic time for galaxies of different masses provides a critical test for galaxy formation and evolution. Since the star formation occurs within dusty molecular clouds and is deeply obscured at ultraviolet and optical wavelengths, data at far-IR/(sub-)mm wavelengths, where the absorbed radiation is re-emitted, are essential to provide a complete picture of it.
In this paper we focus on high redshift () galaxies. We exploit the far-IR/sub-mm data collected by the Herschel Space Observatory (Pilbratt et al. 2010) during the Science Demonstration Phase (SDP) of the Herschel Astrophysical Terahertz Large Area Survey (H-ATLAS, Eales et al. 2010a). The H-ATLAS is an open-time key program that will survey with PACS (Poglitsch et al. 2010) and SPIRE (Griffin et al. 2010) in five bands, from to m.
The observed SDP field covers an area of centered on . Complete descriptions on reduction of PACS and SPIRE data are given in Ibar et al. (2010) and Pascale et al. (2011), respectively. Source extraction and flux density estimation are described in Rigby et al. (2011). The detection limits, including confusion noise, are , 37.7, and 44.0 mJy/beam in the SPIRE bands at 250, 350, and m, respectively; in the PACS bands they are 132 mJy and 121 mJy at 100 and m, respectively.
The plan of the paper is the following. The selection of the sample is described in § 2. In § 3 we discuss the far-IR Spectral Energy Distribution (SED) of high- star forming galaxies, a fundamental ingredient for our photometric redshift estimates, presented in § 4. In § 5 we estimate the galaxy luminosity functions (LFs) at different redshift in the range . In § 6 we discuss some clues on star-formation timescales for massive galaxies. In § 7 model predictions for source counts from m to 2 mm are compared with the data. Our main conclusions are summarized in § 8.
Throughout the work we adopt a standard, flat CDM cosmology (see Komatsu et al. 2011) with matter density parameter and Hubble constant . We adopt a Bardeen et al. (1986) cold dark matter power spectrum with primordial index and cosmic mass variance . Stellar masses and luminosities of galaxies are evaluated assuming the Chabrier’s (2003) initial mass function (IMF); these can be converted to a Salpeter (1955) IMF on multiplying by a factor .
2. Sample selection
The H-ATLAS sources comprise both a low- galaxy population, identified through matching to the Sloan Digital Sky Survey (SDSS York et al. 2000) data (Smith et al. 2011a), and a high- population (median redshift ) identified through their far-IR colours (Amblard et al. 2010). Low- galaxies are generally normal/star-forming late-type galaxies with moderate opacity (Smith et al. 2011b; Dunne et al. 2011). Through analyses of clustering these two populations are found to be very different; the low- population () clusters like star-forming blue galaxies (Guo et al. 2011; van Kampen et al. 2011; Maddox et al. 2010), while the high- population clusters much more strongly, suggesting that the high- sources reside in more massive halos (Maddox et al. 2010).
In this work we investigate the evolution with cosmic time of high redshift galaxies with intense star-formation activity, interpreted as massive proto-spheroidal galaxies in the process of forming most of their stellar mass (Granato et al. 2004; Lapi et al. 2006). Since these objects are observed to be in passive evolution at –1.5, we confine ourselves to . At these redshifts sources above the H-ATLAS detection limits have dust luminosities and star-formation rates (SFRs) yr-1. They are therefore ultra-luminous infrared galaxies (ULIRGs). Their dust heating mostly comes from young massive stars within molecular clouds, implying, on one side, that their far-IR SEDs are generally (albeit not always, e.g. Hwang et al. 2010) warmer than those of low- dusty galaxies which have higher contributions from cooler interstellar dust heated by old stars, and, on the other side, that their optical emission is strongly attenuated. The last point means not only that spectroscopic redshifts are available just for a tiny fraction of sources, but also that we do not have at our disposal the multi-frequency optical/near-IR photometry that allowed photometric redshift estimates at lower (Dye et al. 2010; Vaccari et al. 2010; Eales et al. 2010b).
In fact, for most H-ATLAS galaxies, the only available data is the Herschel photometry, primarily in the three SPIRE bands (, , and m), plus mostly upper limits in the PACS and m bands. A key issue is then whether the redshift estimates that can be obtained from such data are sufficient to obtain meaningful estimates of the LFs at least over a limited redshift range. At first sight one would be inclined to answer ‘no’, but a closer investigation can suggest a more optimistic conclusion.
The dust re-radiation in starburst galaxies is expected to come from at least three astrophysical settings (e.g. Silva et al. 1998): molecular clouds, diffuse low-density clouds (cirrus), and circum-nuclear regions, heated by Active Galactic Nuclei (AGNs). The AGN dust emission peaks in the mid-IR (Granato & Danese 1994; Andreani et al. 2010; Lutz et al. 2010; Hatziminaoglou et al. 2010) and can be safely ignored in the SPIRE wavelength range. Molecular clouds are the preferential sites of star formation implying that they are endowed with intense radiation fields and relatively warm dust temperatures. The cirrus component is exposed to the less intense general radiation field due to older stellar populations that have come out from their native molecular clouds and is therefore characterized by lower dust temperatures.
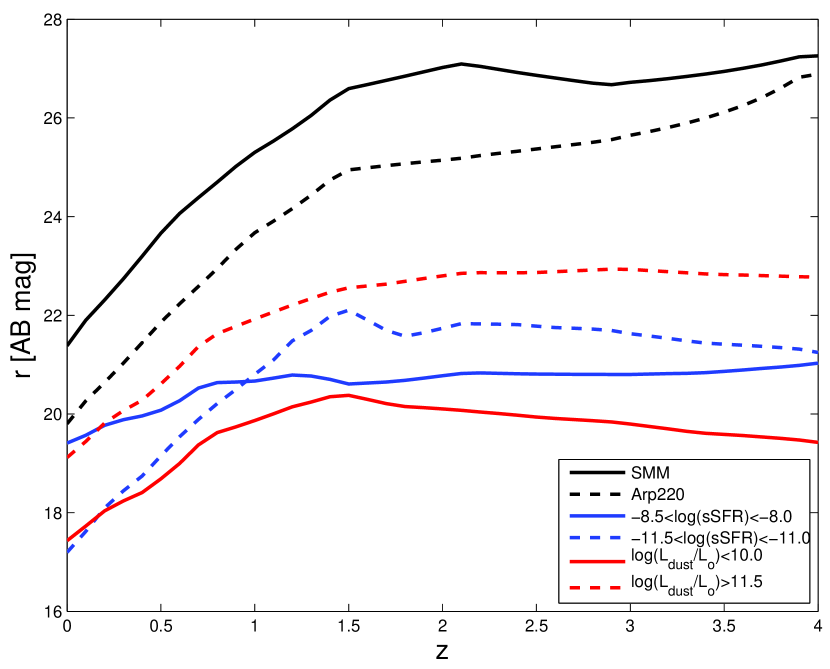
In the nearby Universe, molecular clouds and cirrus give comparable contributions to the far-IR emission from ‘normal’ late-type galaxies, with relatively low SFRs (Rowan-Robinson et al. 2005). The colder cirrus contribution is especially important in less optically obscured IR galaxies (Hwang et al. 2010) while the warmer molecular cloud (sometimes referred to as ‘starburst’) component becomes increasingly important for higher and higher SFRs (Rowan-Robinson et al. 2010). This argument also highlights a possible degeneracy: a ‘cold’ observed SED may be associated either to a low- cirrus dominated galaxy or to a redshifted warm galaxy. If the redshift is estimated using a warm SED, cold low- galaxies would be erroneously assigned high redshifts. This problem can be overcome, however, because cold, low- galaxies are only moderately obscured by dust (the cirrus optical depth cannot be very large), and are therefore relatively bright in the optical bands. This is illustrated by Fig. 1, which shows that the SEDs of optically identified SDP galaxies studied by Smith et al. (2011b) imply -band magnitudes brighter than the SDSS DR7 limit () at all redshifts even if their m flux density is at the detection limit, while ULIRGs, with SED like that of Arp220, (and even more, younger high- galaxies with SED like that of SMM J2135-0102, ‘The Cosmic Eyelash’; Ivison et al. 2010a, Swinbank et al. 2010) are fainter than this magnitude limit for the same m flux density111Note however that a galaxy with the real Arp220 luminosity would be brighter than up to . At it would have mag. At the same redshift, the true, non-demagnified SMM J2135-0102, would have mag. On the other hand, high- moderately obscured galaxies can be detected by the H-ATLAS survey only if they have very high stellar masses..
Therefore, we may weed out cold low- galaxies by dropping SDP galaxies with SDSS counterparts (Smith et al. 2011a), except those with optical (spectroscopic or photometric) redshifts in the range of interest here (). This operation, however, has potential drawbacks. First, it leaves in low- ULIRGs. This is not a big problem, since these objects have warm SEDs and therefore, as discussed below, their redshifts can be estimated with sufficient accuracy. Second, the reliability of SDSS counterparts can never be . For example, strongly lensed galaxies generally have an apparently reliable counterpart which is most likely the foreground lens. These objects can however be recovered since most frequently the lenses are ellipticals, whose optical colours are incompatible with a large dust emission. The fraction of false identifications among the optical counterparts to H-ATLAS SDP sources with reliability is estimated to be (Smith et al. 2011a). Although this fraction is reassuringly small, we need to keep in mind that some truly high- sources can be missed by our procedure.
Most importantly, not all the true counterparts can be identified with confidence, due to incompleteness of the SDSS catalog, positional uncertainties, close secondaries, and the random probability of finding a background source within that search radius (Dunne et al. 2011). According to Smith et al. (2011a), about 60% of the 6621 with m flux density mJy have counterparts brighter than mag in the SDSS (and are therefore, with few exceptions, at ). Of these, 2423 could be identified with a reliability , implying that another sources, i.e. about 23% of the total sample are really at but are missing a reliable identification. From the redshift distribution of reliable identifications (Fig. 6 of Smith et al. 2011a) we estimate that about 20% of these sources are at . If the same proportion applies to unidentified sources, the identification incompleteness of H-ATLAS SDP galaxies is , that we conservatively round to 20%. The effect of this incompleteness on our luminosity function estimates is discussed in § 5.
Starting from the catalog of SDP sources by Rigby et al. (2011), which contains 6876 sources, we drop the galaxies for which Smith et al. (2011a) have identified reliable counterparts. We further require detection at at m. In this way we get a sample (that will be taken as our reference sample) defined by the following criteria: i) mJy; ii) no optical identification with (Smith et al. 2011a); iii) detection at at m. The resulting sample is made of sources. The redshift estimates presented in § 4 indicate that some of these () are ULIRGS with SEDs akin to our templates; they will be excluded from the subsequent analysis.
Most (, i.e., ) galaxies satisfying the above criteria are detected at at m, and this obviously helps with the photometric redshift estimates. This is because low- galaxies have low ratios and are therefore lost when we raise the m flux limit (see also Amblard et al. 2010).
3. SEDs of high- sub-mm galaxies
For the objects of interest here, with yr-1, only the ‘warm’ (starburst) component is relevant. It is important to take into account, however, that its SED is much broader than a single temperature grey-body (see, e.g., Silva et al. 1998). Over the m range (in the rest-frame) such a SED can be approximated, to better than , by a sum of two grey-bodies, each described by
| (1) |
with temperatures K and K, and dust emissivity indices and 2, respectively (see also Dunne & Eales 2001). A fit to the observed SEDs of standard template starburst galaxies with quite different SFRs (M82, Arp220), and of the strongly lensed galaxy SMM J2135-0102, confirms the validity of this approximation and shows that the relative normalization of the two grey bodies varies by factors of several. Mid/far-IR data on starburst galaxies emphasize the warmer component, while sub-mm data emphasize the colder one; if a single temperature dust is used, data in different wavelength ranges may yield substantially different temperatures. If the source redshift is in the range , PACS and SPIRE wavelengths extend across the dust emission peak (which is typically at a rest-frame wavelength m). This may allow reasonably accurate redshift estimates using only Herschel data (Negrello et al. 2010). However, only a minor fraction of the H-ATLAS SDP galaxies have at least one PACS detection, usually at m, and these are mostly at low redshifts; we must also beware of the flux boosting by confusion, increasing at longer wavelengths (see § 4).
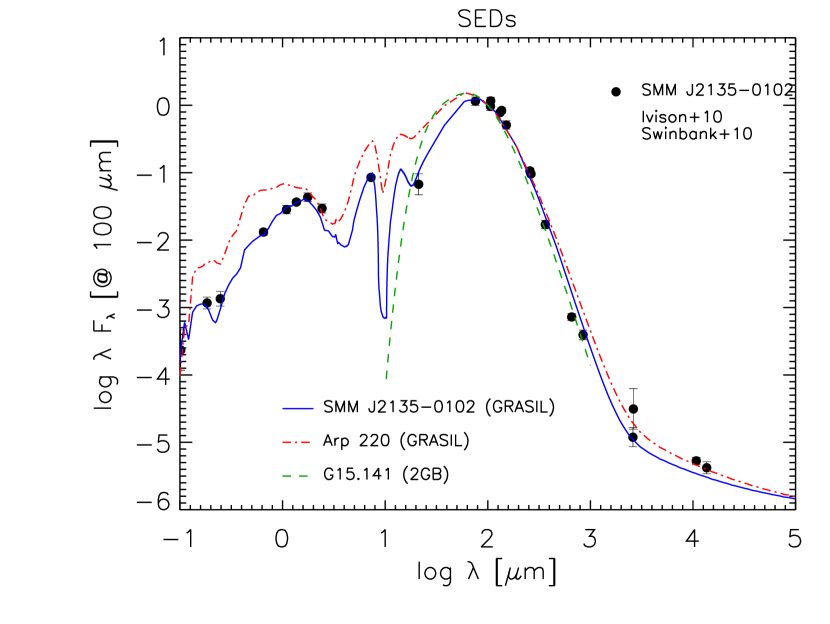
Arp220 and SMM J2135-0102 are of particular interest because their SEDs are well determined and have SFRs quite typical of the galaxies considered here. We have modeled their spectral energy distributions from extreme-UV to radio frequencies through the spectrophotometric code GRASIL222For information on the code see http://adlibitum.oat.ts.astro.it/silva/default.html, and for a web-based version see http://galsynth.oapd.inaf.it, which includes a sophisticated treatment of dust reprocessing (Silva et al. 1998; Schurer et al. 2009; Silva et al. 2011). The results are illustrated in Fig. 2; it must be stressed that the dominant contribution for wavelengths m is provided by molecular clouds (more details in Bressan et al. 2011, in prep.). Assuming a Chabrier (2003) IMF we obtain a SFR of for Arp220 and of for SMM J2135-0102 (a Salpeter IMF would yield and , respectively). Then assuming the usual linear scaling between the SFR and the continuum far-IR luminosity integrated between m and m, i.e.,
| (2) |
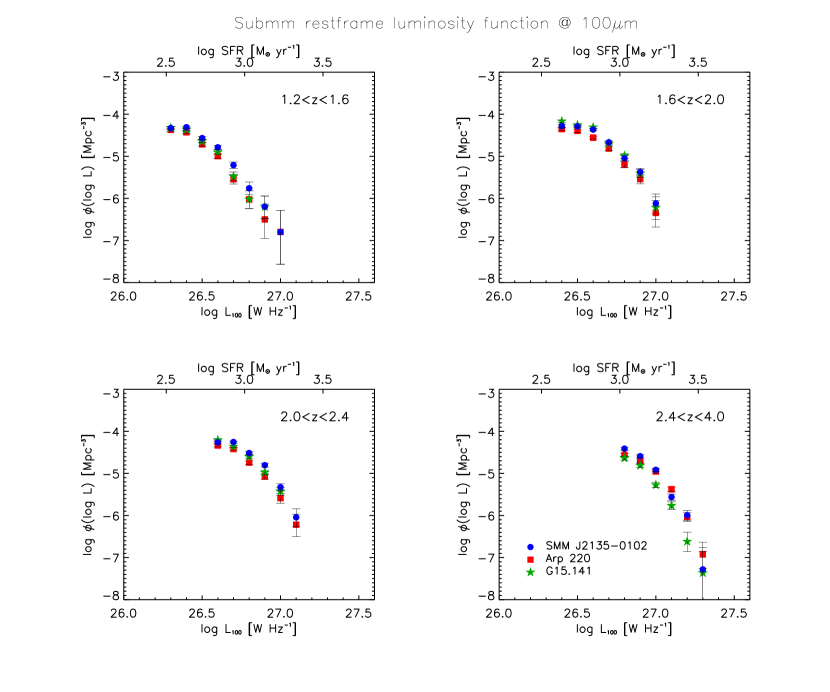
we find and . The difference between the two coefficients is well within the expected range. Kennicutt (1998) pointed out that variations of can be due to differences in the star-formation history, implying different effective ages of the stellar populations. In Fig. 2 we also sketch the far-IR SED of G15.141 (H-ATLAS J142413.9+022304), a strongly lensed sub-mm galaxy at with estimated SFR of several hundreds yr-1 (Cox et al. 2011), modeled as the sum of two grey-bodies with K, K, , and a ratio of 0.02 between the coefficients of the warm and of the cold components. We choose the SEDs of these 3 galaxies (Arp220, SMM J2135-01012, and G15.141) as our references to quantify the effect of different choices for the SED on estimates of the LFs. SMM J2135-01012 has the smallest ratio and G15.141 exhibits the steepest decrease at long wavelengths.
4. Estimating the redshifts of sub-mm galaxies
A major source of concern is the boosting of fluxes in the Rigby et al. (2011) catalogue due to confusion by faint sources. Since the effect is larger at longer wavelengths, because of the poorer angular resolution, it tends to bias high the redshift estimates based on Herschel photometry. According to the simulations carried out by Rigby et al. (2011), of sources detected at at m show a flux boosting by a factor and by a factor , and the effect becomes negligible for sources.
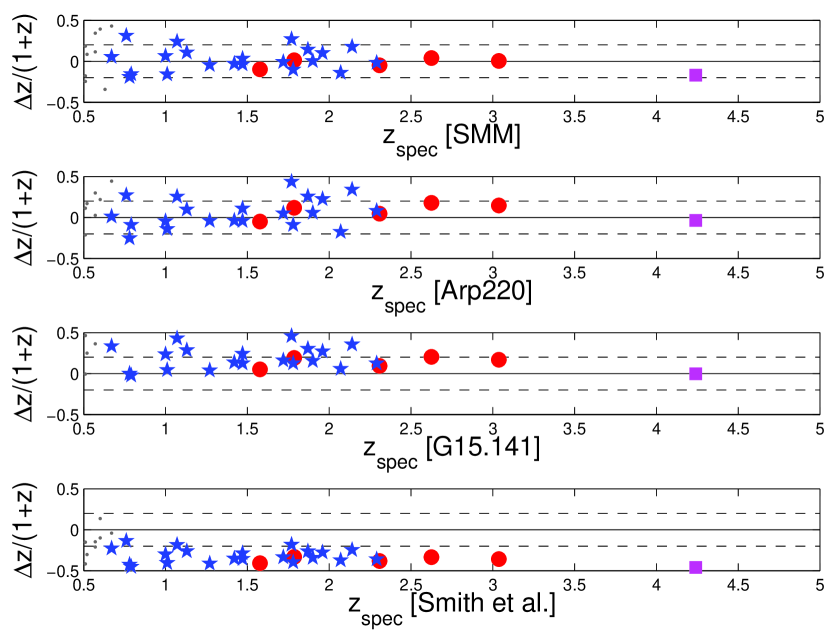
To investigate the quantitative impact of the flux boosting we estimated the photometric redshifts of 39 H-ATLAS galaxies at for which spectroscopic redshifts are available. The results are presented in Fig. 3 for our 3 reference SEDs. The average SED of low- H-ATLAS SDP galaxies, determined by Smith et al. (2011b), was also used, for comparison. There is no indication that photometric redshifts of the high- sources are systematically overestimated when we use the SED of SMM J2135-0102 as a template. The median value of is with a dispersion of 0.21. The situation is only slightly worse in the case of Arp220: the median value of is 0.06 with a dispersion of 0.27. The median offset between photometric and spectroscopic redshifts increases to 0.18, with a dispersion of 0.28, if we use the cooler SED of G15.141. In the redshift range () we are most interested in there are 24 objects. The median values of are (dispersion 0.12) for SMM J2135-0102, 0.07 (dispersion 0.16) for Arp220, 0.16 (dispersion 0.13) for G15.141. There is no statistically significant difference between the 6 strongly lensed objects, having detections at m, and the other 33 sources, whose flux densities are representative of those in our sample. The median values of and the dispersions rapidly increase as we go down in redshift, as expected since our templates do not match those of low- galaxies whose SEDs include large cirrus contributions. For the H-ATLAS SDP sources with and spectroscopic redshift in the Smith et al. (2011a) catalog we find median of 0.38 (dispersion 0.45), 0.42 (dispersion 0.54), and 0.63 (dispersion 0.55) for SMM J2135-0102, Arp220, and G15.141, respectively. Not surprisingly, the redshift estimates based on the mean low- SED of Smith et al. (2011a) go in the opposite direction: the redshifts are systematically underestimated. The mean offset is small () at and increases (in absolute value) to for , and to for . The dispersions are 0.31, 0.29, and 0.23 for , , and , respectively. This confirms that the low-, optically bright, H-ATLAS galaxy population has far-IR properties different from those of high- galaxies. Hence, the SEDs determined at low- are not applicable at high-.
This test suggests that, at least for sources at , errors on photometric redshift estimates are more related to the choice the SED template than to the signal-to-noise ratio at m, and hence to flux boosting. This is mostly due to the fact that the relative errors on flux densities are larger at longer wavelengths so that the data points more liable to flux boosting weight less in the minimum fit to the template SED. We do see in most cases that the best fit SED is below the m data, as expected if the latter is overestimated. We have checked this by lowering the m flux densities first by , and this left the derived redshift distribution almost unchanged, and then by a factor of 2. In the latter case, we got a median value of , with only of cases at (here is the redshift estimated using the fluxes tabulated by Rigby et al. 2011).
A second concern is the effect of the SED variety of active star forming galaxies. To quantify the corresponding errors in the redshift estimates, we generated a catalogue of galaxies with a distribution of flux densities reflecting that of our sample and redshifts randomly selected in the range . Each redshift was randomly assigned to one of the well observationally determined SEDs of local (ultra-)luminous IR galaxies with star formation rates yr-1 and with contributions from an active nucleus to the far-IR flux studied by Vega et al. (2008). To the , , and m flux densities we associated errors extracted randomly from the distribution of the errors for real observations. We have then estimated the redshifts of simulated galaxies, based on flux densities at SPIRE wavelengths, using each of our three template SEDs.
In of the cases we have . Note that this is likely an upper limit since the previous test and the analysis of multi-frequency source counts (see § 7) strongly indicate that the SEDs of high- galaxies with intense star-formation are more uniform, and closer to that of SMM J2135-01012, than those of star-forming low- galaxies. This can be expected since these galaxies have generally lower star-formation rates (of order of tens yr, to be compared with yr-1 for high- galaxies) and higher contributions to dust heating from old stellar populations. As the SFR increases, the ratio between the contributions to the far-IR/SMM SED from the molecular cloud component (associated to star-formation) and from the cirrus component (heated by the general interstellar radiation field) increases causing a systematic variation of the SED shape with the specific star formation rate, as indeed observed (da Cunha et al. 2008; Smith et al. 2011b). This trend stops when the former component dominates, as in the case of sources considered in this paper, and the SEDs become more uniform.
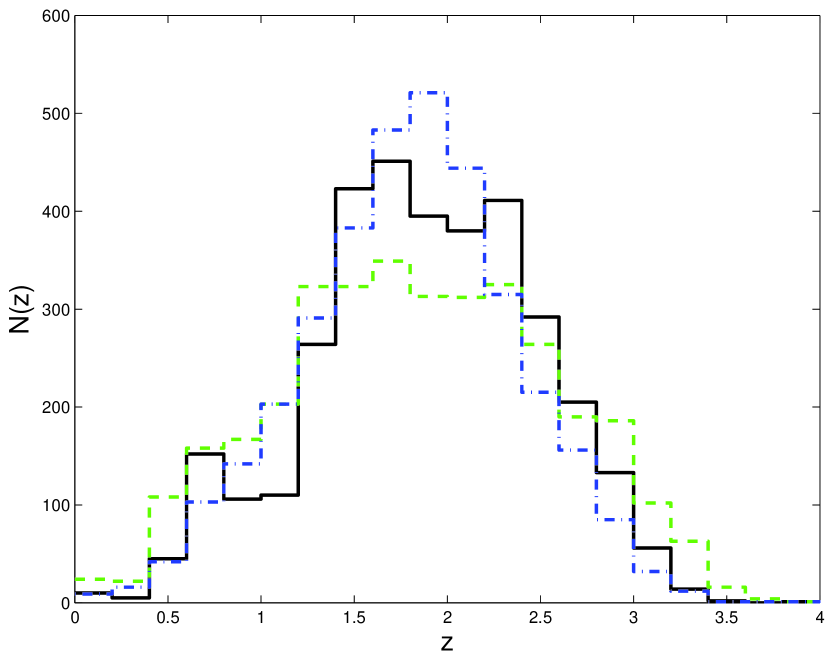
We have estimated the redshifts333The estimated redshifts are available at http://people.sissa.it/gnuevo/photoz/. of objects in the samples defined in § 2. Sources undetected at at m were attributed a upper limit of mJy. The calculations were repeated using upper limits (45 mJy): the derived redshift distribution did not change appreciably. The results are similar, but somewhat more sensitive to the effect of boosting (based on the tests described above), if we use the catalogued flux densities and errors also for sources with . The redshift estimate is the result of a minimum -fit of each of the three templates to the SPIRE and PACS data (including upper limits444The results, however, are only weakly constrained by PACS data. We do not find significant differences if we use upper limits or ignore these data altogether.). Fig. 4 shows that, after correcting for the offsets highlighted by Fig. 3, the derived redshift distributions are only moderately affected by the choice of the template SED; they have broad maxima in the range and a tail extending up to , consistent with earlier estimates for BLAST (Ivison et al. 2010b) and Herschel (Amblard et al. 2010; Eales et al. 2010) samples, when the different selections, and in particular the fact that we have dropped galaxies with optical counterparts, are taken into account. Sources with estimated will be excluded from the subsequent analysis. With our preferred SED, that of SMM J2135-01012, our reference sample (mJy, , and no optical identifications) contains 3093 galaxies (i.e. of the 6876 H-ATLAS SDP galaxies) at , consistent with the fraction of sources expected to be below the SDSS limit () and therefore at high . Only 33 of them have detections in at least one PACS channel; these include the strongly lensed galaxies found by Negrello et al. (2010).
5. Luminosity function of high- sub-mm galaxies
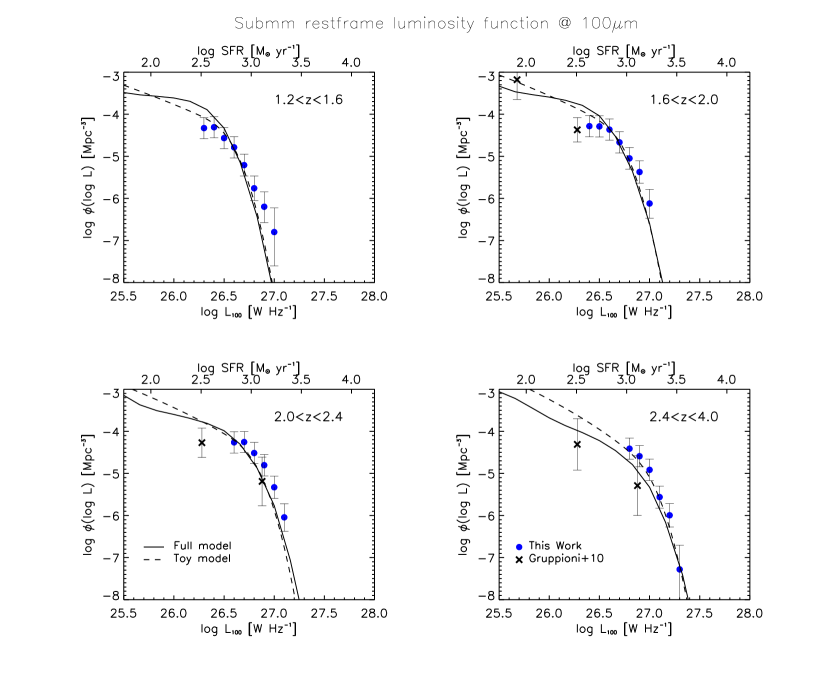
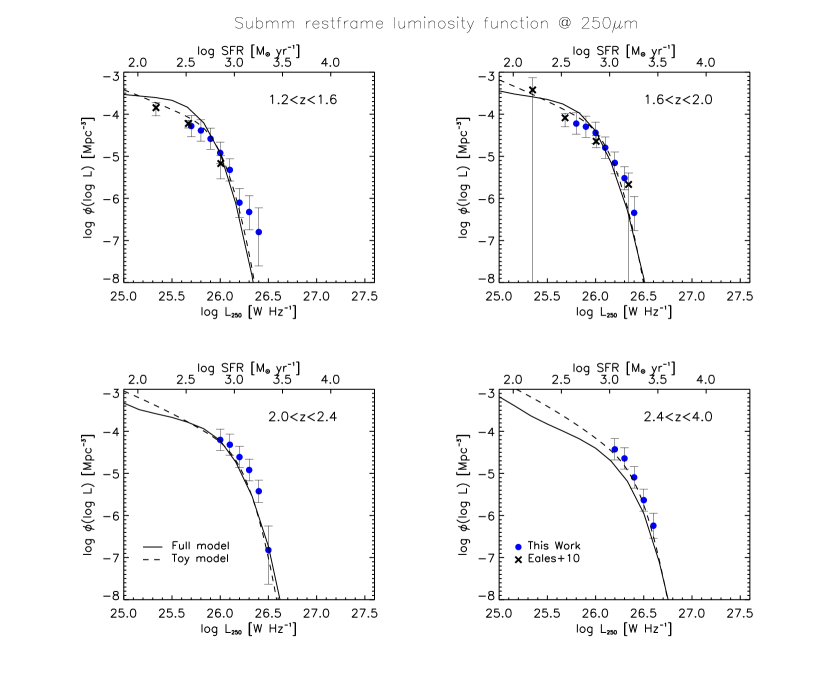
We have computed the LFs at rest-frame wavelengths of and m in redshift intervals (, , , ), exploiting the classical Schmidt’s (1968) estimator, our redshift estimates, and corrections computed from the SEDs used for the redshift estimates. The was computed, for each galaxy, taking into account the redshift boundaries of the bin and the maximum accessible redshifts implied by the 250 and m flux density limits. In the case of our preferred SED (SMM J2135-01012) the numbers of sources in these redshift bins are 900, 891, 821, and 502, respectively.
The error on introduces both a statistical and a systematic effect. The latter is related to the Eddington bias, that can be quantified with a Bayesian approach. The probability that the true redshift of a source is when its estimated value is reads
| (3) |
where is the probability that the estimated redshift of a source is when its true value is and is the true redshift distribution. We take to be a Gaussian with mean and dispersion equal to the rms difference between spectroscopic and photometric redshifts for the galaxies in Fig. 3 and as a proxy for . The maximum likelihood estimate of is the value for which peaks. All the luminosity functions presented in this paper are corrected for this bias. We caution, however, that this correction does not entirely account for the Eddington bias due to the errors on estimated luminosities. The effect is expected to be smaller than that of the error on , which is the main source of the error on luminosity. A full treatment would require extensive numerical simulations that are beyond the scope of this paper.
As mentioned in § 2, we expect a residual contamination of our reference sample by cold low- galaxies with genuine counterparts that could not be identified with . To quantify the effect of this contamination on our luminosity function estimates we have exploited the H-ATLAS SDP sources with spectroscopic redshift in the Smith et al. (2011a) catalog. Out of a total of galaxies with , 682 comply with our selection criteria (mJy and ). For these sources the use of the SMM J2135-0102 template for redshift estimates is inappropriate and yields a substantial positive offset and a rather broad dispersion of (see § 4). In fact, after the Bayesian correction described above, this template yields for 160 of them. Of these, 88 fall in the first redshift bin, 45 in the second, 21 in the third, and 6 in the fourth. If the sample of SDP galaxies with is representative and about 20% of the 5021 galaxies in our sample prior to the removal of objects have unrecognized genuine SDSS counterparts, the low- contaminants would amount to 14% of sources in the first redshift bin, 7.4% in the second, 3.8% in the third, 1.8% in the fourth. On the other hand, it is estimated (Smith et al. 2011a) that of the 2418 identifications are spurious. If these spurious identifications have the same redshift distribution as the 3469 sources not identified with , we would be missing about 4% of sources in each redshift bin. Finally, we have to take into account the incompleteness of the SDP catalog. This can be done using the flux density dependent correction factors given in Table 2 of Rigby et al. (2011).
The estimated LFs, taking into account all the corrections described above, are presented in Figs. 5–8 and in Tables 1 and 2. The upper scale in these figures displays the SFR corresponding to the or m luminosity for the SMM J2135-0102 calibration giving
| (4) |
while for the coefficient is . Since for galaxies with intense star formation the rest-frame dust emission peaks in the range m, the m luminosity is a good estimator of the SFR.
Note that the flattening of the LFs at the lowest luminosities may be, at least in part, due to the overestimate of the accessible volume yielded by the estimator for objects near to the flux limit, pointed out by Page & Carrera (2000; see also Eales et al. 2009). On the other hand, the Page & Carrera (2000) estimator holds under the assumption that the luminosity function varies little within the luminosity bin, while in our case it is very steep over most of the luminosity range.
Fig. 6 illustrates the effect of varying the template SED, after correcting for the median offsets in the redshift estimates highlighted by Fig. 3. The differences are quite limited. Such a stability of the LF estimates follows from some favorable circumstances. First, the large numbers of sources in each redshift bin smooth out the effect of errors on redshift estimates. Second, for the redshift range considered here () one of the SPIRE wavelengths is always sampling directly the rest-frame SED in the range m, implying that -corrections (and the related uncertainties) are minimal. Third, the LFs are only moderately sensitive to the uncertainty on redshift estimates. This can be shown as follows. The luminosity at a rest-frame frequency is related to the flux density at the observed frequency by
| (5) |
where
| (6) |
Since, in our case, , . Then it is easily checked that, in the redshift range of interest here, , so that
| (7) |
The LF, , is computed by weighting each galaxy by the inverse of the maximum accessible volume (Schmidt 1968), i.e., . At we have, roughly, , whence
| (8) |
Since the error on the LF determination due to uncertainty in the redshift estimate amounts to around dex. The overall uncertainty is the sum in quadrature of the statistical error and of the error coming from the uncertainty on the redshift estimate. As shown in Fig. 8, the correction for the Eddington bias is rather small compared to the overall uncertainty of the LF.
In Figs. 5 and 7 our LF estimates are compared with those by Gruppioni et al. (2010) and Eales et al. (2010b), respectively. The latter authors adopted a grey body SED with K and a dust emissivity index . The assumed dust temperature is possibly more appropriate for relatively low SFR/far-IR luminosity galaxies while typical dust temperatures of SPIRE-detected galaxies are somewhat higher (Chapman et al. 2010; Amblard et al. 2010). The different choice for the SED has a substantial impact on the correction and therefore on the estimated rest-frame luminosity. For example, for a galaxy at and a given observed m flux density, the Eales et al. SED yields a rest-frame m luminosity a factor higher than that obtained using either the SMM J2135-0102 or the Arp220 SED. Once we replace their correction with ours, the LF estimates by Eales et al. (2010b) are found to be in good agreement with ours (see Fig. 7). The two estimates are to some extent complementary: the deeper samples used by Eales et al. have allowed them to reach lower luminosities, while the larger H-ATLAS SDP area has allowed us to reach higher luminosities at high redshifts.
Gruppioni et al. (2010) exploited the deep PACS data at and m in the GOODS-N field (), obtained as part of the PACS Evolutionary Probe (PEP) survey, to estimate the and m rest-frame LFs up to . They have used all the available data to derive the SEDs of their sources.
About of Eales et al. sources have spectroscopic redshifts and almost all the others have photometric redshifts typically based on nine optical and near-IR bands. Gruppioni et al. (2010) have spectroscopic redshifts for of their sources; for the remaining they have obtained photometric redshifts from multifrequency data. The agreement between our LFs and theirs is an additional confirmation that photometric redshifts derived from sub-mm photometry are good enough for the present purpose.
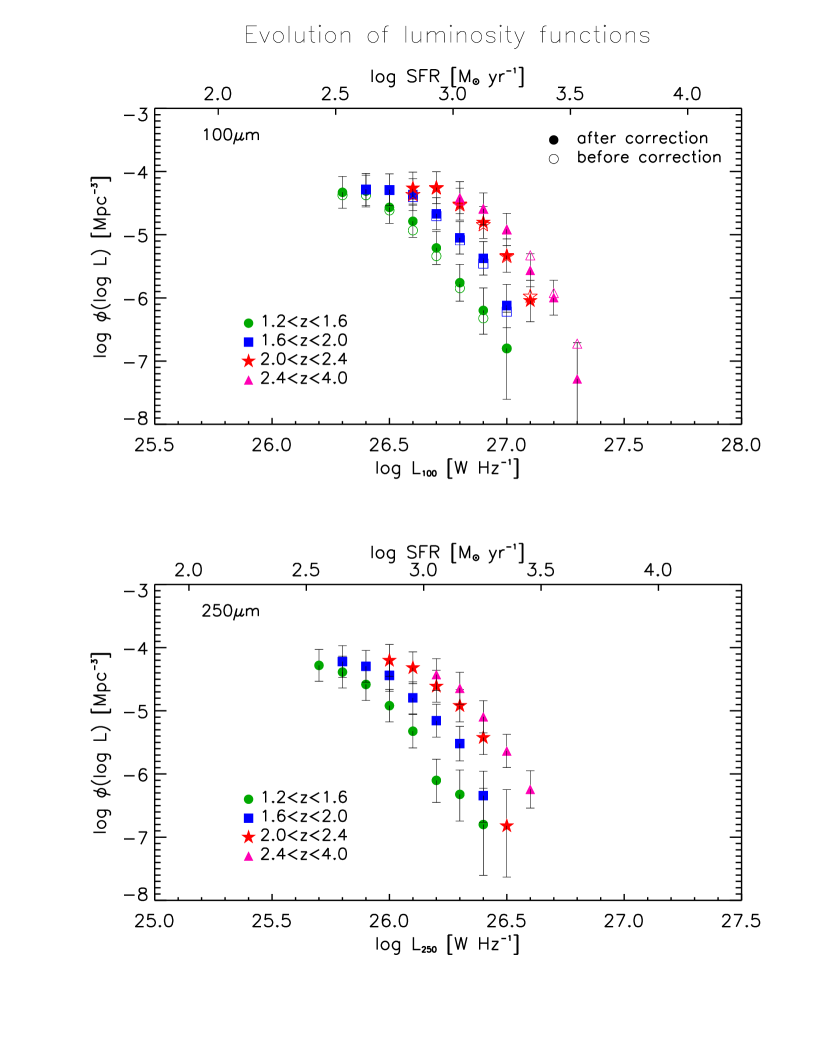
In the sampled luminosity range, the LFs exhibit an exponential fall off and a substantial luminosity evolution at least up to , while a weaker evolution at higher is indicated (see Fig. 8). The m luminosity corresponding to is , , , and for , , , , respectively. At m the corresponding luminosities are , , , and . These results are consistent with those based on PEP survey data (Gruppioni et al. 2010), which have poorer statistics at high . We remark that our data supplemented with those by Gruppioni et al. (2011) and Eales et al. (2010b) allow the determination of the LFs over only one order of magnitude in luminosity for , and over only a factor of about for .
6. Clues on star-formation timescales in massive halos
We now discuss how the LFs of high redshift star forming galaxies at sub-mm wavelengths and the counts in sub-mm and mm bands concur with their clustering properties in probing the process of star formation in the progenitors of massive ETGs.
6.1. Clustering properties and host halo masses of sub-mm galaxies
Several lines of evidence indicate that high- (sub-)mm bright galaxies are strongly clustered (Blain et al. 2004; Farrah et al. 2006; Magliocchetti et al. 2007; Viero et al. 2009; Maddox et al. 2010; Hall et al. 2010; Cooray et al. 2010; Dunkley et al. 2010; Amblard et al. 2011; Planck Collaboration 2011). The large-scale clustering power-spectrum probes the relation between the distribution of visible sources and that of dark matter halos, which is a very sensitive function of the halo mass scale (e.g. Matarrese et al. 1997).
The study of the angular correlation function of H-ATLAS SDP galaxies (Maddox et al. 2010) did not detect significant clustering for the m selected sample, while the clustering signal was found to be strong (although with large uncertainties) for samples selected at 350 and m. The measurements are consistent with the idea that sub-mm sources consist of a low redshift population of moderately star-forming galaxies and a high redshift population of highly clustered star-bursting galaxies. The former, known to be weakly clustered (e.g. Madgwick et al. 2003; Guo et al. 2011; van Kampen et al. 2011), dominate the m selected sample, while the selection at longer wavelengths emphasizes strongly clustered galaxies with intense star-formation activity at , with typical halo masses , which are interpreted as the ancestors of present day massive ellipticals (Negrello et al. 2007).
6.2. Timescales of sub-mm and UV bright phases
The bright end of the LFs provides information on the average duty cycle of the star formation in the large halos indicated by the clustering analysis. This can be illustrated using a simple model (hereafter referred to as the ‘toy model’) relying on the following assumptions:
-
•
Most of the star formation occurs soon after the fast collapse phase of the halo, as identified by Zhao et al. (2003) and by several subsequent works (e.g., Diemand et al. 2007, Genel et al. 2010, Wang et al. 2011).
-
•
The halo formation rate is given by the positive term of the derivative with respect to the cosmic time of the Sheth & Tormen (1999, 2002) cosmological mass function [eq. (1) of Lapi et al. (2006)]. This was shown to be a good approximation at the redshifts () and for the halo masses () of interest here (e.g., Haehnelt & Rees 1993; Sasaki 1994; see also the discussion by Lapi et al. 2006).
-
•
During the main episode of star formation, the SFR is proportional to the halo mass, i.e., , with a small scatter.
-
•
The duration of the main star formation episode, before quenching by the AGN feedback, is roughly constant for the considered range of halo masses () and shorter than the expansion timescale at the source redshift.
This very simple model provides a good fit to the data (Figs. 6 and 7) if yr and:
| (9) |
with a rather small () scatter. We have used Eq. (2) with the calibration appropriate for SMM J2135-0102 to pass from star formation rate to FIR luminosity, and the SED of this object to go from the FIR luminosity to monochromatic luminosities. The fit would significantly worsen if the halo mass range associated to individual galaxies extends above . This suggests that the star formation becomes very inefficient in the most massive halos, possibly due to the cooling time becoming longer than the expansion time. The bright end of the LFs is quite sensitive to the value of ; e.g., raising from our fiducial value of to would increase by a factor the m LF at and W Hz-1. Interestingly, the duration of the main star-formation episode yielded by the toy model matches that inferred from the observed -enhancement of massive local ETGs (see § 1).
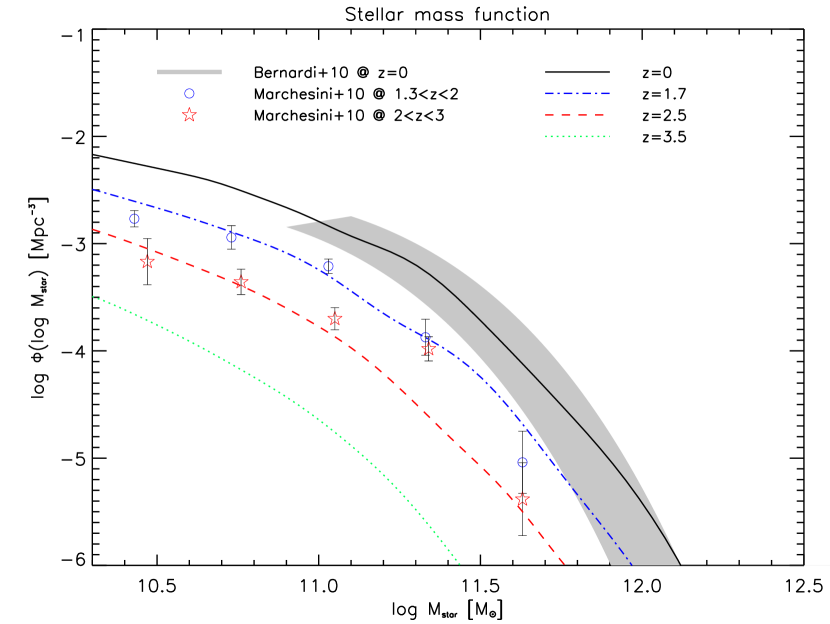
A rough estimate of the mass in stars at the end of the main star-formation episode, for given halo mass and redshift, can be obtained multiplying the appropriate SFR by its duration yr, and correcting for the fraction of stellar mass returned to the interstellar medium. For a Chabrier IMF the latter amounts to after Gyr from a burst of star formation, and increases to after Gyr and to after several Gyrs. Combining with the halo mass function at that redshift we get an estimate of the stellar mass function of ETGs. A comparison with observational determinations at different redshifts is shown in Fig. 9. The agreement is remarkably good, considering the crudeness of the approach. This suggests that the toy model captures the basic aspects of the star formation in massive galaxy halos at high redshift.
A comparison of our LFs with the UV ones at (Sawicki & Thompson 2005; Reddy & Steidel 2009) for galaxies with comparable SFRs shows that the UV space densities are a factor lower, implying that the UV bright, dust-free phase is much shorter than the far-IR bright phase. The far steeper slope of the UV LF, compared with the sub-mm ones, for hundreds implies that, for the corresponding range of galaxy masses, the UV-bright phase is shorter for larger SFRs, i.e. for more massive galaxies, as predicted by Mao et al. (2007).
If, as implied by most current semi-analytical models (Granato et al. 2001, 2004; Croton et al. 2006; Hopkins et al. 2008; Somerville et al. 2008), the black hole growth is linked to star-formation, most of the present-day black hole mass should have been accreted by the end of the star-forming phase (see Bonfield et al. 2011). Therefore, the local ratio (Marconi & Hunt 2003) between the black hole mass and the stellar mass of the host ETG should be already in place then (but see also McLure et al. 2006 and Peng et al. 2006). If so, the stellar mass function translates immediately into a black hole mass function which, in turn, can be translated into a bolometric luminosity function assuming that the black holes, immediately before being switched off, emit at the Eddington limit for a time . We get:
| (10) |
The corresponding band luminosity is , where is the bolometric correction (Marconi et al. 2004; Hopkins et al. 2007). We can then compare the comoving density of galaxies with that of the associated QSOs. For example, at there are sub-mm galaxies per with , while the density of QSOs brighter than the corresponding luminosity of () is (Croom et al. 2004). This implies that the optical visibility time of the QSOs is about a factor of shorter than the duration of the sub-mm bright phase, in agreement with independent estimates (Shankar et al. 2004; Marconi et al. 2004; see also Lapi et al. 2006).
The physical model by Granato et al. (2001, 2004), further elaborated by Lapi et al. (2006), complies with the indications coming from the previous analysis. In this model the star formation in massive galaxies occurs on a timescale of several yr, is very soon obscured by dust and is stopped by quasar feedback. The star formation is triggered by the rapid cooling of the gas within a region with an approximate size of the halo virial radius, i.e., kpc, encompassing about of the total mass (dark matter plus baryons), and is regulated by the energy feedback from SNe and AGNs (the latter being relevant especially in the most massive galaxies). As a result, the star formation is a very inefficient process, as proved by the fact that on the average only about of the baryons in the Universe are converted into stars (Fukugita & Peebles 2004), with a possible maximum of for halo masses (Shankar et al. 2006; Moster et al. 2010). It is worth noticing that the Negrello et al. (2007) predictions for the lensed sub-mm bright galaxies follow directly from the LF and redshift distribution yielded by the Lapi et al. (2006) model. We have updated this model by replacing the Arp220 GRASIL SED used, e.g., by Negrello et al. (2007) with the SED of SMM J2135-0102. The resulting LFs are shown in Figs. 5 and 7, labeled as ‘Full model’. We stress that the LFs from the Full model are not fits to the data, but have been computed with the same parameters used by Lapi et al. (2006; see their Table 1). This model has proven to be successful in reproducing a wealth of observables, including high redshift quasar LFs.
Note that, in the present framework, sources dominating the high- LF are proto-spheroidal galaxies that are in passive evolution at and therefore do not contribute to the low- FIR/sub-mm LFs computed, e.g., by Dye et al. (2010), Vaccari et al. (2010), and Dunne et al. (2011).
An alternative model whereby intense star-formation at is not supported by mergers was proposed by Dekel et al. (2009). In this model, star-formation is driven by steady cold streams supplying gas at an approximate rate of
| (11) |
where is the baryonic fraction in the halos in units of the cosmological value, . The dependence of the cold gas inflow rate, , on and are similar to those implied by our toy model [Eq. (9)], implying that the SFR must be roughly proportional to . To account for the SFR indicated by the Herschel data, the star-formation efficiency must be very high, for and . For comparison, the mean cosmic star-formation efficiency is (Fukugita & Peebles 2004; Komatsu et al. 2011). In halos more massive than cold streams are suppressed by shock heating.
7. (Sub)-mm counts and redshift distributions
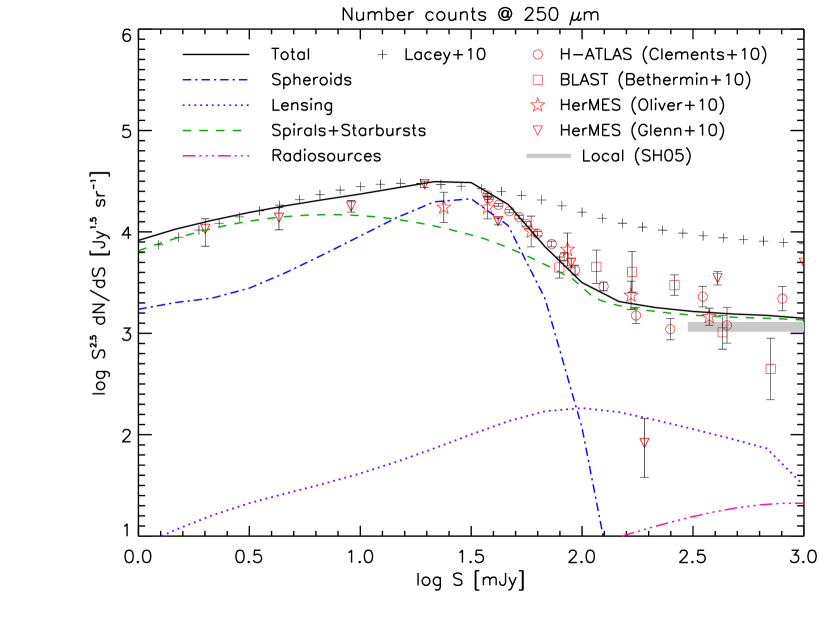
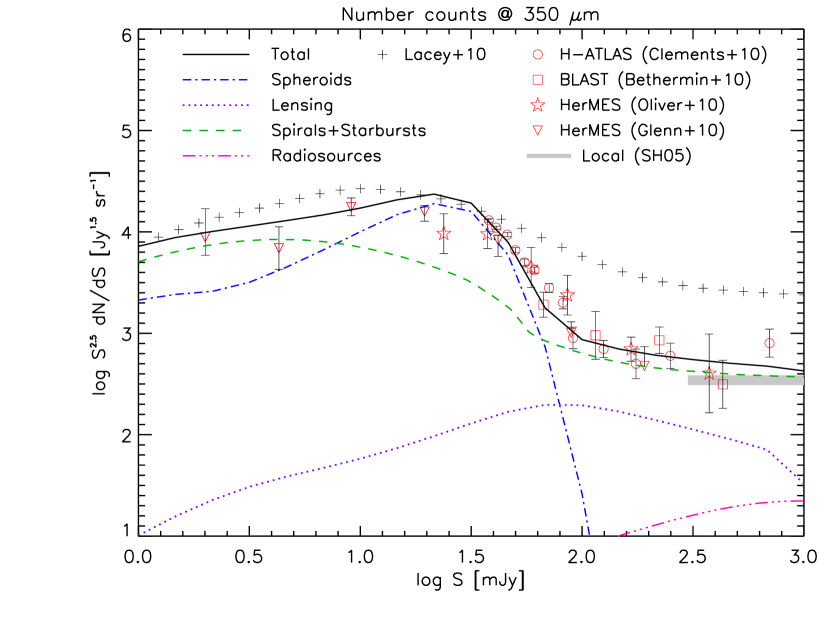
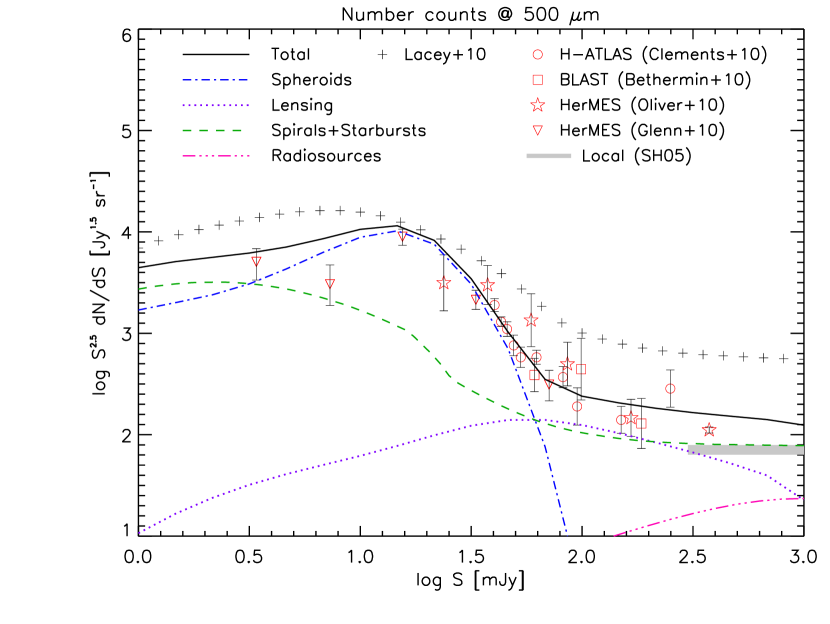
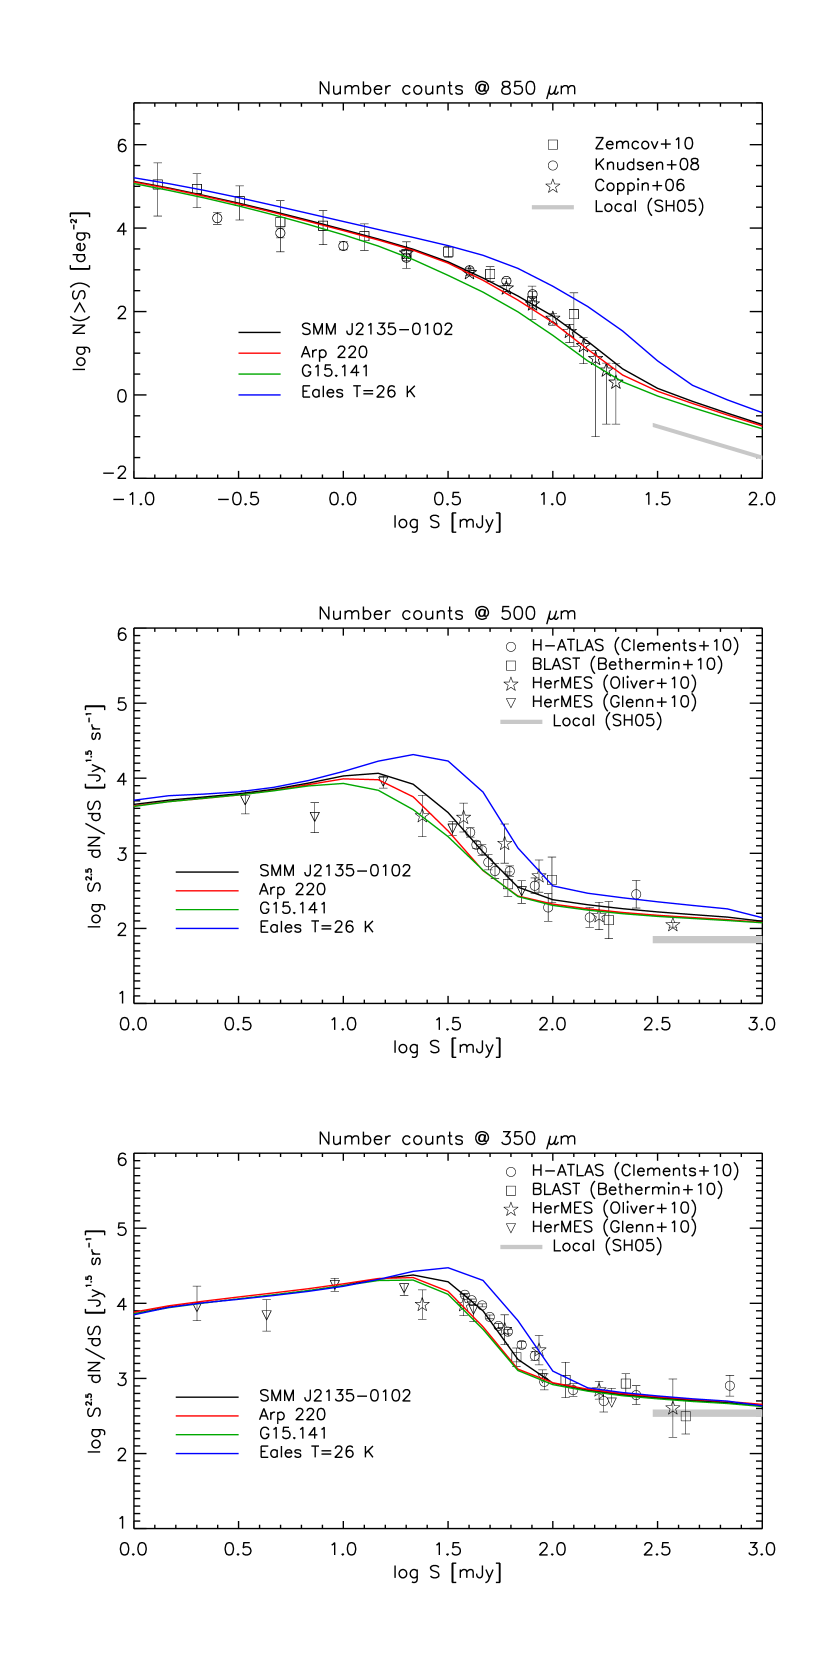
Figs. 10, 11, and 12 compare the predictions of the ’full model’ with the observed counts in Herschel/SPIRE bands. In these figures the contributions to the counts of proto-spheroidal galaxies have been complemented with those of normal late-type and starburst galaxies computed by Negrello et al. (2007). As for massive proto-spheroidal galaxies, the main difference with the counts in the latter paper comes from having replaced the Arp220 SED yielded by GRASIL with that of SMM J2135-0102. The contribution from lensed proto-spheroidal galaxies has been estimated using the amplification distribution of Perrotta et al. (2003) and Negrello et al. (2007).
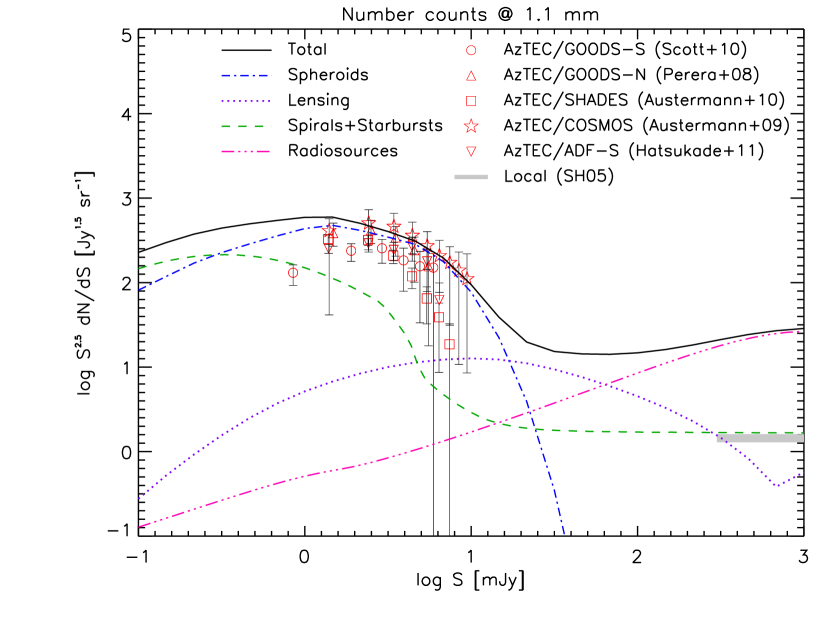
An interesting prediction of the model is that massive proto-spheroidal galaxies dominate the (sub-)mm counts over a limited flux density range (about a decade). At m the Euclidean normalized differential counts of these objects peak at mJy, i.e. roughly at the detection limit of the H-ATLAS survey, and sink down rapidly at fainter fluxes where the contribution of starburst galaxies takes over and accounts for the results of the analysis by Glenn et al. (2010). Since the proto-spheroidal galaxies are mostly at while late-type/starburst galaxies are mostly at , the model implies that the redshift distribution drifts towards lower redshifts as we go fainter. This is not in contradiction with the finding by Bourne et al. (2011) that the contribution of galaxies to the cosmic infrared background is in the SPIRE bands.
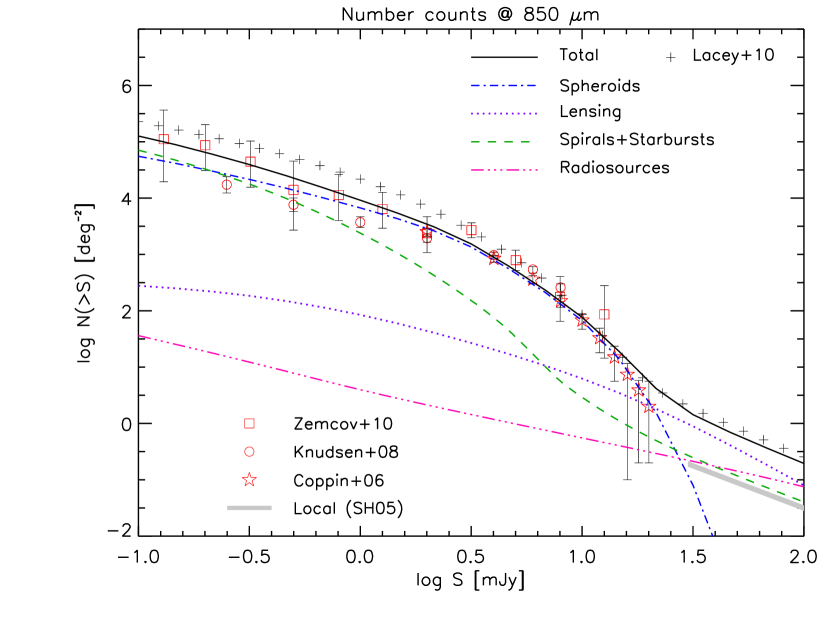
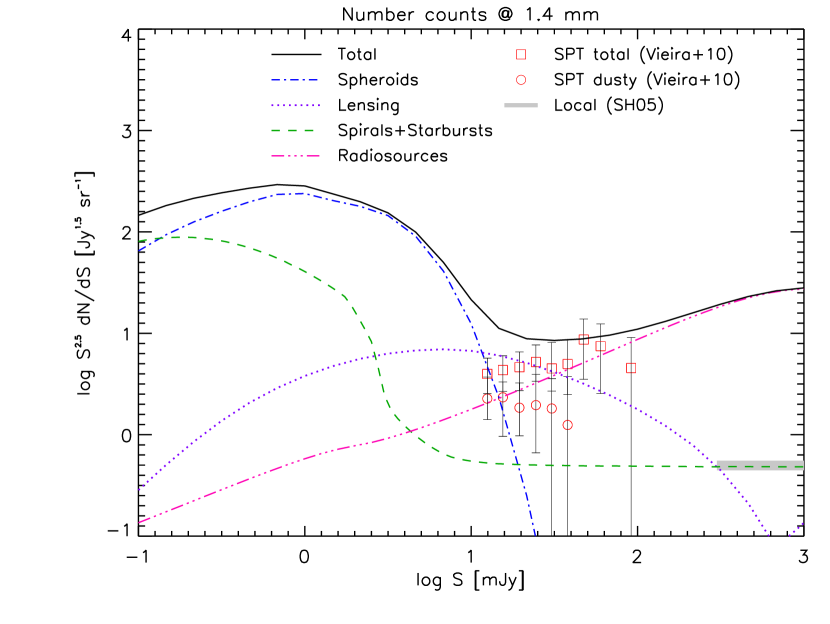
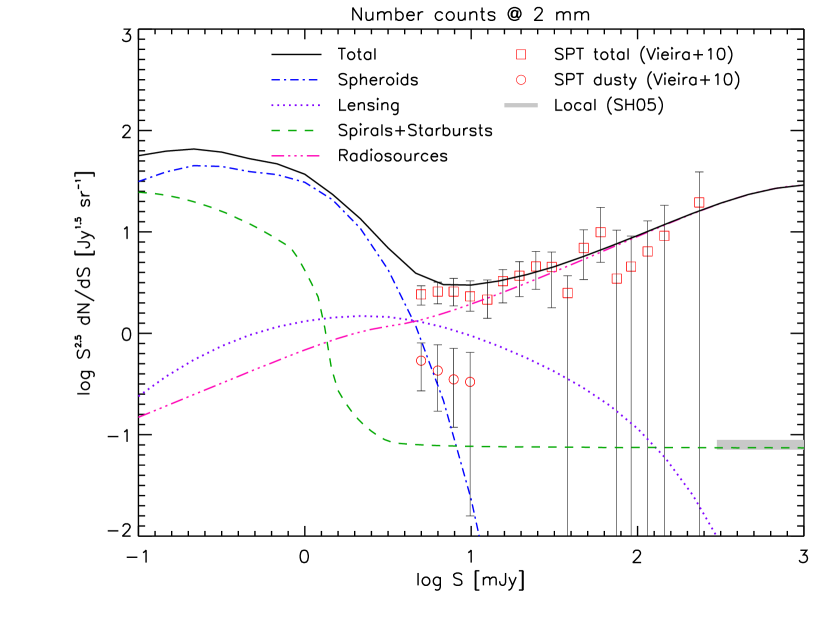
The model accurately fits the source counts from m to m (Figs. 1013). The observed counts at 1.1 mm (Fig. 14) span the peak of the Euclidean normalized counts, while those at 1.4 and 2 mm (Figs. 15 and 16) only cover the brightest tail of the counts, dominated by strongly lensed sources (apart from radio sources). The model somewhat overestimates the counts of strongly lensed galaxies at 1.4 and 2 mm, and the most recent counts at 1.1 mm. This may suggest that higher- galaxies, that yield larger and larger contributions to the bright counts at increasing mm wavelengths, have SEDs slightly colder than SMM J2135-0102 and closer to that of G15.141.
The flux density range over which massive proto-spheroidal galaxies dominate the counts increases somewhat with increasing wavelength (Figs. 1016), reflecting the increase of the redshift range through which the strongly negative correction makes the flux corresponding to a given luminosity essentially independent of distance. The broadening of the peak in the Euclidean normalized counts of proto-spheroidal galaxies is not very large, however, because massive halos become increasingly rare at high . At all wavelengths the bright counts of proto-spheroidal galaxies drop down very steeply, reflecting the exponential decline of the halo mass function. This rapid fall-off, borne out by the data, can hardly be accounted for by phenomenological models that evolve the LF of local populations of dusty galaxies backwards in time: spheroidal galaxies are essentially in passive evolution since and are therefore not represented in local LFs at far-IR to mm wavelengths.
The physical model of Lacey et al. (2010) works pretty well at m but does not correctly predict the rapid fall-off of the counts above mJy at m, m and m (Figs. 1013). The decline of the counts is most easily understood if the duration of the most active star-formation phase in massive halos is relatively short, as also required by the observed -enhancement (see § 1). However, in merger-driven evolutionary models, such as the one by Lacey et al. (2010), the star formation does not truncate after Gyr. At m consistency with the data can be recovered if sub-mm bright galaxies contain large amounts of cold dust, but this leads to m, m and m counts less steep than observed.
The fact that using, for high- galaxies, the SMM J2135-0102 SED we are able to simultaneously reproduce the source counts over a broad wavelength range indicates that this SED is indeed typical for sub-mm bright galaxies. In fact the results on the counts vary substantially if we use different SEDs (see Fig. 17). Almost by construction, in all cases the m (the main selection wavelength) counts are accurately reproduced. But if, for example, we use the SED of G15.141 instead of the SMM J2135-0102 one, the longer wavelength counts are somewhat underestimated. The situation is better, but still not as good as for our preferred SED, if we use the Arp220 SED. The quite cold ( K) SED used by Eales et al. (2010b) leads to counts substantially in excess of the observed ones. Thus the ‘colors’ of the counts constrain the SEDs of high redshift star forming and in particular on the abundance of galaxies with cold dust temperatures. As pointed out by Hwang et al. (2010) apparently very cold values of could be caused by an overestimation of the sub-millimeter fluxes due to blending problems or inappropriate single-temperature SED fitting.
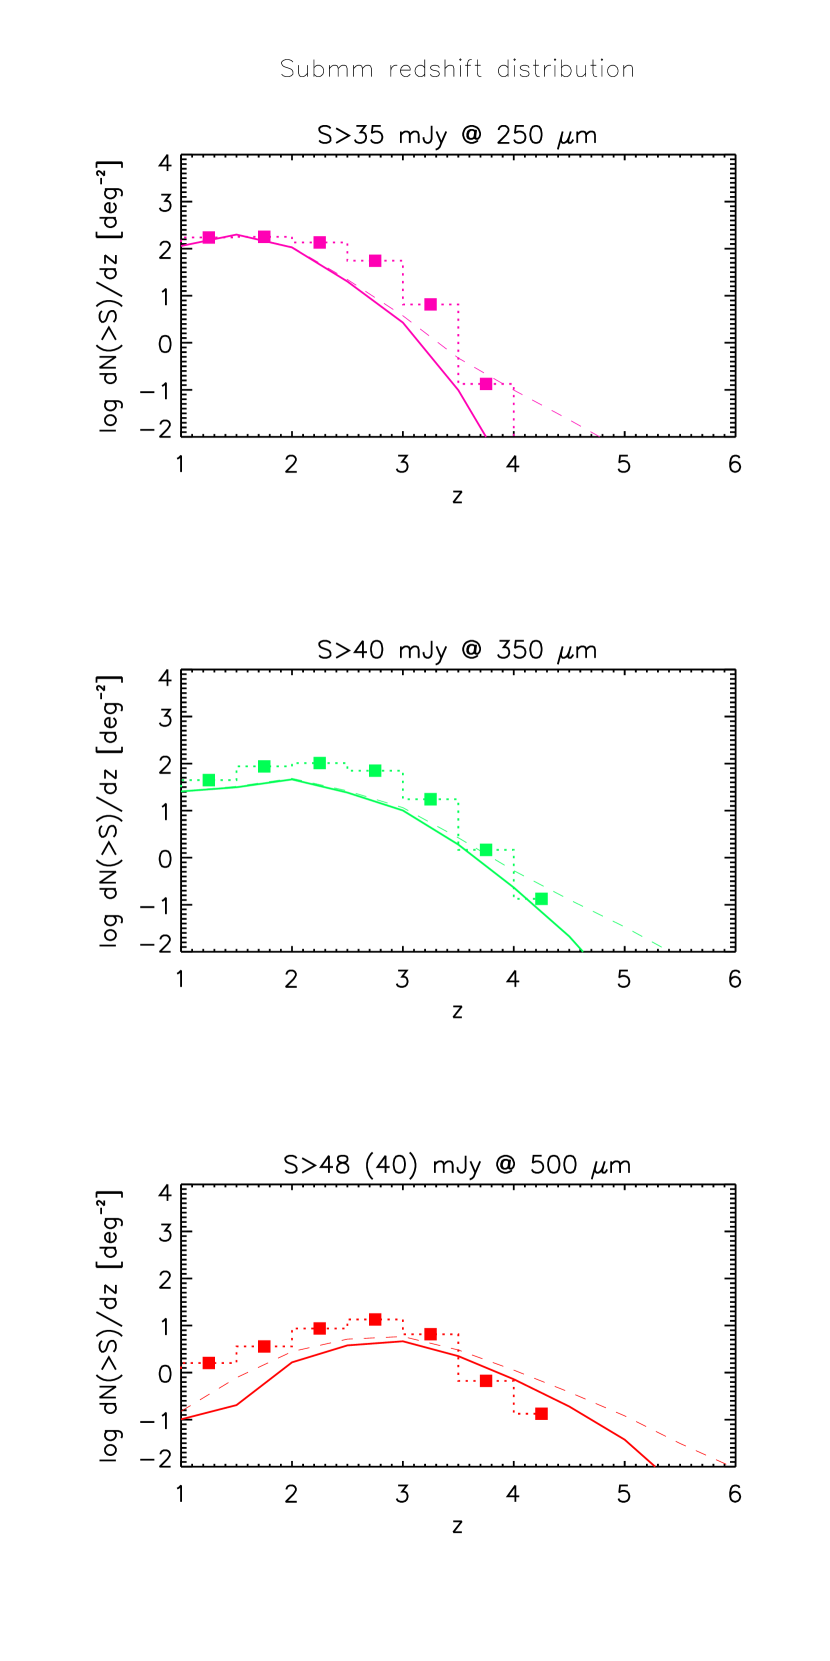
Fig. 18 compares the redshift distributions of H-ATLAS SDP sources detected at , , mJy at , and m, respectively, with those predicted by the model. The effective flux correction factors tabulated by Clements et al. (2010) have been applied for this comparison. Since the redshift distributions are a key ingredient for the successful prediction of the abundance of strongly lensed galaxies and of their redshift range (Negrello et al. 2010), they cannot be badly wrong. Thus, the agreement between our estimates and model predictions is a confirmation of the global consistency of our results.
The shift in the redshift distribution of sub-mm bright galaxies to higher redshifts with increasing selection wavelength happens because the strongly negative correction extends to larger and larger redshifts and the lensing probability increases with . For example, we expect that, after removing local objects that are found to be only of the total (Vieira et al. 2010), the redshift distribution of sources with mJy has a broad peak around . Using the SMM J2135-0102 SED we also find that the observed mm spectral indices are correlated with : for , , while for , . Thus the value of this spectral index may be a rough redshift indicator.
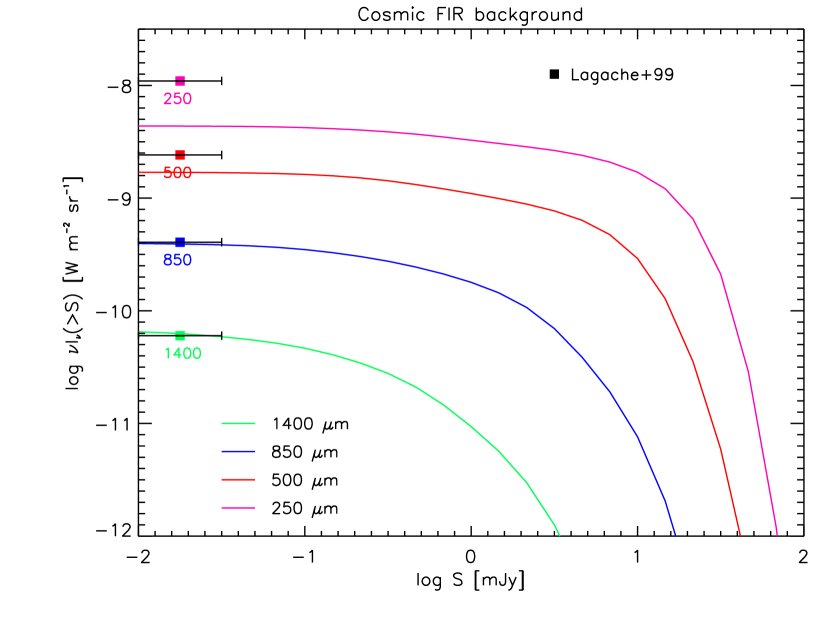
In Fig. 19 we illustrate the contribution of proto-spheroids to the extragalactic infrared background intensity (Lagache et al. 1999; Hauser & Dwek 2001) according to our physical model. At m the background is almost entirely accounted for by high-redshift proto-spheroids, while these contribute about and about of the background at m and m, respectively.
8. Conclusions
We have exploited the H-ATLAS SDP survey data to investigate the evolution of the 100 and m LFs of bright star-forming galaxies () at . Redshifts have been estimated using 3 SED templates representative of the range of well measured SEDs of galaxies with such a high star formation. The rms uncertainties on redshift estimates have been assessed comparing our redshift estimates with spectroscopic redshift measurements for 39 H-ATLAS galaxies at as well as by means of simulations. Both methods yield rms values of or smaller. The LFs derived using the redshift estimates based on each of the 3 SED templates are very similar to each other. The uncertainties due to the spread of redshift estimates are added in quadrature to Poisson errors to compute the global uncertainties on the LFs. Our LF estimates are in close agreement (in the common redshift and luminosity range, after applying the same corrections) with those at m by Eales et al. (2010b), based on a substantial fraction of spectroscopic redshifts complemented with photometric redshifts of optical/near-IR counterparts, as well with those at m by Gruppioni et al. (2010), based on an even higher fraction of spectroscopic redshifts. This is a further confirmation that our redshift estimates are sufficiently accurate to allow reliable estimates of the LFs.
The SED of SMM J2135-0102 was found to perform significantly better than the others in the tests we made, at least up to , and was therefore adopted as our reference. Remarkably, this SED allowed us to simultaneously fit the counts over a broad wavelength range.
We find (see Fig. 8) a significant luminosity evolution at least up to while the luminosity function shows a modest variation between the last two redshift bins, centered at and , respectively, even though the corresponding time interval is Gyr, substantially larger than the time interval (Gyr) between the central redshifts of the second and third bin ( and ). This is consistent with the results based on PEP survey data (Gruppioni et al. 2010). We show that the evolution of the LF reflects that of the halo formation rate if, for the very massive galaxies represented in our sample, the star-formation rate obeys a simple relationship with halo mass (estimated from the clustering properties) and redshift [Eq. (9)] and the lifetime of the main star-formation phase is yr, consistent with the constraint coming from the -enhancement observed in the most massive ETGs.
The stellar mass function resulting from the derived star-formation rates and timescale nicely fits the observed stellar mass function of passively evolving ETGs at .
A comparison of sub-mm and UV LFs indicates that the UV visibility time of massive galaxies is much ( times) shorter than the duration of the sub-mm bright phase ( yr). This implies that dust forms very rapidly after the onset of the main episode of star formation, either in the ISM (Draine et al. 2009; Dunne et al. 2011) or by effect of Type-II SNae (Dunne et al. 2003, 2009; Matsuura et al. 2011).
As discussed by Mao et al. (2007), a longer UV bright phase is expected for less massive galaxies. This prediction is supported by the flatter slope of the far-IR LF, compared to the UV one, for hundreds , implying a decrease with increasing galaxy mass of the ratio of UV to far-IR space densities, i.e. of the ratio between UV and far-IR lifetimes.
In the same vein we find that the duration of the optically bright QSO phase is of order of , i.e., of about yr, consistent with independent evidences. On the other hand, the bright end of the QSO LF is somewhat less steep than that of sub-mm galaxies. This is not surprising because, although the evolution of the SFR and of accretion into the central black hole may well be linked, the relationship is mediated by several steps that introduce a substantial scatter that, coupled with the curvature of the LF, flattens its bright tail.
The and m LFs at different redshifts are quite well reproduced by the physical model of ETG formation and evolution by Granato et al. (2001, 2004), further elaborated by Lapi et al. (2006), without any adjustment of the parameters. As discussed in these papers, the model is built in the framework of the standard hierarchical clustering scenario. Many simulations (e.g., Zhao et al. 2003, Diemand et al. 2007, Genel et al. 2010, Wang et al. 2011) have shown that the growth of a halo occurs in two different phases: a first regime of fast accretion in which the potential well is built up by the sudden mergers of many clumps with comparable masses; and a second regime of slow accretion in which mass is added in the outskirts of the halo, only occasionally affecting the central region where the galactic structure resides. According to the model, the fast accretion phase triggers a burst of star formation that, in massive halos at , starts an evolutionary sequence that can be summarized as follows. There is an early, short phase of (almost) dust-free star formation when the galaxy shines as a bright UV source. It is followed by a dust-enshrouded star formation phase when the galaxy shines in the far-IR/sub-mm range. The duration of both the UV bright phase and the far-IR/sub-mm bright phase is shorter for the most massive galaxies, with the highest SFRs; for these objects the UV phase lasts yr and the far-IR/sub-mm phase lasts yr. Then there is a phase, lasting several yr, when the nucleus shines as a bright QSO after having swept away most of the interstellar gas and dust. Finally, passive evolution of the stellar populations follows, and the galaxy evolves into a local ETG.
According to this model, star-forming proto-spheroidal galaxies account for a substantial fraction of the cosmic infrared background (see Fig. 19) and dominate the cosmic SFR at , while at lower the SFR is dominated by late-type (normal and starburst) galaxies. This model was the basis for the successful predictions the sub-mm counts of strongly lensed galaxies by Perrotta et al. (2003) and Negrello et al. (2007). It also accurately reproduced the epoch-dependent galaxy luminosity functions in different spectral bands, as well as a variety of relationships among photometric, dynamical and chemical properties, as shown in previous papers (see Table 2 of Lapi et al. 2006 and additional results, especially on the galaxy chemical evolution, in Mao et al. 2007 and Lapi et al. 2008).
References
- (1)
- (2) Amblard, A., et al. 2010, A&A, 518, L9
- (3)
- (4) Amblard, A., et al. 2011, Nature, 470, 510
- (5)
- (6) Andreani, P., Magliocchetti, M., & de Zotti, G. 2010, MNRAS, 401, 15
- (7)
- (8) Arrigoni, M., Trager, S. C., Somerville, R. S., & Gibson, B. K. 2010, MNRAS, 402, 173
- (9)
- (10) Austermann, J. E., et al. 2009, MNRAS, 393, 1573
- (11)
- (12) Austermann, J. E., et al. 2010, MNRAS, 401, 160
- (13)
- (14) Bardeen, J. M., Bond, J. R., Kaiser, N., & Szalay, A. S. 1986, ApJ, 304, 15
- (15)
- (16) Baugh, C. M., Lacey, C. G., Frenk, C. S., Granato, G. L., Silva, L., Bressan, A., Benson, A. J., & Cole, S. 2005, MNRAS, 356, 1191
- (17)
- (18) Benson, A. J. 2010, Phys. Rep., 495, 33
- (19)
- (20) Bernardi, M., Shankar, F., Hyde, J. B., Mei, S., Marulli, F., & Sheth, R. K. 2010, MNRAS, 404, 2087
- (21)
- (22) Béthermin, M., Dole, H., Cousin, M., & Bavouzet, N. 2010, A&A, 516, A43
- (23)
- (24) Blain, A. W., Chapman, S. C., Smail, I., & Ivison, R. J. 2004, ApJ, 611, 725
- (25)
- (26) Bonfield, D. G., et al. 2011, MNRAS, in press (preprint arXiv:1103.3905)
- (27)
- (28) Bourne, N., et al. 2011, MNRAS, submitted
- (29)
- (30) Bressan, A., et al. 2011, in preparation
- (31)
- (32) Chabrier, G. 2003, PASP, 115, 763
- (33)
- (34) Chapman, S. C., Blain, A. W., Ivison, R. J., & Smail, I. 2003, Nature, 422, 695
- (35)
- (36) Chapman, S. C., Blain, A. W., Smail, I., & Ivison, R. J. 2005, ApJ, 622, 772
- (37)
- (38) Clemens, M. S., Bressan, A., Nikolic, B., & Rampazzo, R. 2009, MNRAS, 392, L35
- (39)
- (40) Clements, D. L., et al. 2010, A&A, 518, L8
- (41)
- (42) Cooray, A., et al. 2010, A&A, 518, L22
- (43)
- (44) Coppin, K., et al. 2006, MNRAS, 372, 1621
- (45)
- (46) Cox, P., et al. 2011, ApJ, submitted
- (47)
- (48) Croom, S. M., Smith, R. J., Boyle, B. J., Shanks, T., Miller, L., Outram, P. J., & Loaring, N. S. 2004, MNRAS, 349, 1397
- (49)
- (50) Croton, D. J., et al. 2006, MNRAS, 365, 11
- (51)
- (52) da Cunha, E., Charlot, S., & Elbaz, D. 2008, MNRAS, 388, 1595
- (53)
- (54) Daddi, E., et al. 2007, ApJ, 670, 156
- (55)
- (56) Dekel, A., et al. 2009, Nature, 457, 451
- (57)
- (58) De Zotti, G., Ricci, R., Mesa, D., Silva, L., Mazzotta, P., Toffolatti, L., & González-Nuevo, J. 2005, A&A, 431, 893
- (59)
- (60) Diemand, J., Kuhlen, M., & Madau, P. 2007, ApJ 667, 859
- (61)
- (62) Draine, B. T. 2009, in Cosmic Dust - Near and Far, ASP Conf. Ser., Vol. 414, T. Henning, E. Grün, & J. Steinacker eds., p. 453
- (63)
- (64) Driver, S. P., et al. 2009, Astronomy and Geophysics, 50, 050000
- (65)
- (66) Dunkley, J., et al. 2010, ApJ, submitted (preprint arXiv:1009.0866)
- (67)
- (68) Dunne, L., et al. 2009, MNRAS, 394, 3
- (69)
- (70) Dunne, L., et al. 2009, MNRAS, 394, 1307
- (71)
- (72) Dunne, L., et al. 2011, MNRAS, in press (preprint arXiv:1012.5186)
- (73)
- (74) Dunne, L., & Eales, S. A. 2001, MNRAS, 327, 697
- (75)
- (76) Dunne, L., Eales, S., Ivison, R., Morgan, H., & Edmunds, M. 2003, Nature, 424, 285
- (77)
- (78) Dye, S., et al. 2010, A&A, 518, L10
- (79)
- (80) Eales, S., et al. 2009, ApJ, 707, 1779
- (81)
- (82) Eales, S. A., et al. 2010a, A&A, 518, L23
- (83)
- (84) Eales, S., et al. 2010b, PASP, 122, 499
- (85)
- (86) Fan, L., Lapi, A., Bressan, A., Bernardi, M., De Zotti, G., & Danese, L. 2010, ApJ, 718, 1460
- (87)
- (88) Farrah, D., et al. 2006, ApJ, 641, L17; erratum 2006, ApJ, 643, L139
- (89)
- (90) Ferrarese, L., & Ford, H. 2005, Space Sci. Rev., 116, 523
- (91)
- (92) Förster-Schreiber, N. M., et al. 2009, ApJ, 706, 1364
- (93)
- (94) Fukugita, M., & Peebles, P. J. E. 2004, ApJ, 616, 643
- (95)
- (96) Genel, S., Bouché, N., Naab, T., Sternberg, A., & Genzel, R. 2010, ApJ, 719, 229
- (97)
- (98) Genzel, R., et al. 2006, Nature, 442, 786
- (99)
- (100) Glenn, J., et al. 2010, MNRAS, 409, 109
- (101)
- (102) González-Nuevo, J., et al. 2005, ApJ, 621, 1
- (103)
- (104) Granato, G. L., & Danese, L. 1994, MNRAS, 268, 235
- (105)
- (106) Granato, G. L., De Zotti, G., Silva, L., Bressan, A., & Danese, L. 2004, ApJ, 600, 580
- (107)
- (108) Granato, G. L., Silva, L., Monaco, P., Panuzzo, P., Salucci, P., De Zotti, G., & Danese, L. 2001, MNRAS, 324, 757
- (109)
- (110) Griffin, M. J., et al. 2010, A&A, 518, L3
- (111)
- (112) Gruppioni, C., et al. 2010, A&A, 518, L27
- (113)
- (114) Gunawardhana, M. L. P., et al. 2011, MNRAS, 415, 1647
- (115)
- (116) Guo, Q., et al. 2011, MNRAS, 412, 2277
- (117)
- (118) Haehnelt, M. G., & Rees, M. J. 1993, MNRAS, 263, 168
- (119)
- (120) Hall, N. R., et al. 2010, ApJ, 718, 632
- (121)
- (122) Hatsukade, B., et al. 2011, MNRAS, 411, 102
- (123)
- (124) Hatziminaoglou, E., et al. 2010, A&A, 518, L33
- (125)
- (126) Hauser, M. G., & Dwek, E. 2001, ARA&A, 39, 249
- (127)
- (128) Hopkins, P. F. 2011, arXiv:1101.4230
- (129)
- (130) Hopkins, P. F., Cox, T. J., Kereš, D., & Hernquist, L. 2008, ApJs, 175, 390
- (131)
- (132) Hopkins, P. F., Richards, G. T., & Hernquist, L. 2007, ApJ, 654, 731
- (133)
- (134) Hwang, H. S., et al. 2010, MNRAS, 409, 75
- (135)
- (136) Ibar, E., et al. 2010, MNRAS, 409, 38
- (137)
- (138) Ivison, R. J., et al. 2010a, A&A, 518, L35
- (139)
- (140) Ivison, R. J., et al. 2010b, MNRAS, 402, 245
- (141)
- (142) Kaviraj, S., et al. 2008, MNRAS, 388, 67
- (143)
- (144) Kaviraj, S., et al. 2009, A&A, 503, 445
- (145)
- (146) Kennicutt, R. C., Jr. 1998, ARA&A, 36, 189
- (147)
- (148) Khochfar, S., & Silk, J. 2011, MNRAS, 410, L42
- (149)
- (150) Knudsen, K. K., van der Werf, P. P., & Kneib, J.-P. 2008, MNRAS, 384, 1611
- (151)
- (152) Komatsu, E., et al. 2011, ApJS, 192, 18
- (153)
- (154) Lacey, C. G., Baugh, C. M., Frenk, C. S., Benson, A. J., Orsi, A., Silva, L., Granato, G. L., & Bressan, A. 2010, MNRAS, 405, 2
- (155)
- (156) Lagache, G., Abergel, A., Boulanger, F., Désert, F. X., & Puget, J.-L. 1999, A&A, 344, 322
- (157)
- (158) Lapi, A., Kawakatu, N., Bosnjak, Z., Celotti, A., Bressan, A., Granato, G. L., & Danese, L. 2008, MNRAS, 386, 608
- (159)
- (160) Lapi, A., Shankar, F., Mao, J., Granato, G. L., Silva, L., De Zotti, G., & Danese, L. 2006, ApJ, 650, 42
- (161)
- (162) Lutz, D., et al. 2010, ApJ, 712, 1287
- (163)
- (164) Maddox, S. J., et al. 2010, A&A, 518, L11
- (165)
- (166) Madgwick, D. S., et al. 2003, MNRAS, 344, 847
- (167)
- (168) Magliocchetti, M., Silva, L., Lapi, A., de Zotti, G., Granato, G. L., Fadda, D., & Danese, L. 2007, MNRAS, 375, 1121
- (169)
- (170) Magorrian, J., et al. 1998, AJ, 115, 2285
- (171)
- (172) Mancone, C. L., González, A. H., Brodwin, M., Stanford, S. A., Eisenhardt, P. R. M., Stern, D., & Jones, C. 2010, ApJ, 720, 284
- (173)
- (174) Mao, J., Lapi, A., Granato, G. L., de Zotti, G., & Danese, L. 2007, ApJ, 667, 655
- (175)
- (176) Maraston, C., Pforr, J., Renzini, A., Daddi, E., Dickinson, M., Cimatti, A., & Tonini, C. 2010, MNRAS, 407, 830
- (177)
- (178) Marconi, A., & Hunt, L. K. 2003, ApJ, 589, L21
- (179)
- (180) Marconi, A., Risaliti, G., Gilli, R., Hunt, L. K., Maiolino, R., & Salvati, M. 2004, MNRAS, 351, 169
- (181)
- (182) Matarrese, S., Coles, P., Lucchin, F., & Moscardini, L. 1997, MNRAS, 286, 115
- (183)
- (184) Matsuura, M., et al. 2011, arXiv:1107.1477
- (185)
- (186) Matteucci, F. 1994, A&A, 288, 57
- (187)
- (188) McLure, R. J., Jarvis, M. J., Targett, T. A., Dunlop, J. S., & Best, P. N. 2006 NewAR, 50, 782
- (189)
- (190) Moster, B. P., Somerville, R. S., Maulbetsch, C., van den Bosch, F. C., Macciò, A. V., Naab, T., & Oser, L. 2010, ApJ, 710, 903
- (191)
- (192) Nair, P. B., van den Bergh, S., & Abraham, R. G. 2010, ApJ, 715, 606
- (193)
- (194) Negrello, M., Perrotta, F., González-Nuevo, J., Silva, L., de Zotti, G., Granato, G. L., Baccigalupi, C., & Danese, L. 2007, MNRAS, 377, 1557
- (195)
- (196) Negrello, M., et al. 2010, Science, 330, 800
- (197)
- (198) Oliver, S. J., et al. 2010, A&A, 518, L21
- (199)
- (200) Page, M. J., & Carrera, F. J. 2000, MNRAS, 311, 433
- (201)
- (202) Pannella, M., et al. 2009, ApJ, 701, 787
- (203)
- (204) Pascale, E., et al. 2011, MNRAS, 415, 911
- (205)
- (206) Peebles, P. J. E., & Nusser, A. 2010, Nature, 465, 565
- (207)
- (208) Peng, C.Y., et al. 2006, ApJ, 649, 616
- (209)
- (210) Perera, T. A., et al. 2008, MNRAS, 391, 1227
- (211)
- (212) Perrotta, F., Magliocchetti, M., Baccigalupi, C., Bartelmann, M., De Zotti, G., Granato, G. L., Silva, L., & Danese, L. 2003, MNRAS, 338, 623
- (213)
- (214) Pilbratt, G. L., et al. 2010, A&A, 518, L1
- (215)
- (216) Planck Collaboration, et al. 2011, A&A, in press (preprint arXiv:1101.2028)
- (217)
- (218) Poglitsch, A., et al. 2010, A&A, 518, L2
- (219)
- (220) Reddy, N. A., & Steidel, C. C. 2009, ApJ, 692, 778
- (221)
- (222) Renzini, A. 2006, ARA&A, 44, 141
- (223)
- (224) Rigby, E. E., et al. 2011, MNRAS, in press (preprint arXiv:1010.5787)
- (225)
- (226) Rodighiero, G., et al. 2010, A&A, 518, L25
- (227)
- (228) Rogers, B., Ferreras, I., Pasquali, A., Bernardi, M., Lahav, O., & Kaviraj, S. 2010, MNRAS, 405, 329
- (229)
- (230) Rowan-Robinson, M., et al. 2005, AJ, 129, 1183
- (231)
- (232) Rowan-Robinson, M., et al. 2010, MNRAS, 409, 2
- (233)
- (234) Salpeter, E.E. 1955, ApJ, 121, 161
- (235)
- (236) Sasaki, S. 1994, PASJ, 46, 427
- (237)
- (238) Sawicki, M., & Thompson, D. 2005, Starbursts: From 30 Doradus to Lyman Break Galaxies, 329, 315
- (239)
- (240) Schurer, A., et al. 2009, MNRAS, 394, 2001
- (241)
- (242) Scott, K. S., et al. 2010, MNRAS, 405, 2260
- (243)
- (244) Serjeant, S., & Harrison, D. 2005, MNRAS, 356, 192
- (245)
- (246) Shankar, F., Lapi, A., Salucci, P., De Zotti, G., & Danese, L. 2006, ApJ, 643, 14
- (247)
- (248) Shankar, F., Salucci, P., Granato, G. L., De Zotti, G., & Danese, L. 2004, MNRAS, 354, 1020
- (249)
- (250) Sheth, R. K., & Tormen, G. 1999, MNRAS, 308, 119
- (251)
- (252) Sheth, R. K., & Tormen, G. 2002, MNRAS, 329, 61
- (253)
- (254) Silva, L., et al. 2011, MNRAS, 410, 2043
- (255)
- (256) Silva, L., Granato, G. L., Bressan, A., & Danese, L. 1998, ApJ, 509, 103
- (257)
- (258) Smith, D. J. B., et al. 2011a, MNRAS, in press (preprint arXiv:1007.5260)
- (259)
- (260) Smith, D. J. B., et al. 2011b, preprint
- (261)
- (262) Somerville, R. S., Hopkins, P. F., Cox, T. J., Robertson, B. E., & Hernquist, L. 2008, MNRAS, 391, 481
- (263)
- (264) Springel, V., Frenk, C. S., & White, S. D. M. 2006, Nature, 440, 1137
- (265)
- (266) Swinbank, A. M., et al. 2010, Nature, 464, 733
- (267)
- (268) Thomas, D., Greggio, L., & Bender, R. 1999, MNRAS, 302, 537
- (269)
- (270) Thomas, D., & Kauffmann, G. 1999, in Spectrophotometric Dating of Stars and Galaxies, 192, 261
- (271)
- (272) Thomas, D., Maraston, C., Schawinski, K., Sarzi, M., & Silk, J. 2010, MNRAS, 404, 1775
- (273)
- (274) Vaccari, M., et al. 2010, A&A, 518, L20
- (275)
- (276) van Kampen, E., et al. 2011, preprint
- (277)
- (278) Vieira, J. D., et al. 2010, ApJ, 719, 763
- (279)
- (280) Viero, M. P., et al. 2009, ApJ, 707, 1766
- (281)
- (282) Wang, J., et al. 2011, MNRAS, 413, 1373
- (283)
- (284) York, D. G., et al. 2000, AJ, 120, 1579
- (285)
- (286) Zemcov, M., Blain, A., Halpern, M., & Levenson, L. 2010, ApJ, 721, 424
- (287)
- (288) Zhao, D. H., Mo, H. J., Jing, Y. P., & Börner, G. 2003, MNRAS, 339, 12
- (289)
| log [W Hz-1] | [Mpc-3 dex-1] | |||||||
|---|---|---|---|---|---|---|---|---|
Note. — Based on our reference sample (mJy, , and no optical identifications). Redshift estimates relying on the SMM J2135-0102 SED. Only statistical uncertainties are quoted; an additional uncertainty of related to the redshift estimate has to be summed in quadrature.
| log [W Hz-1] | [Mpc-3 dex-1] | |||||||
|---|---|---|---|---|---|---|---|---|
Note. — See note to Table 1.