Towards quantitative accuracy in first-principles transport calculations: The GW method applied to alkane/gold junctions
Abstract
The calculation of electronic conductance of nano-scale junctions from first principles is a long standing problem in molecular electronics. Here we demonstrate excellent agreement with experiments for the transport properties of the gold/alkanediamine benchmark system when electron-electron interactions are described using the many-body GW approximation. The main difference from standard density functional theory (DFT) calculations is a significant reduction of the contact conductance, , due an improved alignment of the molecular energy levels with the metal Fermi energy. The molecular orbitals involved in the tunneling process comprise states delocalized over the carbon backbone and states localized on the amine end groups. We find that dynamical screening effects renormalize the two types of states in qualitatively different ways when the molecule is inserted in the junction. Consequently, the GW transport results cannot be mimicked by DFT calculations employing a simple scissors operator.
I Introduction
The conductance of a molecule sandwiched between metallic electrodes is sensitive to the chemical and electronic structure of the molecule as well as the detailed atomic structure of the metal-molecule contact. Variations in the contact geometry beyond experimental control lead to an undesired spread in measured conductance properties. For the most commonly used thiol anchoring group, these effects are rather pronounced due to the many possible contact geometries resulting from the large strength of the Au-S interaction. Amine groups have been shown to produce more well defined transport properties Venkataraman et al. (2006) which can be understood from the relatively weak Au-NH2 bond leading to larger structural selectivity Kristensen et al. (2008).
Even for a given junction geometry, a quantitatively accurate description of electron transport from first principles remains a formidable task. Numerous studies based on density functional theory (DFT) have shown a significant overestimation of conductance relative to experimental values Tomfohr and Sankey (2002); Sen and Kaun (2010); Kaun and Guo (2003); Muller (2006); Paulsson et al. (2009); Wohlthat et al. (2008); McDermott et al. (2009); Sheng et al. (2009); Li et al. (2008); Hybertsen et al. (2008); Quek et al. (2007); Mowbray et al. (2008) (an exception to this trend occurs for small molecules, like H2 Smit et al. (2002); Djukic et al. (2005) and CO Untiedt et al. (2004); Strange et al. (2006), which chemisorp strongly to the electrodes resulting in resonant transport through broad, partially filled resonances). The inability of DFT to describe off-resonant tunneling in the simplest molecular junctions limits the predictive power of the DFT-based approach to qualitative trends. It is now broadly accepted that the failure of DFT is mainly due to its wrong description of the molecular energy levels. Indeed, physically motivated correction schemes have shown that much improved agreement with experiments can be obtained after shifting the DFT molecular energy levels Quek et al. (2007); Mowbray et al. (2008). Such corrections are supposed to remove the self-interaction errors inherent in standard DFT exchange-correlation (xc) functions and account for image charge effects induced by the metal contacts. The drawback of the approach is that is assumes a weak coupling between molecular orbitals and metal states and treats the image plane position as a free parameter.
The (self-consistent) GW approximation Hedin (1965), which is rooted in many-body perturbation theory, was recently found to yield a considerable improvement over DFT for the conductance of gold/benzenediamine junctions Strange et al. (2011). Physically, the GW approximation corresponds to Hartree-Fock theory with the bare Coulomb interaction replaced by a dynamically screened Coulomb interaction . In contrast to standard DFT, the GW approximation is self-interaction free and includes image charge effects due to the metal contacts through the correlation part of the self-energyNeaton et al. (2006); Garcia-Lastra et al. (2009); Thygesen and Rubio (2009). As a consequence, it provides quantitatively accurate predictions of energy gaps in systems with highly diverse screening properties ranging from isolated molecules Rostgaard et al. (2010); Blase et al. (2011) over semiconductors Hybertsen and Louie (1986), to metals Holm and von Barth (1998). This property becomes particularly important for a metal-molecule interface where the electronic structure changes from insulating to metallic over a few Angstrom.
In this work we use the GW approximation to study the role of exchange-correlation effects for the energy level alignment and electron transport in short alkane chains coupled to gold electrodes via amine linker groups. The gold/alkane junction is a benchmark system for molecular charge transport and have been exhaustively investigated experimentally Xu and Tao (2003); Engelkes et al. (2004); Chen et al. (2006); Venkataraman et al. (2006); Park et al. (2007); Hybertsen et al. (2008); Huang et al. (2007); Widawsky et al. (2009); Kamenetska et al. (2009); Song et al. (2007); Kim et al. (2011); Martin et al. (2008); Nichols et al. (2010); Haiss et al. (2009). We focus here on the amine-linked alkanes to avoid the uncertainties related to the gold-thiol contact geometry which is presently under debate Cossaro et al. (2008); Wang et al. (2009); Voznyy et al. (2009); Jadzinsky et al. (2007); Walter et al. (2008); Strange et al. (2010). We note that very recently it was shown that alkanes can be bound directly to gold electrodes without the use of anchoring groups Cheng et al. (2011).
The transport mechanism in (short) saturated molecular wires is coherent tunneling via molecular orbitals with energy far from the Fermi energy. The conductance versus chain length () thus follows an exponential law of the form
| (1) |
Recent experimentally reported values for the decay constant of alkanediamine/gold junctions are in the range 0.9-1.0 per C atom Venkataraman et al. (2006); Hybertsen et al. (2008); Park et al. (2007), but earlier measurements also showed values around 0.8 Chen et al. (2006). Although previous studies based on DFT have yielded values within the experimental range, the contact conductance, , is typically overestimated by around an order of magnitude Tomfohr and Sankey (2002); Sen and Kaun (2010); Kaun and Guo (2003); Muller (2006); Paulsson et al. (2009); Wohlthat et al. (2008); McDermott et al. (2009); Sheng et al. (2009). By comparing DFT and GW calculations for -alkanediamine molecules with we show that the wrong values are a result of incorrect level alignment in the DFT calculations. Indeed, GW yields a in close agreement with experimental values. We find a pronounced orbital and length dependence of the quasiparticle (QP) corrections to the DFT energies resulting from the different shape and localization of the molecular orbitals. The QP corrections range from to eV and can be qualitatively explained from a classical image charge model.
II Method
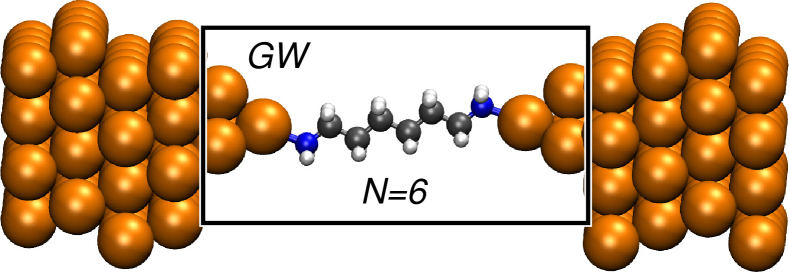
The junction geometries were optimized using the real space projector augmented wave method GPAW Enkovaara et al. (2010); Larsen et al. (2009) with a grid spacing of 0.2 Å and the PBE functional for exchange and correlation (xc) Perdew et al. (1996). The molecules were attached to Au(111) surfaces, modeled by an eight layer thick slab via small four atom tips as shown in Figure 1. The surface Brillouin zone was sampled on a Monkhorst pack -point grid, and the structures including molecule, Au tips, and outermost Au surface layers were relaxed until the residual force was below 0.03 eV/Å. We have considered -alkanediamine junctions with , 4 and 6. Key structural parameters can be found here not (We use the equilibrium PBE lattice constant of 4.18 Å for Au. The distance between the second outermost Au(111). For calculations of the molecules in the gas-phase we include 16 Å of vacuum between molecules in repeated super cells.
All transport calculations where performed using the method described in detail in Ref. Strange et al. (2011). In brief we employ a basis set of numerical atomic orbitals corresponding to double-zeta plus polarization (DZP) for the Au atoms and double-zeta (DZ) for the atoms of the molecules. We use rather diffuse basis functions with a confinement energy shift of 0.01 eV. This ensures that the calculated work function of Au(111) and the Kohn-Sham energy levels of the molecular junction are within 0.1 eV of those obtained from accurate grid calculations Strange et al. (2011). The transmission function is obtained from the Meir-Wingreen transmission formula Meir and Wingree (1992); Thygesen (2006)
| (2) |
The retarded Green function of the extended molecule is calculated from
| (3) |
Here , , and are the overlap matrix, Kohn-Sham Hamiltonian and the local xc-potential in the atomic orbital basis, respectively. is a positive infinitesimal.
The lead self-energy, , incorporates the coupling to the left and right electrodes and is obtained using standard techniques Thygesen and Jacobsen (2005). The term gives the change in the Hartree potential relative to the DFT Hartree potential already contained in . Finally, the last term is the many-body xc self-energy which in this work is either the bare exchange potential, , corresponding to Hartree-Fock or the GW self-energy. As indicated both the Hartree potential and the xc self-energy depend on the Green function. The latter is evaluated fully self-consistently using a simple linear mixing of the Green functions. The GW self-energy is evaluated for the extended molecule (indicated by the box in Figure 1). However, only the part corresponding to the molecule is used while the remaining part is replaced by the DFT xc-potential. This is done to include non-local correlation (image charge) effects from the electrodes in the GW self-energy of the molecule while preserving a consistent description of all metal atoms at the DFT level. We have verified that the calculations are converged with respect to the size of the extended molecules, see Ref. Strange et al. (2011) for more details. We represent all energy dependent quantities in Equation (3) on a large energy grid ranging from eV to eV with an energy grid spacing of 0.01 eV.
III Results and discussion
III.1 Energy level alignment
The alignment of the molecular energy levels relative to the electrode Fermi level is of great importance for the transport properties of molecular junctions and seems to be the dominating effect at low bias voltage. At higher bias voltages many body calculations on small model systems suggest that electron correlations induce additional shifting and broadening of the molecular levels which can also affect the transport properties Thygesen (2008). Here we focus on the low bias regime and postpone the finite bias effects to a later study.
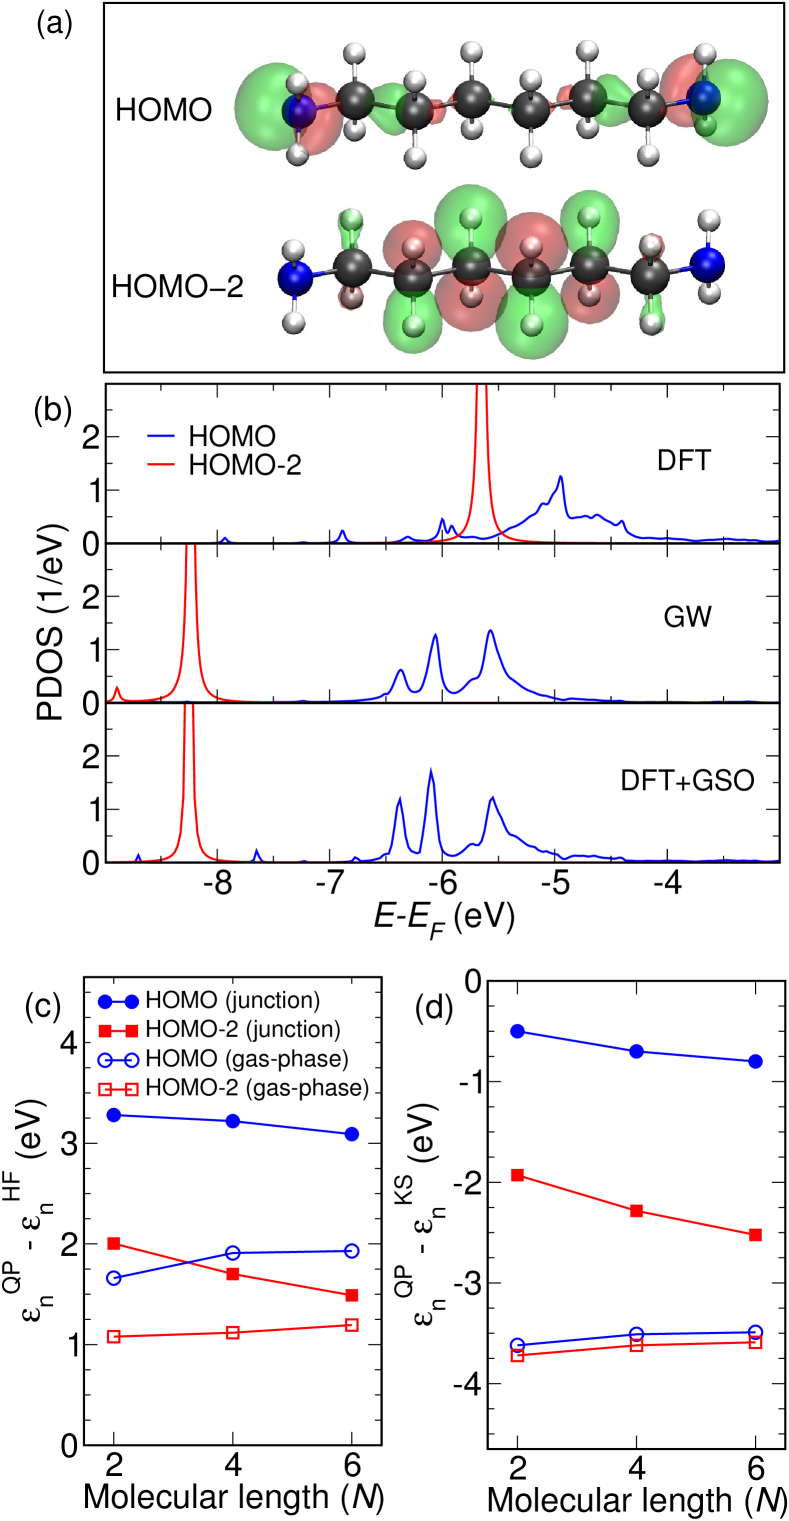
The molecular orbitals (MOs) of the alkanediamine chains comprise states which are delocalized over the carbon backbone and states which are localized on the NH2 end group. We shall consider the highest occupied molecular orbital (HOMO) and HOMO-2 as representatives for the two classes of states, see Figure 2(a). We note that the HOMO-1 is similar to the HOMO with slightly lower energy given by the coupling of the two end groups across the wire. In Table 1 and 2 we list the energy of the HOMO and HOMO-2 calculated with DFT-PBE, Hartree-Fock (HF), and GW for the molecules in the gas-phase and junction, respectively.
| Method | Orbital | |||
|---|---|---|---|---|
| DFT-PBE | HOMO | -4.9 | -5.1 | -5.1 |
| HOMO-2 | -8.5 | -8.2 | -8.0 | |
| HF | HOMO | -10.2 | -10.5 | -10.5 |
| HOMO-2 | -13.3 | -12.9 | -12.8 | |
| GW | HOMO | -8.5 | -8.6 | -8.6 |
| HOMO-2 | -12.2 | -11.8 | -11.6 |
| Method | Orbital | |||
|---|---|---|---|---|
| DFT-PBE | HOMO | -4.3 | -4.2 | -4.4 |
| HOMO-2 | -6.5 | -5.9 | -5.7 | |
| HF | HOMO | -8.1 | -8.1 | -8.3 |
| HOMO-2 | -10.4 | -9.9 | -9.7 | |
| GW | HOMO | -4.8 | -4.9 | -5.2 |
| HOMO-2 | -8.4 | -8.2 | -8.2 |
In the gas-phase, all three methods predict the HOMO energy to be almost independent of molecular length. This is clearly due to its end group localized character. In contrast, the energy of the HOMO-2 level shifts upward in energy as the molecular length increases. This reflects its extended nature and can be interpreted as a band discretization effect. To the best of our knowledge no experimental results exists for the ionization potential of alkanediamine molecules. However, for the closely related butane molecule ( alkane with CH3 end groups) we obtain a GW calculated HOMO energy of eV in very good agreement with the experimental ionization potential of eV exp . In comparison, the DFT-PBE HOMO energy is severely underestimated at eV. This finding agrees well with previous studies on a larger range of small molecules Rostgaard et al. (2010); Strange et al. (2011); Blase et al. (2011).
In the junction, the molecular orbitals, , have been obtained by diagonalizing the DFT Hamiltonian corresponding to the molecule. The projected density of states (PDOS) of such a state is then given by the spectral function, , where is the appropriate Green function (calculated with DFT, HF, or GW). The level position is defined as the first moment of the PDOS. Figure 2(b) shows the PDOS for the HOMO and HOMO-2 for the -alkanediamine junction as calculated with DFT-PBE (upper panel) and GW (middle panel). The lower panel shows the PDOS obtained from a DFT calculation where the molecular levels have been shifted to match the GW levels, i.e. after adding to the Kohn-Sham Hamiltonian a generalized scissors operator of the form, . Here denote the QP energy obtained from the GW calculation. We see that the main features of the GW spectral function can be well reproduced by the shifted DFT Hamiltonian although small differences remain. A similar conclusion was reached in Ref. Strange et al. (2011) for a gold/benzenediamine junction.
The molecular orbital energies from a GW calculation include the dynamical response of the electron system to an added or removed electron through the correlation part of the self-energy. In general correlations tend to shift the filled levels up and the empty levels down relative to the bare Hartree-Fock energies. This is because the inclusion of screening reduces the energy cost of removing/adding electrons to the molecule. When a molecule is brought into contact with a metallic junction its environment changes from insulating to metallic. This implies extra screening of an added or removed electron which will cause the filled levels to shift upwards and the empty levels to shift downwards even more than for the isolated molecules, i.e the gap will shrink relative to its gas-phase value. It has been shown previously that DFT in (semi)local approximations and Hartree-Fock completely misses this important effect Neaton et al. (2006); Garcia-Lastra et al. (2009); Thygesen and Rubio (2009).
In Figure 2(c) and (d) we show the QP corrections to the HF and DFT Kohn-Sham energy levels as function of molecular length. The results for the HOMO and the HOMO-2 are denoted by circles and squares. We first notice that the QP corrections are very significant with absolute values reaching almost 4 eV with a pronounced orbital and length dependence. The Hartree-Fock QP corrections are all positive showing that HF places the occupied levels lower than predicted by GW. This is in contrast to the corrections to the DFT levels which are all negative in agreement with the well known underestimation of ionization potentials by DFT. In contrast to Hartree-Fock the Kohn-Sham QP corrections are smaller for molecules in the junction rather than in the gas-phase. In fact the DFT HOMO level position is relatively close the GW level position and only lie 0.5-0.8 eV higher. The fact that the DFT-PBE description of molecular energy levels is much better in the junction than in the gas-phase agrees with previous findings Garcia-Lastra et al. (2009); Strange et al. (2011); Dell’Angela et al. (2010), and can be explained from the origin of the PBE functional in the homogenous electron gas Rohlfing (2010).
It is instructive to consider the shift in the molecular energy levels due to correlation effects coming from the metal electrodes. In simple terms this corresponds to the shift induced by image charge effects. In order to isolate the part of the correlation energy originating from the metallic electrodes we define the quantity,
| (4) |
which is shown in Figure 3.
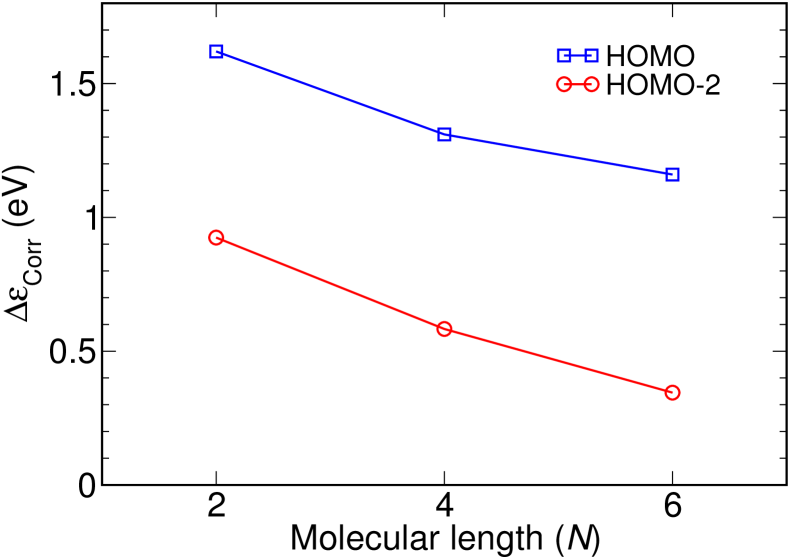
The result can be understood qualitatively by considering a classical model to account for the screening effect of the electrodes. Classically a charge distribution between two perfect metals will experience an image potential. For example, the image potential for a point charge halfway between two metal surfaces separated by a distance is (eV Å) Chen (1993). This predicts a dependence for the image charge effect. The Au tip atoms in our simulations are about Å apart for the -alkadiamine junction giving a rough estimate of eV for the image charge effect in qualitative agreement with the GW calculations. The HOMO experiences a larger image charge effect than the HOMO-2 which can be understood from the fact that its charge density is located closer to the metallic surfaces. In the limit of an infinitely long wire the HOMO-2 will be spread out over the entire molecule and the image charge effect should vanish. On the other hand in this limit the HOMO will stay localized near the surface and therefore approach a non-zero constant image charge potential. If we model the HOMO charge density as a point charge of half an electron on each of the amine groups we can estimate this limiting constant to be (eV Å), where is the distance to the nearest metal surface. Taking to be around the Au-N bond length (2.34 Å) gives a limiting value estimate of eV. Again, this seems to be in qualitative agreement with our GW findings.
Finally, we discuss the coverage dependence of the energy level position for alkanediamine-Au junctions. It was shown in Ref. Wang et al. (2008) that the DFT level position for amine linked molecules is strongly dependent on coverage. In contrast to the screening (image charge) effects discussed above, which appear in the correlation part of the self-energy, this is a purely electrostatic effect resulting from the localized surface dipoles formed at the Au-NH2 bond. To investigate the dependence of the energy levels on coverage for our junctions we have performed DFT calculations for a range of transverse supercell dimensions for the geometry shown in Figure 1. In Figure 4 we show the PDOS of a methylene unit in the central part of the molecule for transverse super cells with to surface atoms.
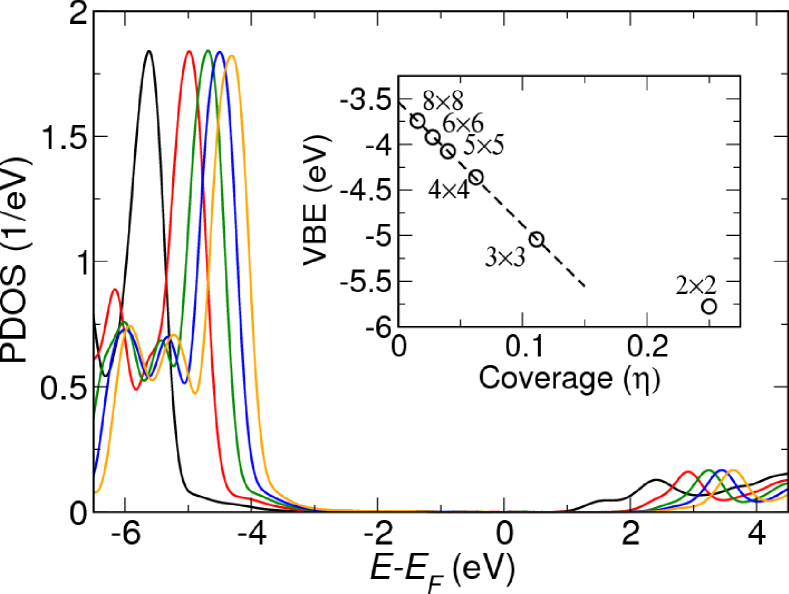
The PDOS peaks and band edge is shifting up in energy as the transverse supercell size is increased in agreement with the results of Ref. Wang et al. (2008). The inset shows the energy shift obtained from reading off the shift in the PDOS as a function of coverage defined as , where is the number of surface atoms. For a supercell dimension of size and larger, the shift is seen to be directly proportional with the coverage as expected for a two dimensional array of dipoles Natan et al. (2007). This allow us to to extract the electrostatic shift corresponding to the single molecule limit. We find that the electrostatic energy shift when going from a supercell to the single molecule limit is indeed significant with a value around 1 eV.
III.2 Transport calculations
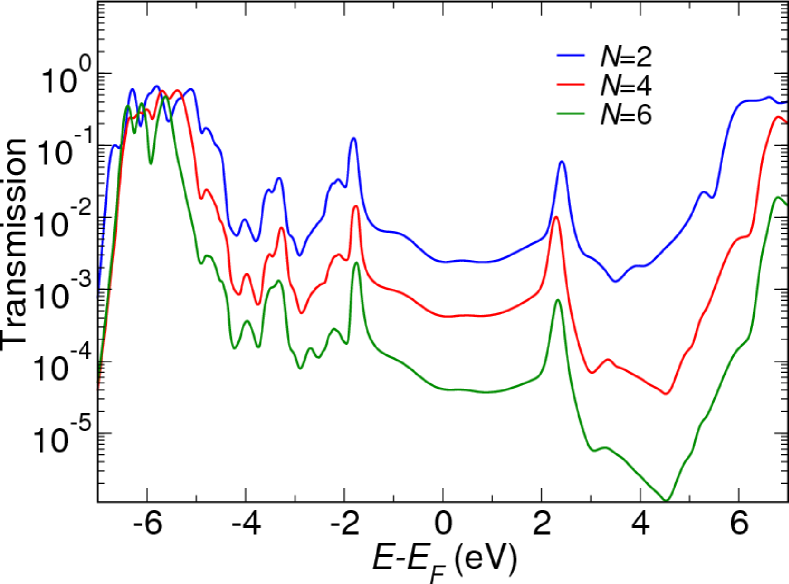
The transmission function of the 2, 4 -and 6-alkanediamine junction geometries were calculated using the GW and the PBE xc potential as approximations for in Eq. (3). To include the coverage dependence we have simulated the low coverage limit by performing calculations using the junction (corresponding to ) with all molecular levels shifted up by 1 eV using a simple scissors operator self-energy.
The transmission function calculated using GW is shown in Figure 5 on a logarithmic scale. The transmission functions for different molecular lengths have very similar shapes in the important region near the Fermi level , however, the magnitude is increasingly suppressed as function of molecular length. The similarity of the transmission functions may at first seem surprising since we have shown that the position of the molecular energy levels show some length dependence. In particular the HOMO level was found to decrease in energy by 0.5 eV when increases from 2 to 6 (see Table 2). This shift is indeed visible in transmission function in the range -4.0 to -6.0 eV where the HOMO is located. On the other hand the feautures in the transmission function around the Fermi level are determined by the local electronic structure of the Au tips .
The zero bias conductance is obtained from the transmission function at the Fermi level, where is the unit of quantum conductance. The zero bias conductance is plotted in Figure 6 as function of molecular length. We have also included the DFT results for comparison. The dashed lines show the best fits to the exponential form .
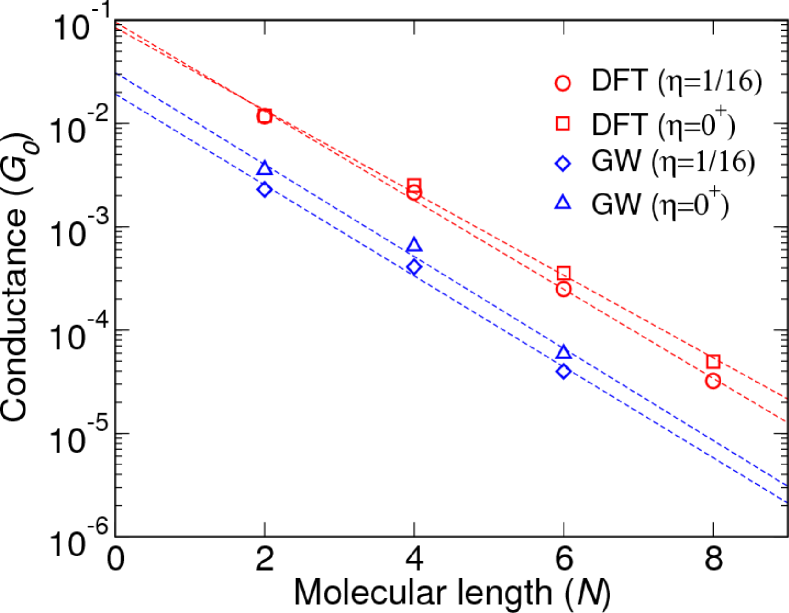
The values for and corresponding to the single-molecule limit () and Au atoms per molecule () are reported in Table 3 together with experimental values.
| DFT | GW | Exp. | |||
|---|---|---|---|---|---|
| 1/16 | 0 | 0 | |||
| 0.11 | 0.10 | 0.02 | 0.04 | , | |
| 0.99 | 0.92 | 1.01 | 1.02 | 0.97111Ref. Hybertsen et al. (2008), 0.93222Ref. Park et al. (2007), 0.91333Ref. Venkataraman et al. (2006) |
The rather weak effect of coverage on the conduction properties is in agreement with the findings in Ref. Feng et al. (2009) where a 4-alkanediamine Au junction with and surfaces was considered. Our DFT results are in reasonable agreement with previous DFT studies showing decay factors in the range and conductance resistances in the range Wohlthat et al. (2008); Sheng et al. (2009); McDermott et al. (2009). While the values obtained with GW are rather close to the DFT calculated ones, the contact conductance is reduced by a factor of depending on the coverage. This is a direct result of the molecular levels lying further away from (by 0.5-2.5 eV, see Figure 2(d)) in GW compared to DFT.
IV Conclusion
We have unraveled the important role of exchange-correlation effects for the energy level alignment and low-bias conductance of gold/alkanediamine molecular junctions. Based on many-body GW calculations we found that the origin of the overestimation of the contact conductance, , by standard DFT is due to wrong energy level alignment in the junction. The absence of self-interaction and the inclusion of image charge screening effect through the GW self-energy improves the desription of the energy levels and yield values for and the decay constant in good agreement with experiments. The quasiparticle corrections to the DFT energy levels showed a significant orbital dependence ranging from eV to eV due to the different shape and localization of the molecular orbitals. Our results demonstrate that quantitatively accurate calculations of conductance from first-principles are feasible, although computationally demanding.
V Acknowledgments
The authors acknowledge support from the Lundbeck Foundation’s Center for Atomic-scale Materials Design (CAMD) and The Danish Center for Scientific Computing.
References
- Venkataraman et al. (2006) L. Venkataraman, J. Klare, I. Tam, C. Nuckolls, M. Hybertsen, and M. Steigerwald, Nano Lett. 6, 458 (2006).
- Kristensen et al. (2008) I. S. Kristensen, D. J. Mowbray, K. S. Thygesen, and K. W. Jacobsen, J. of Phys.: Condens. Matter 20, 374101 (2008).
- Tomfohr and Sankey (2002) J. Tomfohr and O. Sankey, Phys. Rev. B 65, 245105 (2002).
- Sen and Kaun (2010) A. Sen and C.-C. Kaun, ACS Nano 4, 6404 (2010).
- Kaun and Guo (2003) C. Kaun and H. Guo, Nano Lett. 3, 1521 (2003).
- Muller (2006) K. Muller, Phys. Rev. B 73, 045403 (2006).
- Paulsson et al. (2009) M. Paulsson, C. Krag, T. Frederiksen, and M. Brandbyge, Nano Lett. 9, 117 (2009).
- Wohlthat et al. (2008) S. Wohlthat, F. Pauly, and J. R. Reimers, Chem. Phys. Lett. 454, 284 (2008).
- McDermott et al. (2009) S. McDermott, C. B. George, G. Fagas, J. C. Greer, and M. A. Ratner, J. Phys. Chem. C 113, 744 (2009).
- Sheng et al. (2009) W. Sheng, Z. Y. Li, Z. Y. Ning, Z. H. Zhang, Z. Q. Yang, and H. Guo, J. Chem. Phys. 131, 244712 (2009).
- Li et al. (2008) C. Li, I. Pobelov, T. Wandlowski, A. Bagrets, A. Arnold, and F. Evers, J. Am. Chem. Soc. 130, 318 (2008).
- Hybertsen et al. (2008) M. S. Hybertsen, L. Venkataraman, J. E. Klare, A. CWhalley, M. L. Steigerwald, and C. Nuckolls, J. Phys.:Condens. Matter 20, 374115 (2008).
- Quek et al. (2007) S. Y. Quek, L. Venkataraman, H. J. Choi, S. G. Louie, M. S. Hybertsen, and J. B. Neaton, Nano Lett. 7, 3477 (2007).
- Mowbray et al. (2008) D. J. Mowbray, G. Jones, and K. S. Thygesen, J. Chem. Phys. 128, 111103 (2008).
- Smit et al. (2002) R. Smit, Y. Noat, C. Untiedt, N. Lang, M. van Hemert, and J. van Ruitenbeek, Nature (London) 419, 906 (2002).
- Djukic et al. (2005) D. Djukic, K. S. Thygesen, C. Untiedt, R. Smit, K. Jacobsen, and J. van Ruitenbeek, Phys. Rev. B 71, 161402 (2005).
- Untiedt et al. (2004) C. Untiedt, D. Dekker, D. Djukic, and J. van Ruitenbeek, Phys. Rev. B 69, 081401 (2004).
- Strange et al. (2006) M. Strange, K. S. Thygesen, and K. W. Jacobsen, Phys. Rev. B 73, 125424 (2006).
- Hedin (1965) L. Hedin, Phys. Rev. 139, A796 (1965).
- Strange et al. (2011) M. Strange, C. Rostgaard, H. Hakkinen, and K. S. Thygesen, Phys. Rev. B 83, 115108 (2011).
- Neaton et al. (2006) J. B. Neaton, M. S. Hybertsen, and S. G. Louie, Phys. Rev. Lett. 97, 216405 (2006).
- Garcia-Lastra et al. (2009) J. M. Garcia-Lastra, C. Rostgaard, A. Rubio, and K. S. Thygesen, Phys. Rev. B 80, 245427 (2009).
- Thygesen and Rubio (2009) K. S. Thygesen and A. Rubio, Phys. Rev. Lett. 102, 046802 (2009).
- Rostgaard et al. (2010) C. Rostgaard, K. W. Jacobsen, and K. S. Thygesen, Phys. Rev. B 81, 085103 (2010).
- Blase et al. (2011) X. Blase, C. Attaccalite, and V. Olevano, Phys. Rev. B 83, 115103 (2011).
- Hybertsen and Louie (1986) M. Hybertsen and S. Louie, Phys. Rev. B 34, 5390 (1986).
- Holm and von Barth (1998) B. Holm and U. von Barth, Phys. Rev. B 57, 2108 (1998).
- Xu and Tao (2003) B. Xu and N. Tao, Science 301, 1221 (2003).
- Engelkes et al. (2004) V. Engelkes, J. Beebe, and C. Frisbie, J. Am. Chem. Soc. 126, 14287 (2004).
- Chen et al. (2006) F. Chen, X. Li, J. Hihath, Z. Huang, and N. Tao, J. Am. Chem. Soc. 128, 15874 (2006).
- Park et al. (2007) Y. S. Park, A. C. Whalley, M. Kamenetska, M. L. Steigerwald, M. S. Hybertsen, C. Nuckolls, and L. Venkataraman, J. Am. Chem. Soc. 129, 15768 (2007).
- Huang et al. (2007) Z. Huang, F. Chen, P. A. Bennett, and N. Tao, J. Am. Chem. Soc. 129, 13225 (2007).
- Widawsky et al. (2009) J. R. Widawsky, M. Kamenetska, J. Klare, C. Nuckolls, M. L. Steigerwald, M. S. Hybertsen, and L. Venkataraman, Nanotechnology 20, 434009 (2009).
- Kamenetska et al. (2009) M. Kamenetska, M. koentopp, A. C. Whalley, Y. S. Park, M. L. Steigerwald, C. Nuckolls, M. S. Hybertsen, and L. Venkataraman, Phys. Rev. Lett. 102, 126803 (2009).
- Song et al. (2007) H. Song, T. Lee, N.-J. Choi, and H. Lee, Appl. Phys. Lett. 91, 253116 (2007).
- Kim et al. (2011) Y. Kim, T. J. Hellmuth, M. Buerkle, F. Pauly, and E. Scheer, ACS Nano 5, 4104 (2011).
- Martin et al. (2008) C. A. Martin, D. Ding, H. S. J. van der Zant, and J. M. van Ruitenbeek, New J. Phys. 10, 065008 (2008).
- Nichols et al. (2010) R. J. Nichols, W. Haiss, S. J. Higgins, E. Leary, S. Martin, and D. Bethell, Phys. Chem. Chem. Phys. 12, 2801 (2010).
- Haiss et al. (2009) W. Haiss, S. Martin, L. E. Scullion, L. Bouffier, S. J. Higgins, and R. J. Nichols, Phys. Chem. Chem. Phys. 11, 10831 (2009).
- Cossaro et al. (2008) A. Cossaro, R. Mazzarello, R. Rousseau, L. Casalis, A. Verdini, A. Kohlmeyer, L. Floreano, S. Scandolo, A. Morgante, M. L. Klein, et al., Science 321, 943 (2008).
- Wang et al. (2009) Y. Wang, Q. Chi, N. S. Hush, J. R. Reimers, J. Zhang, and J. Ulstrup, J. Phys. Chem. C 113, 19601 (2009).
- Voznyy et al. (2009) O. Voznyy, J. J. Dubowski, J. Yates, J. T., and P. Maksymovych, J. Am. Chem. Soc. 131, 12989 (2009).
- Jadzinsky et al. (2007) P. D. Jadzinsky, G. Calero, C. J. Ackerson, D. A. Bushnell, and R. D. Kornberg, Science 318, 430 (2007).
- Walter et al. (2008) M. Walter, J. Akola, O. Lopez-Acevedo, P. D. Jadzinsky, G. Calero, C. J. Ackerson, R. L. Whetten, H. Groenbeck, and H. Hakkinen, Proc. Natl. Acad. Sci. (USA) 105, 9157 (2008).
- Strange et al. (2010) M. Strange, O. Lopez-Acevedo, and H. Häkkinen, J. Phys. Chem. Lett. 1, 1528 (2010).
- Cheng et al. (2011) Z. L. Cheng, R. Skouta, H. Vazquez, J. R. Widawsky, S. Schneebeli, W. Chen, M. S. Hybertsen, R. Breslow, and L. Venkataraman, Nature Nanotechnology 6, 353 (2011).
- Enkovaara et al. (2010) J. Enkovaara, C. Rostgaard, J. J. Mortensen, J. Chen, M. Dulak, L. Ferrighi, J. Gavnholt, C. Glinsvad, V. Haikola, H. A. Hansen, et al., J. Phys.:Condens. Matter 22, 253202 (2010).
- Larsen et al. (2009) A. H. Larsen, M. Vanin, J. J. Mortensen, K. S. Thygesen, and K. W. Jacobsen, Phys. Rev. B 80, 195112 (2009).
- Perdew et al. (1996) J. Perdew, K. Burke, and M. Ernzerhof, Phys. Rev. Lett. 77, 3865 (1996).
- not (We use the equilibrium PBE lattice constant of 4.18 Å for Au. The distance between the second outermost Au(111) (We use the equilibrium PBE lattice constant of 4.18 Å for Au. The distance between the second outermost Au(111) atomic surface layers in the left and right electrode was fixed at 21.59 Å, 24.10 Å and 26.63 Å for the =2, 4 and 6 junction, respectively. The resulting relaxed N-Au bond length are 2.34 Å, 2.35 Å and 2.33 Å).
- Meir and Wingree (1992) Y. Meir and N. S. Wingree, Phys. Rev. Lett. 68, 2512 (1992).
- Thygesen (2006) K. S. Thygesen, Phys. Rev. B 73, 035309 (2006).
- Thygesen and Jacobsen (2005) K. S. Thygesen and K. W. Jacobsen, Chem. Phys. 319, 111 (2005).
- Thygesen (2008) K. S. Thygesen, Physical Review Letters 100, 166804 (2008).
- (55) URL http://webbook.nist.gov/cgi/cbook.cgi?ID=C106978&Units=SI&Mask=20#Ion-Energetics.
- Dell’Angela et al. (2010) M. Dell’Angela, G. Kladnik, A. Cossaro, A. Verdini, M. Kamenetska, I. Tamblyn, S. Y. Quek, J. B. Neaton, D. Cvetko, A. Morgante, et al., Nano Lett. 10, 2470 (2010).
- Rohlfing (2010) M. Rohlfing, Phys. Rev. B 82, 205127 (2010).
- Chen (1993) C. J. Chen, Introduction to Scanning Microscopy (Oxford University Press, 1993).
- Wang et al. (2008) J.-g. Wang, E. Prodan, R. Car, and A. Selloni, Phys. Rev. B 77, 245443 (2008).
- Natan et al. (2007) A. Natan, L. Kronik, H. Haick, and R. T. Tung, Adv. Mater. 19, 4103 (2007).
- Feng et al. (2009) X. Y. Feng, Z. Li, and J. Yang, J. Phys. Chem. C 113, 21911 (2009).