The Outer Disks of Early-Type Galaxies. II. Surface-Brightness Profiles of Unbarred Galaxies and Trends with Hubble Type
Abstract
We present azimuthally averaged radial profiles of -band surface brightness for a complete sample of 47 early-type, unbarred galaxies, as a complement to our previous study of early-type barred galaxies. Following very careful sky subtraction, the profiles can typically be determined down to brightness levels well below 27 mag arcsec-2 and in the best cases below 28 mag arcsec-2. We classified the profiles according to the scheme used previously for the barred sample: Type I profiles are single unbroken exponential radial declines in brightness; Type II profiles (“truncations”) have an inner shallow slope (usually exponential) which changes at a well defined break radius to a steeper exponential; and Type III profiles (“antitruncations”) have an inner exponential that is steeper, giving way to a shallower outer (usually exponential) decline.
By combining these profiles with previous studies, we can make the first clear statements about the trends of outer-disk profile types along the Hubble sequence (including both barred and unbarred galaxies), and their global frequencies. We find that Type I profiles are most frequent in early-type disks, decreasing from one-third of all S0–Sa disks to barely 10% of the latest type spirals. Conversely, Type II profiles (truncations) increase in frequency with Hubble type, from only % of S0 galaxies to % of Sd–Sm spirals. Overall, the fractions of Type I, II, and III profiles for all disk galaxies (Hubble types S0–Sm) are: 21%, 50%, and 38%, respectively; this includes galaxies (% of the total) with composite Type II+III profiles (counted twice).
Finally, we note the presence of bars in ten galaxies previously classified (optically) as “unbarred”. This suggests that % of optically unbarred galaxies are actually barred; the bars in such cases can be weak, obscured by dust, or so large as to be mistaken for the main disk of the galaxy.
Subject headings:
galaxies: structure — galaxies: elliptical and lenticular, cD — galaxies: spiral1. Introduction
The behavior of surface brightness — a proxy for stellar surface density — in the outermost regions of galaxy disks was first discussed in detail by van der Kruit (1979) and van der Kruit & Searle (1981, 1982), who argued that disks did not extend as a pure exponential to the limits of detection, but instead showed a sharp or abrupt decline in surface brightness at a radius of several scale lengths; they termed this phenomenon disk “truncation”. More recently, measurements in the CCD era, notably Pohlen et al. (2002) using deep photometry of face-on galaxies, have shown that a more accurate description of a truncation can be provided by a “double” or “broken” exponential fit to the radial light profile of the disk, in which a steeper exponential breaks away from a shallower inner exponential at a well defined galactocentric radius, the “break radius”. Measurements of samples of increasing size and representativity beyond the predominantly late-type spirals of van der Kruit’s pioneering studies have shown that there are several phenomena in play, including extended exponential profiles without detectable truncations (e.g., Weiner et al., 2001; Bland-Hawthorn et al., 2005), as well as the phenomenon of “antitruncation”, where the surface-brightness profile becomes shallower at large radii (Erwin et al., 2005; Hunter & Elmegreen, 2006).
A comprehensive classification scheme — an extension of that originally made by Freeman (1970) — has been proposed (Erwin et al., 2005; Pohlen & Trujillo, 2006; Erwin et al., 2008, hereafter Paper I), in which disk profiles are grouped according to the specific behaviour of the declining brightness in the outer disk. This global scheme includes Type I profiles, which show a single exponential profile extending to at least five scale lengths without sign of truncation; Type II profiles (“truncations”), which are truncated with a steeper outer exponential; and Type III profiles (“antitruncations”), which are antitruncated with a shallower outer profile. For a more detailed breakdown of this classification and some suggested links with physical processes we refer the reader to Pohlen & Trujillo (2006, hereafter PT06) and Paper I. Analysis of HST images has shown that all three types of profiles are present in spiral galaxies out to redshifts of (Pérez, 2004; Trujillo & Pohlen, 2005; Azzollini et al., 2008; Bakos et al., 2011).
Theoretical interest in outer-disk profiles has traditionally focused on the idea of explaining truncations, usually attributed to angular momentum limits in the collapsing protogalactic cloud (van der Kruit, 1987) or thresholds in star formation due to changes in the gas density or phase at large radii (e.g., Kennicutt, 1989; Schaye, 2004; Elmegreen & Hunter, 2006; Bigiel et al., 2010). More recent studies have examined the influence of radial diffusion driven by transient spirals (Roškar et al., 2008b) and cosmologically motivated simulations, including accretion and warps (Foyle et al., 2008; Sánchez-Blázquez et al., 2009; Martínez-Serrano et al., 2009). Younger et al. (2007) looked at minor mergers as a possible mechanism for creating antitruncations.
Paper I studied the profiles of early type barred galaxies. The present paper is directly complementary, in that we confine our attention to (nominally) unbarred galaxies meeting the same sample selection criteria. We might expect to find differences between the two subsamples, since we understand both from Paper I and from theoretical models by Debattista et al. (2006) that the presence of a Type II profile might be related to the effects of spiral or bar resonances; the nature and significance of such differences will be examined in a future paper. In any case, the sample analyzed here taken together with the sample of Paper I forms a representative sample of early type disks. Combined with the sample in PT06, which includes late type barred and unbarred spirals, it allows us to investigate trends with Hubble type and the global frequencies of disk profiles.
We begin, in Section 2, with the selection criteria for our objects, an explanation of the sources of our images and how we have processed them, and how we derived the surface brightness profiles. In Section 3 we summarize the classification scheme in sufficient detail to make the process clear to the reader. In Section 4 we discuss evidence for previously undetected bars in a number of our galaxies, and draw some conclusions about the fraction of misclassified galaxies in standard catalogs, such as RC3. In Section 5 we quantify the trends in the frequencies of profile types with varying Hubble type, the global frequencies of the different profiles, and the similarity or lack thereof between Type I profiles and the inner and outer components of the other profile types; in Section 6 we give some brief conclusions. Finally, Appendix A presents descriptive notes on the derived profiles, galaxy by galaxy.
2. The galaxy sample and the data used
2.1. Sample selection criteria
The sample presented here is the unbarred counterpart to the barred-galaxy sample presented in Paper I. The parent sample was defined as: all galaxies in the UGC (Nilson, 1973) with major axis diameter () larger than 2 arcminutes (i.e. relatively large objects), whose ratios of major to minor axis are less than 2 (i.e. not highly inclined objects), redshift km s-1 (local), with RC3 morphological types in the range S0 to Sb (i.e. relatively early types), with declination above -10 degrees (i.e. observable from the northern hemisphere). Virgo cluster galaxies, except for S0’s, were excluded to avoid uncertainties about the consistency of the Hubble classification in Virgo (van den Bergh, 1976; Koopmann & Kenney, 1998). The sample here is the unbarred subset of the parent sample: those galaxies with RC3 classifications of SA or S (the latter formally means that no bar classification is available), as well as those SB and SAB galaxies which were judged to lack true bars by Erwin & Sparke (2003) and Erwin (2005). (We excluded NGC 2655 from the latter set because it appears to be in the midst of an interaction; see Sparke et al. 2008.) See Section 4 for more details on previously undetected bars.
We then removed the following galaxies because they gave strong evidence for being edge-on systems, despite their low axis ratios: NGC 3630, NGC 4474, and NGC 4638. The low axis ratios generally stem from the fact that these appear to be bulge-dominated S0 galaxies. We also removed NGC 4382 because we were unable to determine a clear outer-disk orientation for this galaxy, due to strong changes in ellipticity and position angle (without evidence for bars, rings, or spiral arms). This leads us to suspect that it may not be a true S0 galaxy; the fact that it had one of the very highest fine-structure measurements in Schweizer & Seitzer (1992) suggests it may more of an elliptical-like merger remnant. Finally, we also removed NGC 3414, which is a peculiar system that may be a polar-ring galaxy; the outer isophotes appear hexagonal, and it is not clear whether the thin, bright structure bisecting the galaxy is an extraordinarily thin bar or an edge-on disk.
In Table 1 we have listed the 47 galaxies in the sample with their global properties. Most of the basic data for the sample galaxies (coordinates, , redshift, etc.) were found in the RC3 catalog (de Vaucouleurs et al., 1991), LEDA catalogs (Lyon-Meudon Extragalactic Database111http://leda.univ-lyon1.fr) or from the NASA/IPAC Extragalactic Database (NED222http://nedwww.ipac.caltech.edu). References for galaxy distances are given in the table. The majority of these are kinematic distances using the Virgocentric-inflow-corrected velocities given by LEDA and a Hubble constant of km s-1 Mpc-1, while the next largest set of distances are surface-brightness fluctuation measurements, mostly from Tonry et al. (2001), incorporating the suggested metallicity correction of Mei et al. (2005), which amounts to subtracting 0.06 from the distance moduli in Tonry et al.
| Galaxy | Type (RC3) | Distance | Reference | scale | PA | ||||
|---|---|---|---|---|---|---|---|---|---|
| (Mpc) | (″) | (pc/″) | (°) | (°) | (km s-1) | ||||
| (1) | (2) | (3) | (4) | (5) | (6) | (7) | (8) | (9) | (10) |
| IC 356 | SA(s)ab pec | 15.1 | 4 | 157 | 73 | 100 | 43 | -21.2 | 320 |
| IC 499 | Sa | 28.8 | 4 | 63 | 140 | 78 | 59 | -19.3 | |
| NGC 278 | SAB(rs)b | 11.0 | 4 | 63 | 53 | 155 | 19 | -19.4 | 181 |
| NGC 949 | SA(rs)b | 11.0 | 1 | 72 | 53 | 145 | 62 | -18.5 | 95 |
| NGC 972 | Sab | 21.7 | 4 | 99 | 105 | 147 | 61 | -20.4 | 151 |
| NGC 1068 | (R)SA(rs)b | 14.2 | 4 | 212 | 69 | 77 | 36 | -21.2 | 198 |
| NGC 1161 | S00 | 27.8 | 4 | 85 | 135 | 20 | 51 | -21.1 | |
| NGC 2300 | SA00 | 29.3 | 4 | 85 | 142 | 84 | 54 | -20.6 | |
| NGC 2460 | SA(s)a | 22.2 | 4 | 74 | 108 | 29 | 52 | -19.6 | 194 |
| NGC 2775 | SA(r)ab | 18.0 | 4 | 128 | 87 | 165 | 39 | -20.5 | 303 |
| NGC 2985 | (R’)SA(rs)ab | 21.1 | 4 | 137 | 102 | 178 | 36 | -20.7 | 237 |
| NGC 3031 | SA(s)ab | 3.6 | 2 | 807 | 18 | 150 | 58 | -20.7 | 225 |
| NGC 3032 | SAB(r)00 | 21.4 | 1 | 60 | 104 | 93 | 33 | -18.7 | |
| NGC 3169 | SA(s)a pec | 16.5 | 4 | 131 | 80 | 55 | 43 | -20.2 | 391 |
| NGC 3245 | SA(r)00 | 20.3 | 1 | 97 | 99 | 178 | 56 | -20.0 | |
| NGC 3455 | (R’)SAB(rs)b | 15.8 | 4 | 74 | 77 | 62 | 57 | -17.1 | 109 |
| NGC 3599 | SA00 | 19.8 | 1 | 81 | 96 | 46 | 22 | -18.7 | |
| NGC 3604 | SA(s)a pec | 21.4 | 4 | 63 | 104 | 18 | 49 | -19.3 | 173 |
| NGC 3607 | SA(s)00 | 22.2 | 1 | 147 | 108 | 126 | 29 | -20.9 | |
| NGC 3619 | (R)SA(s)0+ | 23.8 | 4 | 81 | 115 | 66 | 19 | -19.5 | |
| NGC 3626 | (R)SA(rs)0+ | 19.5 | 1 | 81 | 95 | 162 | 49 | -19.8 | |
| NGC 3675 | SA(s)b | 12.9 | 4 | 177 | 63 | 172 | 64 | -20.1 | 213 |
| NGC 3813 | SA(rs)b | 21.9 | 4 | 67 | 106 | 85 | 71 | -19.9 | 141 |
| NGC 3898 | SA(s)ab | 18.9 | 4 | 131 | 92 | 107 | 53 | -20.5 | 274 |
| NGC 3900 | SA(r)0+ | 25.9 | 4 | 95 | 126 | 1 | 61 | -20.0 | |
| NGC 3998 | SA(r)00? | 13.7 | 1 | 81 | 67 | 136 | 38 | -19.4 | |
| NGC 4138 | SA(r)0+ | 13.4 | 1 | 77 | 65 | 150 | 55 | -18.4 | |
| NGC 4150 | SA(r)00 | 13.7 | 1 | 70 | 66 | 146 | 50 | -18.3 | |
| NGC 4223 | SA(s)0+ | 16.5 | 2 | 61 | 80 | 126 | 59 | -18.2 | |
| NGC 4281 | S0+ | 23.8 | 1 | 91 | 115 | 86 | 66 | -19.7 | |
| NGC 4369 | (R)SA(rs)a | 16.6 | 4 | 63 | 81 | 53 | 19 | -18.8 | 134 |
| NGC 4459 | SA(r)0+ | 16.1 | 3 | 106 | 78 | 102 | 38 | -19.8 | |
| NGC 4578 | SA(r)00 | 16.3 | 3 | 99 | 79 | 31 | 47 | -18.8 | |
| NGC 4736 | (R)SA(r)ab | 5.1 | 1 | 337 | 25 | 119 | 30 | -20.0 | 194 |
| NGC 4750 | (R)SA(rs)ab | 25.4 | 4 | 61 | 123 | 173 | 42 | -20.3 | 193 |
| NGC 4772 | SA(s)a | 14.5 | 4 | 102 | 70 | 147 | 46 | -19.2 | 279 |
| NGC 4826 | (R)SA(rs)ab | 7.3 | 1 | 300 | 35 | 113 | 61 | -20.6 | 153 |
| NGC 4880 | SA(r)0+ | 19.7 | 4 | 95 | 95 | 159 | 43 | -18.5 | |
| NGC 4941 | (R)SAB(r)ab | 15.0 | 4 | 109 | 73 | 21 | 48 | -19.3 | 185 |
| NGC 5273 | SA(s)00 | 16.1 | 1 | 83 | 78 | 9 | 31 | -18.6 | |
| NGC 5485 | SA00 pec | 25.2 | 1 | 70 | 122 | 167 | 49 | -19.7 | |
| NGC 5520 | Sb | 28.5 | 4 | 60 | 138 | 64 | 62 | -19.5 | 138 |
| NGC 6340 | SA(s)0/a | 20.2 | 4 | 97 | 98 | 175 | 20 | -19.8 | |
| NGC 7217 | (R)SA(r)ab | 14.9 | 4 | 117 | 72 | 89 | 28 | -20.3 | 306 |
| NGC 7457 | SA(rs)0-? | 12.9 | 1 | 128 | 62 | 126 | 58 | -18.9 | |
| UGC 3580 | SA(s)a pec | 19.3 | 4 | 102 | 94 | 7 | 64 | -18.7 | 104 |
| UGC 4599 | (R)SA00 | 28.2 | 4 | 60 | 137 | 91 | 24 | -17.4 |
Note. — Basic data for the galaxies in our sample. Col. (1) Galaxy name; (2) Classification from de Vaucouleurs et al. (1991) (RC3); (3) Distance in Mpc; (4) Reference for distance: 1 = Tonry et al. (2001), including metallicity correction from Mei et al. (2005), 2 = Freedman (2001), 3 = mean distance to Virgo Cluster from Mei et al. (2007), 4 = radial velocity, corrected for Local Group infall onto Virgo (from LEDA), using km s-1 Mpc-1; (5) Half of the corrected magnitude diameter from RC3; (6) Scale in pc arcsec-1; (7) and (8) Position angle and inclination of the outer disk, measured in this work (see Section 2.4); (9) Absolute magnitude, using the corrected apparent magnitude from LEDA and the distance in column 3; (10) Maximum rotation velocity calculated using the apparent maximum rotation velocity of gas from LEDA corrected for inclination in column 8.
We note that after a detailed analysis of the images, a number of the “unbarred” galaxies turned out to have bars (and a fraction of these even have two bars!); Section 4 discusses the individual cases and Table 7 presents the bar parameters for these galaxies. Despite the fact that these galaxies have proved to be barred rather than unbarred, we included them in our full outer-disk analysis (though they are grouped with other barred galaxies when we discuss population properties).
2.2. Sources of the images used
In Table 2, we give a list of the galaxies and relevant information about the observations and calibrations. This table lists the image sources used for generating the surface-brightness profiles, along with the exposure time and calibration method used.
| Galaxy | Telescope/Instrument | Date | (s) | Calibration | Notes |
|---|---|---|---|---|---|
| IC 356 | INT-WFC | 2004-03-16 | 2600 | standards | |
| IC 499 | INT-WFC | 2004-03-16 | 2600 | standards | |
| NGC 278 | INT-WFC | 2004-12-11 | 3 60 | standards | 1, 2 |
| NGC 949 | INT-PFCU | 1994-12-04 | 240 | PH98 | 2 |
| NGC 972 | JKT/JAG | 2000-11-01 | 21200 | J04 | 2 |
| NGC 1068 | SDSS | DR5 | 54 | SDSS | |
| NGC 1161 | INT-WFC | 2004-03-16 | 30 | standards | |
| NGC 2300 | INT-WFC | 2004-03-16 | 60 | standards | |
| NGC 2460 | INT-WFC | 2004-03-14 | 2600 | standards | |
| NGC 2775 | SDSS | DR5 | 54 | SDSS | |
| NGC 2985 | JKT/JAG | 2003-03-08 | 3300 | N07 | |
| NGC 3031 | SDSS | DR5 | 54 | SDSS | |
| NGC 3032 | SDSS | DR5 | 54 | SDSS | |
| NGC 3169 | INT-WFC | 2004-03-14 | 2600 | standards | |
| NGC 3245 | INT-WFC | 2004-03-16 | 60 | standards | |
| NGC 3455 | SDSS | DR5 | 54 | SDSS | |
| NGC 3599 | INT-WFC | 2004-03-14 | 2600 | standards | |
| NGC 3604 | INT-WFC | 2004-03-15 | 2600 | standards | |
| NGC 3607 | SDSS | DR5 | 54 | SDSS | |
| NGC 3619 | SDSS | DR5 | 54 | SDSS | |
| NGC 3626 | SDSS | DR5 | 54 | SDSS | |
| NGC 3675 | SDSS | DR5 | 54 | SDSS | |
| NGC 3813 | SDSS | DR5 | 54 | SDSS | |
| NGC 3898 | SDSS | DR5 | 54 | SDSS | |
| NGC 3900 | INT-WFC | 2004-03-14 | 600 | standards | |
| NGC 3998 | INT-WFC | 2004-03-16 | 60 | standards | |
| NGC 4138 | SDSS | DR5 | 54 | SDSS | |
| NGC 4150 | INT-WFC | 2004-03-17 | 60 | standards | |
| NGC 4223 | SDSS | DR5 | 54 | SDSS | |
| NGC 4281 | SDSS | DR5 | 54 | SDSS | |
| NGC 4369 | INT-WFC | 2004-03-15 | 2600 | standards | |
| NGC 4459 | SDSS | DR5 | 54 | SDSS | |
| NGC 4578 | SDSS | DR5 | 54 | SDSS | |
| NGC 4736 | INT-WFC | 2004-03-17 | 120 | standards | |
| NGC 4750 | INT-WFC | 2004-03-17 | 2600 | standards | |
| NGC 4772 | SDSS | DR5 | 54 | SDSS | |
| NGC 4826 | INT-WFC | 2004-03-17 | 2600 | standards | |
| NGC 4880 | SDSS | DR5 | 54 | SDSS | |
| NGC 4941 | INT-WFC | 2004-03-15 | 2600 | standards | |
| NGC 5273 | INT-WFC | 2004-03-16 | 2600 | standards | |
| NGC 5485 | INT-WFC | 2004-03-15 | 2600 | standards | |
| NGC 5520 | SDSS | DR5 | 54 | SDSS | |
| NGC 6340 | INT-WFC | 2004-03-14 | 600 | standards | |
| NGC 7217 | JKT/JAG | 2000-05-31 | 4600 | K06 | |
| NGC 7457 | JKT/JAG | 2002-09-09 | 3600 | PH98 | 2, 3 |
| UGC 3580 | INT-WFC | 2004-03-14 | 2600 | standards | |
| UGC 4599 | INT-WFC | 2004-03-17 | 21200 | standards | 4 |
Note. — In the Calibration column, “standards” indicates calibration using simultaneous observations of Landolt standard stars, while PH98 indicates use of aperture photometry from Prugniel & Heraudeau (1998); J04, calibrations from James et al. (2004); N07, calibrations from Noordermeer & van der Hulst (2007); and K06, calibrations from Kassin et al. (2006). Notes: 1 = Calibration based on Knapen et al. (2004); 2 = archival data; 3 = -band image calibrated to Cousins (see text); 4 = -band image only.
The largest subset of images (22 galaxies) came from an observing run with the Wide Field Camera (WFC) of the Isaac Newton Telescope (INT) of the Roque de los Muchachos Observatory (ORM) La Palma, Spain, in the period 14th–17th March 2004. The conditions were photometric, although the seeing varied considerably (between 0.8″ and 3.4″). Even the worst seeing in this run does not, however, pose a real problem for our work, since we treat data from the outer parts of the disks where averages over relatively large areas are used. All of the INT-WFC images used in this work were acquired with the filter, with one exception: UGC 4599. We did make observations of this galaxy in the band in a previous run (December 2003); however, the resulting images were dominated by scattered light and not nearly as useful as the -band image acquired in March 2004. Consequently, we used the latter for this galaxy.333Analysis of the -band images does result in a similar profile, albeit more limited by sky-background uncertainty.
For 19 of the galaxies, we used Data Release 5 (DR5) of the Sloan Digital Sky Survey (SDSS444http://www.sdss.org/dr5/) (York et al., 2000; Adelman-McCarthy et al., 2007). As discussed in PT06 and Paper I, the highly uniform sky background of the SDSS images means that we can use them to derive profiles extending further out than might naively be thought, given the relatively short exposure times.
Images for six galaxies were taken from the archive of the Isaac Newton Group at the Astronomical Data Centre of the Cambridge Astronomical Search Unit (CASU)555http://casu.ast.cam.ac.uk/casuadc/archives/ingarch. Four of these were taken with the Jacobus Kapteyn Telescope (JKT) and two with the Isaac Newton Telescope. We used images taken with or filters for all but one of these galaxies; the exception was NGC 7457, for which the best available image was in the band calibrated to (see Section 2.3.3).
For those objects where we have both SDSS and INT-WFC images we have used the latter, as they are deeper, except for those few cases where there are strong background variations or other imperfections.
2.3. Image processing
2.3.1 Image preparation
The images we took from the SDSS were already reduced. However, in some cases we had to merge adjacent fields from the same imaging run in order to obtain the complete image of the galaxy. Only for NGC 3032 did we merge images from different runs, photometrically calibrating each image separately, subtracting the sky background, and correcting for the factor equivalent to the zero point difference before merging (see Section 2.3.3 for more details on the calibration).
For the INT-WFC images we had to reduce the raw images; we flat-fielded and bias-corrected them, and corrected for the non-linearity of the WFC CCDs found by the Isaac Newton Group and the Cambridge Astronomical Survey Unit’s INT Wide Field Survey.666See http://www.ast.cam.ac.uk/ wfcsur/technical/foibles/. Alignment of multiple exposures was performed using standard IRAF777Image Reduction and Analysis Facility (IRAF); http://iraf.noao.edu tasks. After alignment and sky background correction the images were combined using the IRAF task imcombine, which was done for all cases except those few for which only a single exposure was available. For all but two of the INT-WFC observations, the galaxies fit inside the central CCD chip (Chip 4 of the mosaic), and so we did not need to create a mosaic. The exceptions were NGC 4736 and NGC 4826, which were large enough to overfill Chip 4. For these galaxies, we created mosaic images by copying the individual chip images into a single image, using appropriate rotations and offsets as determined by Eliche-Moral et al. (2006).
Archival images taken with the JKT and the INT-PFCU were reduced in similar fashion.
2.3.2 Sky subtraction and image masking
A key part of the reduction of our images was the sky subtraction, which is of critical importance when measuring the faint outer parts of the disk. We used the technique described in detail in Paper I. The SDSS images were easier to handle because their sky backgrounds were highly uniform. However, for all the galaxies in the sample we first probed the background for large scale variations, applying a median filter with a 99 pixel box across the whole image. If a gradient was present, we used the IRAF task imsurfit to correct the original image. For using this task we selected rectangular regions of the sky that did not include galaxies or bright stars.
Following this, we subtracted off a background level whose value was measured in clean areas of the image far from the edge of the detectable surface brightness increment due to the galaxy, and avoiding cosmetic chip defects, stars and field galaxies. A typical background estimate used median values from a set of 70–100 boxes, each 1010 pixels in size. The mean value of the individual medians was then calculated; the uncertainty on this mean was calculated by bootstrap resampling. (See Paper I for a more detailed discussion of this methodology.) As was done by PT06 and Paper I, we derive a confidence limit for our surface brightness profiles corresponding to 4.94 , which is the surface brightness level where an error of one in the background measurement would change the profile by 0.2 magnitudes arcsec-2. In our graphical presentations of the profiles (Figure 14; see Section 2.4) we have plotted them until they become obviously noisy, in general down to a little below this defined uncertainty limit, which typically lies between 26.0 and 28.0 mag arcsec-2. We note that 8 of the galaxies in the sample have uncertainty limits at values fainter than 28.0 mag arcsec-2.
The masking process is an important feature of our procedure. It entails flagging those regions which contain bright stars, or field galaxies, or instrumental defects (reflections, ghosts, bad columns etc.). The flagged regions, marked out as circles, ellipses, rectangles or polygons via the DS9 image display, are converted to IRAF pixel-list (.pl) format mask images, which the ellipse-fitting routine uses to identify masked pixels. We found that in general the INT-WFC images required more masking than those from the SDSS, and galaxies closer to the Galactic plane also required considerable masking.
2.3.3 Image Calibration
To maintain as uniform a calibration scheme as possible we have standardized our images on the Cousins band. For many galaxies we used standard stars as calibrators, in others we calibrated indirectly using aperture photometry from the literature, and for the SDSS images we converted the SDSS zero points to Cousins . To do that, as in Paper I, we determined the appropriate Cousins zero point via the following expression from Smith et al. (2002):
| (1) |
where ZPR is the Cousins R zero point and is the corresponding color for the galaxy (see Paper I for details). We determined with circular apertures, using the largest apertures possible which did not extend beyond the main body of the galaxy. The photometry used the IRAF task apphot from the digiphot package. Table 3 lists the colors and the resulting Cousins zero points for the set of galaxies taken from the SDSS.
| Galaxy | ZPr | ZPg | ZPR | |
|---|---|---|---|---|
| NGC 1068 | 26.25 | 26.55 | 0.64 | 26.02 |
| NGC 2775 | 26.25 | 26.61 | 0.77 | 26.01 |
| NGC 3031 | 26.20 | 26.56 | 0.81 | 25.95 |
| NGC 3032 | 26.19 | 26.54 | 0.54 | 25.97 |
| NGC 3455 | 26.15 | 26.44 | 0.39 | 25.95 |
| NGC 3607 | 26.14 | 26.43 | 0.76 | 25.89 |
| NGC 3619 | 26.23 | 26.53 | 0.73 | 25.99 |
| NGC 3626 | 26.25 | 26.69 | 0.67 | 26.02 |
| NGC 3675 | 26.22 | 26.53 | 0.79 | 25.97 |
| NGC 3813 | 26.23 | 26.52 | 0.51 | 26.02 |
| NGC 3898 | 26.23 | 26.67 | 0.75 | 25.99 |
| NGC 4138 | 26.19 | 26.56 | 0.74 | 25.95 |
| NGC 4223 | 26.22 | 26.52 | 0.76 | 25.97 |
| NGC 4281 | 26.25 | 26.57 | 0.79 | 26.00 |
| NGC 4459 | 26.27 | 26.73 | 0.83 | 26.01 |
| NGC 4578 | 26.26 | 26.58 | 0.77 | 26.02 |
| NGC 4772 | 26.23 | 26.48 | 0.71 | 25.99 |
| NGC 4880 | 26.20 | 26.58 | 0.66 | 25.97 |
| NGC 5520 | 26.22 | 26.67 | 0.52 | 26.01 |
Note. — Cousins calibrations for galaxies with images taken from the SDSS. Columns: (1) Galaxy name; (2) and (3) SDSS zero points calculated using the associated tsField tables; (4) color determined from aperture photometry; (5) zero points for Cousins- magnitude, found as described in Section 2.3.3
The -band calibrations for our 2004 INT-WFC run were based on simultaneous standard star observations and were presented in Paper I. These calibrations require an observed color for each galaxy. In most cases, we used colors from the aperture photometry collected in Prugniel & Heraudeau (1998); for NGC 5273 we used the value published by Barway et al. (2005). For those galaxies where we could not find a published value, we assumed the following mean (unreddened) values for the different Hubble types (see Paper I): S0: = 1.5; S0/a & Sa: = 1.4; Sab & Sb: = 1.3. We then applied Galactic reddening based on the values in NED (taken from Schlegel et al., 1998) to estimate what the observed color would be for those galaxies. In Table 4 we list the galaxies observed with the INT-WFC and their corresponding values.
| Galaxy | Galaxy | Galaxy | |||
|---|---|---|---|---|---|
| IC 356 | 2.27 | NGC 3604 | 1.48 | NGC 4826 | 1.37 |
| IC 499 | 1.51 | NGC 3900 | 1.55 | NGC 4941 | 1.41 |
| NGC 1161 | 1.86 | NGC 3998 | 1.53 | NGC 5273 | 1.31 |
| NGC 2300 | 1.67 | NGC 4150 | 1.53 | NGC 5485 | 1.62 |
| NGC 2460 | 1.52 | NGC 4369 | 1.44 | NGC 6340 | 1.53 |
| NGC 3169 | 1.46 | NGC 4736 | 1.33 | UGC 3580 | 1.49 |
| NGC 3245 | 1.53 | NGC 4750 | 1.38 | UGC 4599 | 1.55 |
| NGC 3599 | 1.25 |
Images of the galaxies NGC 278, NGC 949, NGC 972, NGC 2985, NGC 7217, and NGC 7457 were obtained from the ING archive and did not, in general, have accompanying standard-star observations. We calibrated these images using aperture photometry (with the IRAF task apphot), compared with published aperture data: For NGC 278 we used photometric data from Knapen et al. (2004), for NGC 949 we used data from Heraudeau & Simien (1996), for NGC 972 two aperture measurements kindly provided by Phil James (private communication, based on data from James et al. 2004), for NGC 2985 the “”888The magnitude integrated out to , the isophotal diameter at 25 mag arcsec-2. value of Noordermeer & van der Hulst (2007), and for NGC 7217 the Cousins-R magnitude of Kassin et al. (2006).
In the case of NGC 7457, the best available image was actually a -band observation from the ING Archive. We transformed this to the -band using aperture photometry from Prugniel & Heraudeau (1998). Since the B V and color profiles for this galaxy in Michard & Poulain (2000) are almost flat, this is probably a reasonable approach, and the true -band profile will not be significantly different from ours.
2.4. Ellipse fitting and deriving the surface brightness profiles
Radial surface brightness profiles can be constructed by fitting ellipses to the galaxy isophotes. There are two basic ways to do this. The first (“free” fitting) leaves the ellipticity and position angle of the ellipses as free variables, along with the mean surface brightness, to be determined for each value of the semi-major axis. The second method (“fixed” fitting) fixes the values of the ellipticity and position angle to that of the outer disk, so that only the mean surface brightness is a free parameter. The latter method has the virtue that one is effectively averaging around concentric circles of the deprojected galaxy. Distortions due to smaller scale features (e.g. spiral arms) tend to be smoothed out, although if prominent they can still be traced in the global profile. This technique was used effectively by PT06 and in Paper I; see the latter for discussion of why free-ellipse fitting can produce distortions in surface-brightness profiles if strong non-axisymmetric structures are present.
Our basic approach is the same as in Paper I: we use free-ellipse fitting to help determine the orientation (apparent ellipticity and position angle) of the outer disk. The values given in Table 1 are the results of this process. That table lists inclination for each galaxy, derived from the outer-disk ellipticity using the formula (Hubble, 1926)
| (2) |
where is the intrinsic flattening of the disk, for which we assumed that the outer disk is an axisymmetric ellipsoid with axis ratio (de Grijs, 1998). Once this is done, we re-run the ellipse-fitting software (the ellipse task in IRAF) in “fixed” mode, with ellipticity and position angle held constant to the values of the outer disk. When deriving the surface brightness profiles using fixed fitting we took a logarithmic radial sampling interval, with steps which increase the radius by 3% each. The surface brightness value obtained is the median value for the pixels in the given elliptical annulus. Using the median helps ensure that cosmic rays, bad pixels, faint stars, etc., are not included in the result.
We fitted exponentials to those parts of the radial surface brightness profiles where the plots, in magnitude vs linear radius, are clearly linear. Tests using a subsample of galaxies suggest that typical uncertainties due to the exact choice of fitting range are mag for the central surface brightnesses and % for the scale length. In a few cases (notably for NGC 4578 and NGC 4772; see Figure 14) we have excluded from the fit those radial ranges where there was clearly a local flux excess, a “bump” due to the presence of a particularly strong non-exponential feature, such as a ring.
The outer limits to our fits have been determined by the confidence limit of the profile brightness, set at 4.94 (see Section 2.3.2).
3. The classification scheme
In this paper we will be using the classification scheme first put forward in Erwin et al. (2005) and further elaborated in PT06 and Paper I. This consists of three basic profile types: Type I, a single continuous exponential decline in surface brightness with no change in slope; Type II, a double (or broken) exponential, changing from a shallower inner slope to a steeper outer slope at a defined galactocentric radius; and Type III, similarly a double/broken exponential, but this time changing from a steeper inner slope to a shallower outer slope at a defined galactocentric radius. This nomenclature is based on the original work of Freeman (1970) who first distinguished Types I and II.
Type II profiles have a number of subclasses (see PT06 and Paper I for diagrammatic representations). If a galaxy is barred, then we can distinguish between Type II.i or Type II.o, depending on whether the “break”, the change in exponential slope, occurs inside (“i”) or outside (“o”) the radius of the end of the bar. Type II.o can be divided again into two: Type II.o-OLR and Type II.o-CT. It has been suggested (Paper I) that the former are caused by dynamical effects associated with the Outer Lindblad Resonance (OLR). These breaks are found typically at radii between 2 and 3 bar lengths, which is the zone where outer rings are normally found. Type II.o-CT, “classical truncations”, do not bear any obvious dynamic relation with any measured features, and we conjecture that they are in some way related to a star formation threshold, and not to the OLR of a bar (e.g., Schaye, 2004; Elmegreen & Hunter, 2006; Roškar et al., 2008a; Sánchez-Blázquez et al., 2009). In certain ambiguous cases, we leave the classification as “II.o”. For unbarred galaxies, like the vast majority of those in this paper, the subtypes reduce to II-CT or II-AB (the latter being “asymmetric break” profiles, which do not appear in our sample; PT06 see them only in Sc – Sd galaxies).
Finally, Type III profiles can also be divided into subtypes, this time based on the apparent morphology of the outer component. Type III-d profiles are those where we infer that the outer (shallower) part of the profile is still part of the galaxy’s disk, either because we see clear spiral structure in this region or because the observed ellipticity does not change significantly. In Type III-s profile, on the other hand, we see evidence for the outer component being due to a separate, rounder structure: e.g., an outer “spheroid”. The main evidence for this scenario is the presence of isophotes which become systematically rounder beyond the break radius. For face-on galaxies (e.g., inclination ), the distinction is often difficult or impossible (unless there are positive disk-morphology indications, such as spiral arms at large radii), and so we leave these profiles with a basic “III” classification. We note that in Type III-d profiles the change in slope of the brightness profile between inner and outer components is often abrupt, while for Type III-s profiles the transition at the break radius is gradual (as expected if light from the spheroid is dominating over light from the disk). In a few cases, where the classification was not very clear we left the profile classified as Type III-d(?), or Type III-s(?), with the question mark.
As found by PT06 and Paper I, there are a minority of profiles which show Type II behaviour in the inner radial range, and Type III behaviour outside. The profiles are composed of three exponential sections, one internal, a second further out with a steeper slope, and a third outermost section with a shallower slope than the second. In Table 5 of this article we list 5 galaxies identified as Type II + III; these galaxies are: IC 499, NGC 3455, NGC 3813, NGC 4369, and NGC 5273.
| Galaxy | Profile Type | ||||||
|---|---|---|---|---|---|---|---|
| ″ | ″ | ″ | |||||
| (1) | (2) | (3) | (4) | (5) | (6) | (7) | (8) |
| IC 356 | III-d | 32.9 | 65.7 | 69 | 19.41 | 20.47 | 21.6 |
| IC 499 | II.o-CT + III-s | 24.0 | 12.5 | 49 | 20.41 | 18.36 | 22.7 |
| 12.5 | 50.7 | 80 | 18.36 | 24.44 | 25.3 | ||
| NGC 278 | III | 14.1 | 35.1 | 65 | 18.19 | 21.26 | 23.0 |
| NGC 949 | III-d | 31.0 | 117.6 | 138 | 20.36 | 23.95 | 25.0 |
| NGC 972 | III-s | 23.2 | 53.5 | 105 | 19.50 | 22.21 | 24.2 |
| NGC 1068 | II.o-OLR | 125.7 | 73.7 | 190 | 21.37 | 20.31 | 23.0 |
| NGC 1161 | I | 92.9 | 327 | 22.50 | 26.4 | ||
| NGC 2300 | I | 141.4 | 525 | 22.49 | 26.6 | ||
| NGC 2460 | II-CT | 49.7 | 28.4 | 176 | 21.87 | 19.00 | 25.9 |
| NGC 2775 | III-d(?) | 26.8 | 61.4 | 90 | 18.71 | 20.75 | 22.1 |
| NGC 2985 | III-d | 18.1 | 81.0 | 69 | 18.57 | 21.76 | 21.8 |
| NGC 3031 | II.o-OLR | 185.8 | 111.4 | 520 | 19.37 | 17.38 | 22.4 |
| NGC 3032 | I | 18.9 | 110 | 20.49 | 26.9 | ||
| NGC 3169 | I | 53.6 | 360 | 20.50 | 27.9 | ||
| NGC 3245 | III-s | 18.9 | 85.3 | 120 | 18.72 | 23.28 | 24.5 |
| NGC 3455 | II-CT + III-d | 16.9 | 9.9 | 23 | 19.69 | 18.64 | 21.2 |
| 9.9 | 21.1 | 40 | 18.64 | 21.00 | 22.9 | ||
| NGC 3599 | I | 23.1 | 168 | 19.97 | 27.8 | ||
| NGC 3604 | III-d(?) | 17.2 | 42.8 | 80 | 20.18 | 23.09 | 25.1 |
| NGC 3607 | I | 82.1 | 360 | 21.45 | 26.3 | ||
| NGC 3619 | III-d | 29.4 | 38.4 | 100 | 20.67 | 21.39 | 24.3 |
| NGC 3626 | I | 21.6 | 142 | 19.20 | 26.3 | ||
| NGC 3675 | III-s | 44.9 | 79.2 | 153 | 19.07 | 20.60 | 22.7 |
| NGC 3813 | II-CT + III-s | 19.6 | 12.7 | 44 | 18.55 | 17.20 | 21.0 |
| 12.7 | 38.1 | 71 | 17.20 | 21.26 | 23.3 | ||
| NGC 3898 | III-d | 30.0 | 59.9 | 111 | 19.54 | 21.53 | 23.3 |
| NGC 3900 | III-d | 26.7 | 189.2 | 158 | 20.12 | 25.53 | 25.6 |
| NGC 3998 | III-d | 23.7 | 122.0 | 122 | 19.41 | 23.84 | 24.5 |
| NGC 4138 | III-d | 15.8 | 21.6 | 54 | 18.32 | 19.33 | 22.0 |
| NGC 4150 | III-s | 13.1 | 21.1 | 70 | 18.63 | 20.81 | 24.3 |
| NGC 4223 | III-s | 27.3 | 46.1 | 120 | 20.26 | 22.25 | 25.0 |
| NGC 4281 | III-s | 19.1 | 92.0 | 91.0 | 18.58 | 22.66 | 20.6 |
| NGC 4369 | II.o + III | 24.5 | 14.7 | 50.0 | 20.44 | 19.02 | 22.8 |
| 14.7 | 67.7 | 114 | 19.02 | 25.61 | 27.3 | ||
| NGC 4459 | III-d | 36.4 | 58.1 | 119 | 19.87 | 21.25 | 23.4 |
| NGC 4578 | I | 26.9 | 155 | 20.03 | 27.1 | ||
| NGC 4736 | II.o-OLR | 541.8 | 134.7 | 373 | 22.6 | 20.33 | 23.5 |
| NGC 4750 | III-d | 24.2 | 53.9 | 158 | 19.90 | 23.82 | 26.9 |
| NGC 4772 | I | 49.7 | 255 | 21.42 | 26.9 | ||
| NGC 4826 | III-s | 58.2 | 303.1 | 370 | 18.18 | 23.86 | 24.7 |
| NGC 4880 | II | 37.8 | 21.9 | 68 | 21.07 | 19.69 | 23.1 |
| NGC 4941 | I | 28.5 | 232 | 19.56 | 28.4 | ||
| NGC 5273 | II-CT + III-d | 22.1 | 15.9 | 58 | 19.83 | 18.75 | 22.7 |
| 15.9 | 23.0 | 83 | 18.75 | 20.48 | 24.4 | ||
| NGC 5485 | I | 113.5 | 400 | 23.17 | 27.9 | ||
| NGC 5520 | I | 12.4 | 82 | 19.34 | 26.9 | ||
| NGC 6340 | III | 26.6 | 50.5 | 110 | 19.87 | 22.00 | 24.2 |
| NGC 7217 | III | 24.3 | 63.1 | 79 | 18.76 | 20.99 | 21.8 |
| NGC 7457 | III-d | 22.1 | 33.2 | 42 | 19.01 | 19.74 | 21.0 |
| UGC 3580 | I | 27.3 | 158 | 20.98 | 27.4 | ||
| UGC 4599 | III-d | 42.2 | 64.1 | 121 | 24.05aa-band values | 25.07aa-band values | 27.2aa-band values |
Note. — Classification and measurements of disks surface brightness profiles. Surface brightnesses are observed values, and have not been corrected for Galactic extinction, inclination, or redshift. Note that Type I profiles by definition have no “outer” part and have only lower limits for the break radius and . For galaxies with composite profiles (IC 499, NGC 3455, NGC 3813, NGC 4369, and NGC 5273), we list values for both the inner zone (Type II) and the outer zone (Type III). Columns: (1) Galaxy name; (2) Profile classification as explained in text; (3) and (4) Scale length for the inner and outer exponential fits, respectively; (5) Position of break point on the profile; (6) and (7) Central -band surface brightness in mag arcsec-2 for the inner and outer exponential fits, respectively; (8) Surface brightness at the break point.
| Galaxy | |||||||
|---|---|---|---|---|---|---|---|
| () | (kpc) | () | (kpc) | () | (kpc) | () | |
| (1) | (2) | (3) | (4) | (5) | (6) | (7) | (8) |
| IC 356 | 0.21 | 2.41 | 0.42 | 4.81 | 0.44 | 5.05 | 2.10 |
| IC 499 | 0.38 | 3.35 | 0.20 | 1.75 | 0.78 | 6.85 | 2.04 |
| 0.20 | 1.75 | 0.81 | 7.08 | 1.28 | 11.18 | 6.40 | |
| NGC 278 | 0.22 | 0.75 | 0.56 | 1.87 | 1.04 | 3.47 | 4.63 |
| NGC 949 | 0.43 | 1.65 | 1.63 | 6.25 | 1.92 | 7.34 | 4.45 |
| NGC 972 | 0.23 | 2.44 | 0.54 | 5.62 | 1.06 | 11.03 | 4.53 |
| NGC 1068 | 0.59 | 8.68 | 0.35 | 5.09 | 0.89 | 13.11 | 1.51 |
| NGC 1161 | 1.10 | 12.54 | 3.52 | ||||
| NGC 2300 | 1.67 | 20.06 | 3.72 | ||||
| NGC 2460 | 0.67 | 5.35 | 0.39 | 3.06 | 2.38 | 18.91 | 3.54 |
| NGC 2775 | 0.21 | 2.33 | 0.48 | 5.34 | 0.70 | 7.83 | 3.36 |
| NGC 2985 | 0.13 | 1.86 | 0.59 | 8.28 | 0.50 | 7.01 | 3.78 |
| NGC 3031 | 0.23 | 3.27 | 0.14 | 1.96 | 0.64 | 9.15 | 2.80 |
| NGC 3032 | 0.32 | 1.96 | 5.82 | ||||
| NGC 3169 | 0.41 | 4.28 | 6.71 | ||||
| NGC 3245 | 0.19 | 1.86 | 0.88 | 8.40 | 1.24 | 11.82 | 6.35 |
| NGC 3455 | 0.23 | 1.30 | 0.13 | 0.76 | 0.32 | 1.78 | 1.38 |
| 0.13 | 0.76 | 0.29 | 1.62 | 0.55 | 3.09 | 4.10 | |
| NGC 3599 | 0.29 | 2.22 | 7.27 | ||||
| NGC 3604 | 0.27 | 1.79 | 0.68 | 4.45 | 1.28 | 8.31 | 4.65 |
| NGC 3607 | 0.56 | 8.83 | 4.38 | ||||
| NGC 3619 | 0.36 | 3.39 | 0.48 | 4.43 | 1.24 | 11.55 | 3.40 |
| NGC 3626 | 0.27 | 2.04 | 6.57 | ||||
| NGC 3675 | 0.25 | 2.81 | 0.45 | 4.95 | 0.87 | 9.59 | 3.42 |
| NGC 3813 | 0.29 | 2.08 | 0.19 | 1.35 | 0.65 | 4.60 | 2.23 |
| 0.19 | 1.35 | 0.57 | 4.05 | 1.05 | 7.52 | 5.57 | |
| NGC 3898 | 0.23 | 2.75 | 0.46 | 5.49 | 0.85 | 10.16 | 3.70 |
| NGC 3900 | 0.28 | 3.35 | 1.99 | 23.75 | 1.67 | 19.84 | 5.92 |
| NGC 3998 | 0.29 | 1.58 | 1.51 | 8.13 | 1.51 | 8.13 | 5.14 |
| NGC 4138 | 0.21 | 1.03 | 0.28 | 1.40 | 0.70 | 3.52 | 3.41 |
| NGC 4150 | 0.19 | 0.85 | 0.30 | 1.37 | 1.00 | 4.54 | 5.35 |
| NGC 4223 | 0.45 | 2.18 | 0.75 | 3.69 | 1.96 | 9.60 | 4.40 |
| NGC 4281 | 0.21 | 2.20 | 1.02 | 10.60 | 1.0 | 10.48 | 4.76 |
| NGC 4369 | 0.39 | 1.98 | 0.23 | 1.19 | 0.80 | 4.03 | 2.04 |
| 0.23 | 1.19 | 1.08 | 5.46 | 1.91 | 9.68 | 8.16 | |
| NGC 4459 | 0.34 | 2.84 | 0.55 | 4.52 | 1.12 | 9.27 | 3.27 |
| NGC 4578 | 0.27 | 2.12 | 5.76 | ||||
| NGC 4736 | 1.61 | 13.29 | 0.40 | 3.30 | 1.11 | 9.14 | 0.69 |
| NGC 4750 | 0.40 | 2.98 | 0.88 | 6.63 | 2.59 | 19.48 | 6.55 |
| NGC 4772 | 0.49 | 3.50 | 5.13 | ||||
| NGC 4826 | 0.19 | 2.05 | 1.01 | 10.69 | 1.23 | 13.05 | 6.36 |
| NGC 4880 | 0.40 | 3.61 | 0.23 | 2.09 | 0.72 | 6.49 | 1.80 |
| NGC 4941 | 0.26 | 2.07 | 8.14 | ||||
| NGC 5273 | 0.27 | 1.72 | 0.19 | 1.24 | 0.70 | 4.52 | 2.62 |
| 0.19 | 1.24 | 0.28 | 1.79 | 1.00 | 6.47 | 5.22 | |
| NGC 5485 | 1.61 | 13.89 | 3.52 | ||||
| NGC 5520 | 0.21 | 1.71 | 6.61 | ||||
| NGC 6340 | 0.27 | 2.60 | 0.52 | 4.94 | 1.13 | 10.77 | 4.14 |
| NGC 7217 | 0.21 | 1.76 | 0.54 | 4.56 | 0.68 | 5.71 | 3.25 |
| NGC 7457 | 0.17 | 1.38 | 0.26 | 2.07 | 0.33 | 2.62 | 1.90 |
| UGC 3580 | 0.27 | 2.55 | 5.79 | ||||
| UGC 4599 | 0.71 | 5.77 | 1.07 | 8.76 | 2.02 | 16.54 | 2.87 |
Note. — As for Table 5, but now listing outer-disk parameters in alternate units. Columns: (1) Galaxy name; (2) and (3) Scale lengths for the inner exponential fits in units of and kpc, respectively; (4) and (5) Scale lengths for the outer exponential fits in units of and kpc, respectively; (6), (7), and (8) Radius of the break point on the profile in terms of , kpc, and the inner scale length.
4. Bars in “Unbarred” Galaxies
As noted above (Section 2), the sample studied in this paper was intended to consist solely of unbarred galaxies; this includes some galaxies classified as barred in the RC3 which were, for various reasons, judged to be unbarred (see Erwin & Sparke, 2003; Erwin, 2005). Nonetheless, it is by now well accepted that large optical surveys such as RC3 sometimes miss bars, especially when galaxies are so dusty that the bars are more easily seen in infrared light (e.g., Eskridge et al., 2000). Accordingly, we have carefully examined each of the galaxies in our sample (making use of near-IR images when possible, as well as prior studies of each galaxy in the literature) for “hidden” bars. This examination has turned up a total of ten galaxies classified as unbarred which do host bars.
We also include in this section, 2 galaxies which were in fact classified as barred by RC3, but for which arguments had previously been made for the absence of bars, resulting in their exclusion from Paper I and inclusion in this sample. In some cases, we agree with the arguments (e.g., NGC 3032 and NGC 3455), but in the case of NGC 278 and NGC 4941 we now argue that these galaxies do have bars.
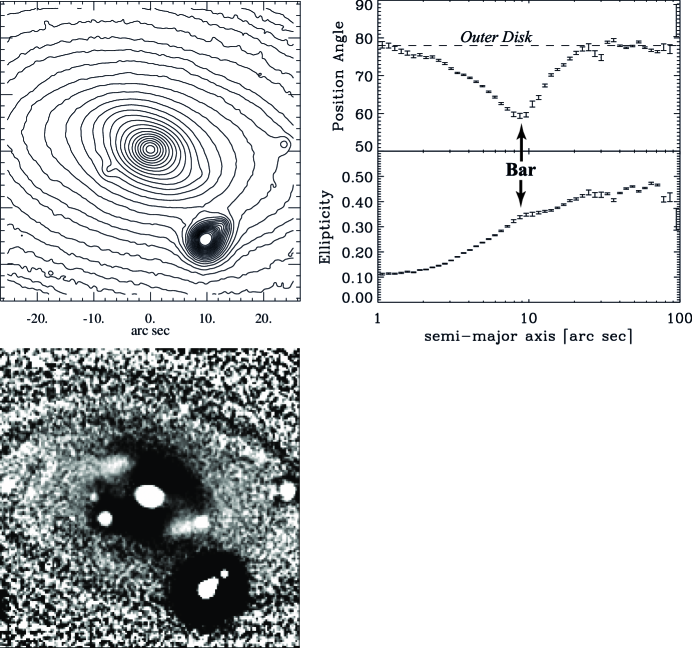
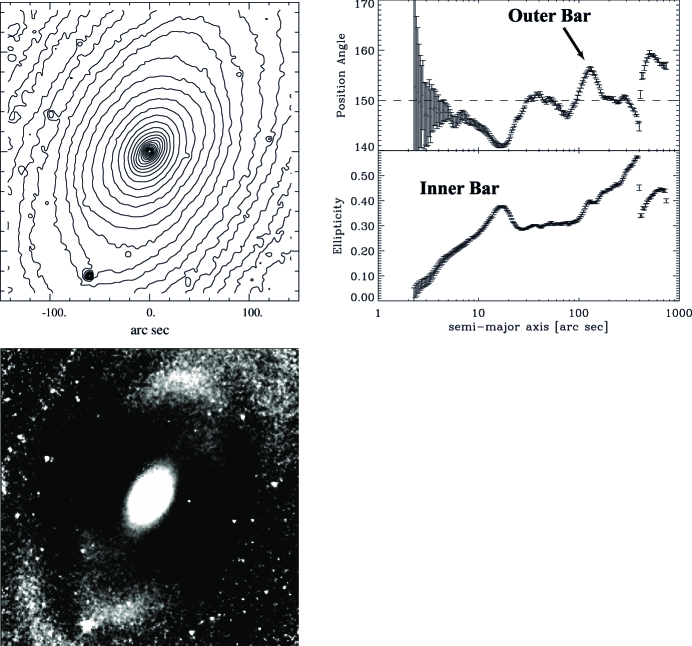
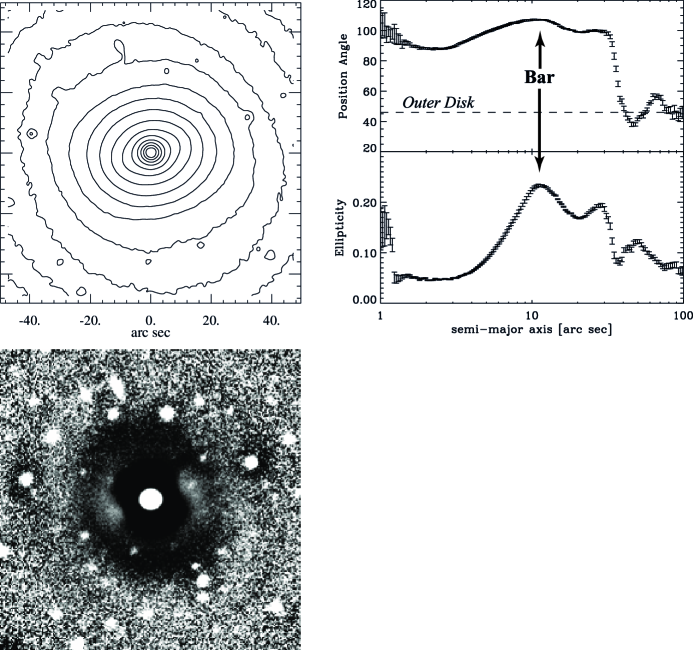
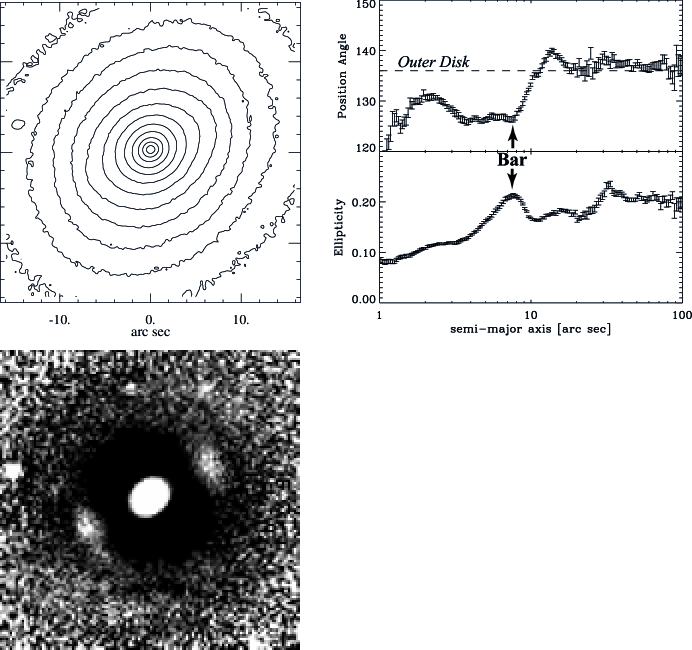
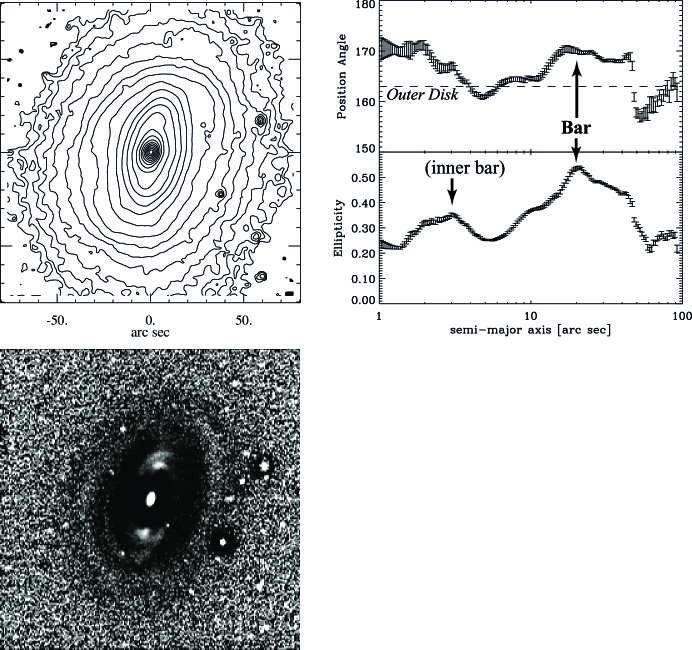
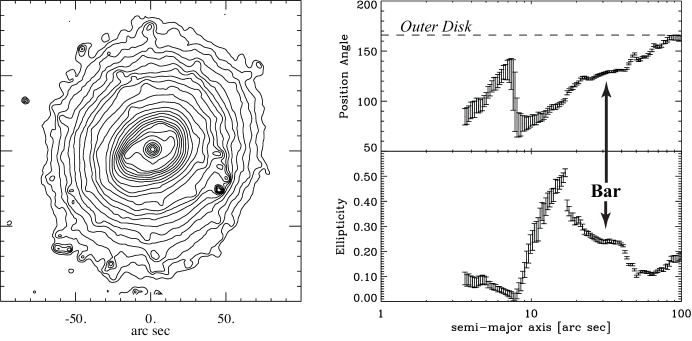
Undetected bars in optically “unbarred” galaxies fall into three general categories. The first are small- or medium-sized bars which are relatively weak and which have no accompanying rings or dust lanes; these may, especially in relatively featureless S0 galaxies, be difficult to distinguish with photographic plate data, due to the combination of poor resolution and contrast. Figures 1, 2, 3, and 4 show bars in IC 499, NGC 3031, NGC 3599, and NGC 3998. In all cases, the bars are relatively small, but show up in ellipse fits and unsharp masks (the characteristic feature of many bars in unsharp masks is caused by the sharp drop in surface brightness at the bar ends; see, e.g., Erwin & Sparke 2003). Additional evidence for the (outer) bar in NGC 3031 comes from an isophote morphology which indicates a vertically thickened bar seen at an intermediate angle (see Erwin & Debattista, in prep, for more details).
The second class of hidden bar consists of small- or medium-sized bars which have been obscured by dust; these are then best seen with near-infrared images. The most famous example of this in our sample is NGC 1068, whose (inner) bar was first pointed out by Scoville et al. (1988). Other examples include: NGC 3031, where Elmegreen et al. (1995) used near-IR images to point out the existence of a small, weak bar in the center of this galaxy; NGC 3626, where Laurikainen et al. (2005) found both a large-scale bar and evidence for a nuclear bar using -band images (see Figure 5); NGC 4369, in which a small, strong bar was reported by Knapen et al. (2000), based on the near-IR images of Peletier et al. (1999); NGC 4736 (Shaw et al., 1993; Möllenhoff et al., 1995); and NGC 4750 (Laine et al., 2002).
The third class of hidden bars are those in galaxies where the bar is so large, and the disk outside the bar so low in contrast and surface brightness, that the bar has been mistaken for the outer disk; it then requires deeper imaging to bring out the true outer disk and show that the bar is more elliptical and (often) misaligned with respect to the outermost isophotes. A discussion of this phenomenon for the case of NGC 5248 (not part of our sample) is given by Jogee et al. (2002). When the bar is relatively weak (i.e., not highly elliptical), these are sometimes referred to as “oval disks” (Kormendy & Norman, 1979). NGC 1068 and NGC 4736 are also examples of this phenomenon (where here we refer to their large, outer bars, not the dust-obscured inner bars discussed in the previous paragraph).
As noted above, NGC 1068, NGC 3031, NGC 4736, and NGC 4750 all have small bars which can be seen clearly only in near-IR images; such bars are sometimes referred to as “nuclear” bars, though in the case of NGC 1068 the bar in question is almost three kpc in diameter. These galaxies also have much larger, weaker bars, which in some cases (e.g., on shallow images) can be mistaken for the outer disk (a partial exception is NGC 3031, which has obvious spiral structure extending well outside the weak outer bar). Thus, they are actually double-barred galaxies (NGC 3626 may also fall into this category; see Laurikainen et al., 2005). Erwin (2004) summarizes the evidence for large-scale bars in NGC 1068 and NGC 4736.
Figure 6 shows isophotes and ellipse fits for an archival m Spitzer image of NGC 4750 (Program ID 40349, PI Giovanni Fazio). There is a weak oval structure with , a position angle of , and ellipticity . Inside this oval is a pair of spiral arms; these arms are what Laine et al. (2002) identified as an “outer bar” with a semi-major axis of 14″. This interior spiral structure is an indication that the oval is not a conventional strong bar. Nonetheless, the oval is clearly misaligned with respect to the outer disk, and more elliptical, so we consider it a bar.
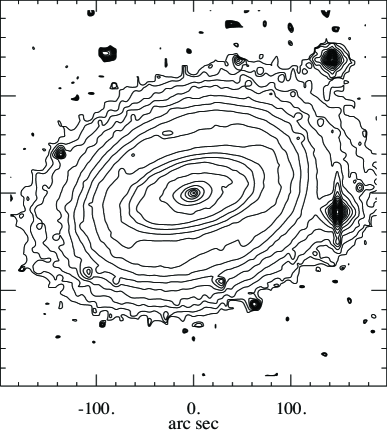
A similar case is NGC 4941. A nuclear bar with semi-major axis pc was seen in near-infrared images of this galaxy by Greusard et al. (2000), but those authors also argued that this was the only bar in the system, and that the RC3 classification of SAB was erroneous; this led to our excluding this galaxy from the barred-galaxy sample of Paper I, since that paper was supposed to include only galaxies with large-scale bars. However, Kormendy (1982) suggested that this galaxy have a (large-scale) “oval disk” like those in NGC 1068 and NGC 4736. Our analysis suggests that NGC 4941 is in fact a double-bar system analogous to those two galaxies. Figure 7 shows large-scale isophotes for this galaxy.
The final and most ambiguous example is NGC 4772 (see Figure 8). This galaxy appears, at first glance to consist of a luminous, round bulge embedded in a highly inclined, dusty disk, whose axis ratio is given by RC3. The latter structure extends to along its major axis. However, outside this elliptical structure there is a much fainter and rounder structure with slightly boxy isophotes, with a small twist with respect to the inner isophotes. This can be seen in the SDSS images, and was noted previously in -band images by Haynes et al. (2000), who pointed out that these outer isophotes coincided with a rounder outer ring in the H I distribution. They also noted a misalignment between the inner stellar and H kinematics, suggestive of “a misaligned disk or bar”. The -band image of Eskridge et al. (2002) shows that the “disk” region isophotes become slightly rectangular-ended (at ), as is often the case for bars in early-type disks (Athanassoula et al., 1990).
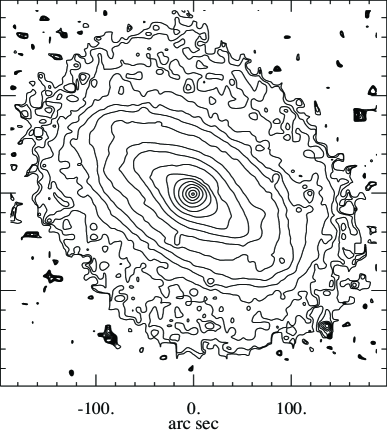
The overall appearance is quite similar to several other early-type spirals with large bars and faint outer rings, such as NGC 4941 (Figure 7) and NGC 5377 (see, e.g., Erwin & Sparke, 2003). Combined with the evidence described by Haynes et al. (2000), this leads us to identify the bright, elliptical “disk” of NGC 4772 as a very large, weak bar (or “oval disk”); we note that Eskridge et al. (2002) made a similar classification. Unfortunately, the faintness of the outer isophotes makes it somewhat difficult to determine the true orientation of the disk, though the stellar kinematics of Haynes et al. do suggest that the major axis is close to 147°.
We define the bar’s ellipticity and using ellipse fits to the -band image of Eskridge et al. (2002), with the upper limit on its size being set by measurements of the star-forming ring (which we tentatively identify as an inner ring) using the GALEX NUV image of Gil de Paz et al. (2007). The isophotes remain highly elliptical outside this region (out to ); it is unclear whether this should be considered part of the bar.
Table 7 presents bar measurements for the galaxies discussed in this Section, using the approach of Erwin (2005). For double-barred galaxies, we list just the large-scale “primary” bars.
| Galaxy | Bar PA (°) | (″) | / | (″) | |
|---|---|---|---|---|---|
| IC 499 | 49 | 8.8 | / | 10 | 0.35 |
| NGC 278 | 105 | 15 | 19/16 | 16 | 0.25 |
| NGC 1068 | 12 | 54 | 75/89 | 75 | 0.24 |
| NGC 3031 | 157 | 134 | / | 215 | 0.40 |
| NGC 3599 | 106 | 11 | 21/16 | 16 | 0.23 |
| NGC 3626 | 172 | 20 | 35/46 | 35 | 0.53 |
| NGC 3998 | 126 | 7.8 | 11/11 | 11 | 0.21 |
| NGC 4369 | 156 | 4.5 | /10 | 10 | 0.65 |
| NGC 4736 | 90 | 125 | 170/ | 170 | 0.23 |
| NGC 4750 | 127 | 33 | 45/44 | 44 | 0.24 |
| NGC 4772 | 146 | 70 | / | 80 | 0.53 |
| NGC 4941 | 17 | 68 | / | 95 | 0.41 |
Note. — Parameters for bars in galaxies previously classified as unbarred. is the semi-major axis of maximum isophotal ellipticity, closest to the bar end, and is a lower limit on bar size. is the semi-major axis of minimum ellipticity outside the bar end, while is the semi-major axis at which the position angle of fitted ellipses varies by more than 10° from the bar’s position angle. is the adopted upper limit on bar size. (The minimum and maximum of these values are plotted in Fig. 14.) is the maximum isophotal ellipticity within the bar. For double-barred galaxies (NGC 1068, 3031, 4736, and 4941, and possibly NGC 3626), we list measurements for the outer bar only; values for NGC 1068 and 4736 are taken from Erwin (2004).
How common, then, are “hidden” or otherwise unrecognized bars? If we take the combined S0–Sb sample of Paper I and this paper, we have a total of 38 galaxies classified as optically unbarred (SA), and another 5 galaxies with no bar classification (S). Of these, we find bars in 9 of the former (%) and 1 of the latter (%). Conversely, there appear to be no bars in two999NGC 3032 and NGC 3455 of the 76 optically barred (SB or SAB) galaxies in the combined sample; three more optically barred galaxies were excluded due to their being polar ring or merger systems (NGC 2146, NGC 2655, and NGC 2685). Roughly speaking, then, we can argue that 5% of optically barred galaxies are mis-classified, while % of optically unbarred galaxies prove, on closer inspection, to host bars.
These misclassification fractions are lower than those found by Eskridge et al. (2000) from their analysis of -band images of a sample of spiral galaxies, where they found that half of the optically unbarred spiral galaxies showed the presence of a bar. Note that galaxies studied by Eskridge et al. are later types — predominantly Sbc and Sc — and therefore dustier.
5. Results and Discussion
5.1. Trends with Hubble Type and Global Frequencies of Disk Profile Types
By combining the sample studied in this paper with that previously studied in Paper I and the late-type spirals (Sbc–Sdm) studied by PT06, we can, for the first time, see how profile types vary along the entire Hubble sequence of disk galaxies, and how common the different profiles are in the general population of disk galaxies.
Figure 9 plots the fractions of the three main profile types as a function of Hubble type for the combined S0–Sdm samples. The bins for early-type disks (S0, S0/a–Sa, Sab–Sb) are taken from Paper I and this paper; profiles for late-type disks (Sbc–Sc, Scd–Sd, Sdm–Sm) are taken from PT06. (To avoid mixing different sample selections into the same bin due the partial overlap at Sb between the early- and late-type samples, we excluded the Sb galaxies in the PT06 sample.) The plot uses classifications for a total of 183 galaxies: 113 early-type disk galaxies from this paper and Paper I, and 70 Sbc and later-type galaxies from Pohlen & Trujillo (2006). For Type II we count all possible subtypes (e.g., II.i, II.o, II-AB, etc.) and all “composite-profile” galaxies (i.e., II+III profiles). Similarly, the Type III fractions count all subtypes (III-d, III-s, and plain III) and all composite-profile galaxies. Composite-profile galaxies are thus counted twice, so the totals in each bin may be greater than 1. The error bars are 68% confidence limits derived from the so-called “Wilson” binomial confidence interval (Wilson, 1927), rather than the commonly used but inaccurate Gaussian (“Wald”) approximation; see Brown, Cai, & DasGupta (2001) for a discussion of these issues.
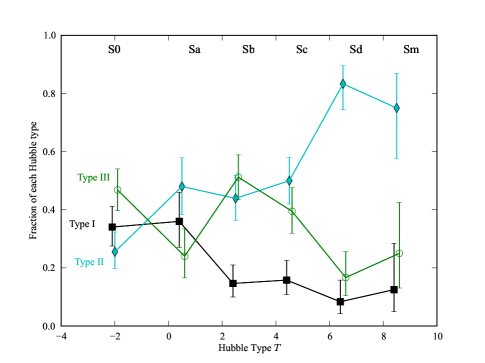
Two fairly clear trends emerge from this figure. The first is the relatively small fraction of Type II profiles in early type disks, and the dramatic increase in later Hubble types: while only % of S0 galaxies have Type II profiles, the fraction is % for the very latest spirals. The second trend is a clear, though less dramatic, change in the frequency of Type I profiles, which are most common in early-type disks and least common in late-type spirals.
We can also combine the various studies to estimate the global fractions of different profile types, although we must be careful in doing so, since the early and late-type samples were constructed differently and have different degrees of completeness. The early-type sample studied in Paper I and this paper was constructed to cover field S0–Sb (and Virgo S0) galaxies from the UGC with , axis ratios , major-axis diameters , and redshifts km s-1; it is essentially complete within these constraints. (Note that Virgo Cluster spirals were excluded from the sample.) The late-type sample of PT06 was constructed to cover Sb–Sdm galaxies with the same axis ratio restriction, but with a redshift limit of km s-1, Galactic latitudes , and . Because their data source was Data Release 2 (DR2) of SDSS, the final sample is incomplete: only % of the galaxies found in the HyperLeda database meeting those criteria actually had DR2 images, and some of the images were not usable (e.g., galaxy too close to the edge of an image). Clearly, we cannot simply add up all the profile numbers across both samples and expect to get fully significant results.
Instead, we correct the individual profile counts within each sample for selection effects, using a common notional parent sample, which we base on that of PT06: all disk galaxies () in the HyperLeda database with axis ratios (), km s-1, , and . We then remove those galaxies from Paper I and this paper which do not meet the parent-sample criteria (a total of 12 galaxies) and compute the completeness for the two observed samples (S0’s and early-type spirals: 102/591; late-type spirals: 70/537); the inverses of these completeness fractions are used to scale the observed counts of profile types.
From this we obtain our estimates for the global frequencies of disk-profile types: % Type I, % Type II, and % Type III. 101010Uncertainties are estimated by rescaling all corrected counts so that the totals add up to the number of observed galaxies (172), and then calculating the Wilson confidence intervals. Composite Type II+III profiles (e.g., IC 499, NGC 3455, NGC 3813, NGC 4399, and NGC 5273 in this paper) are here counted as both Type II and Type III; such profiles account for % of the total. The frequency of “pure” Type III profiles is %.
5.2. Comparing Parameters for Different Disk Profile Types
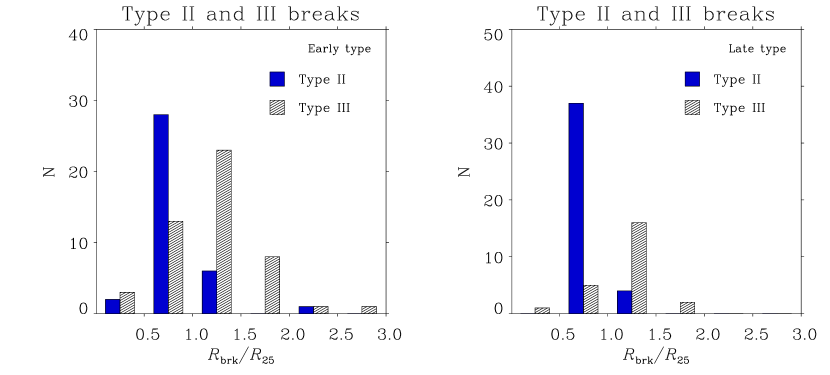
In Figure 10, we plot histograms for the position of the break radius for Type II and III profiles, in units of . This includes all galaxies from this study and Paper I (grouped together as “early-type” disks, left panel), along with separate plots for the late-type sample of PT06 (right panel). We exclude the (rare) Type II.i profiles from this comparison. Although the median sizes of the break radii are not drastically different (e.g., for Type II versus for Type III in the early-type sample), the Type III break radii clearly have a broader spread and are weighted toward larger values. A Kolmogorov-Smirnov (K-S) test confirms that the differences between the two profile types are significant ( for the early-type sample and for the late-type sample). Given that breaks at very large radii are harder to detect — since they are likely to occur at or beyond the reliability limit of our surface photometry — it is possible that we are underestimating the number of Type III breaks with radii . It is also worth noting that is a surface-brightness limit, and so changes in the surface-brightness profile can in principle change — if those changes happen interior to the level. The sense of this change would actually be the opposite of what we see: a truncation would bring closer in, and thus make larger, while an antitruncation would push further out, making smaller. If this effect is operating in our sample (and it cannot be operating for those galaxies with ), it means that we are, if anything, underestimating the difference between Type II and Type III break radii.
Though truncated and antitruncated profiles differ, by definition, from the simpler Type I profiles, there may still be some underlying similarities. We could hypothesize, for example, that the inner regions of Type II and III profiles (that is, the profile interior to the break radius) are fundamentally similar to Type I profiles, so that the only real difference is in the region outside the break. Alternatively, there could be physical similarities between the outer parts of Type II or III profiles and Type I profiles — as well as the possibility that none of the sub-regions are similar. In Figures 11 and 12 we plot histograms of absolute disk scale lengths , along with histograms of the extrapolated central surface brightnesses . These are plotted separately for the inner and outer components of Type II and III profiles, along with histograms of the same parameters for the single exponentials of Type I profiles. As with Figure 10, we plot the early-type and late-type samples separately.
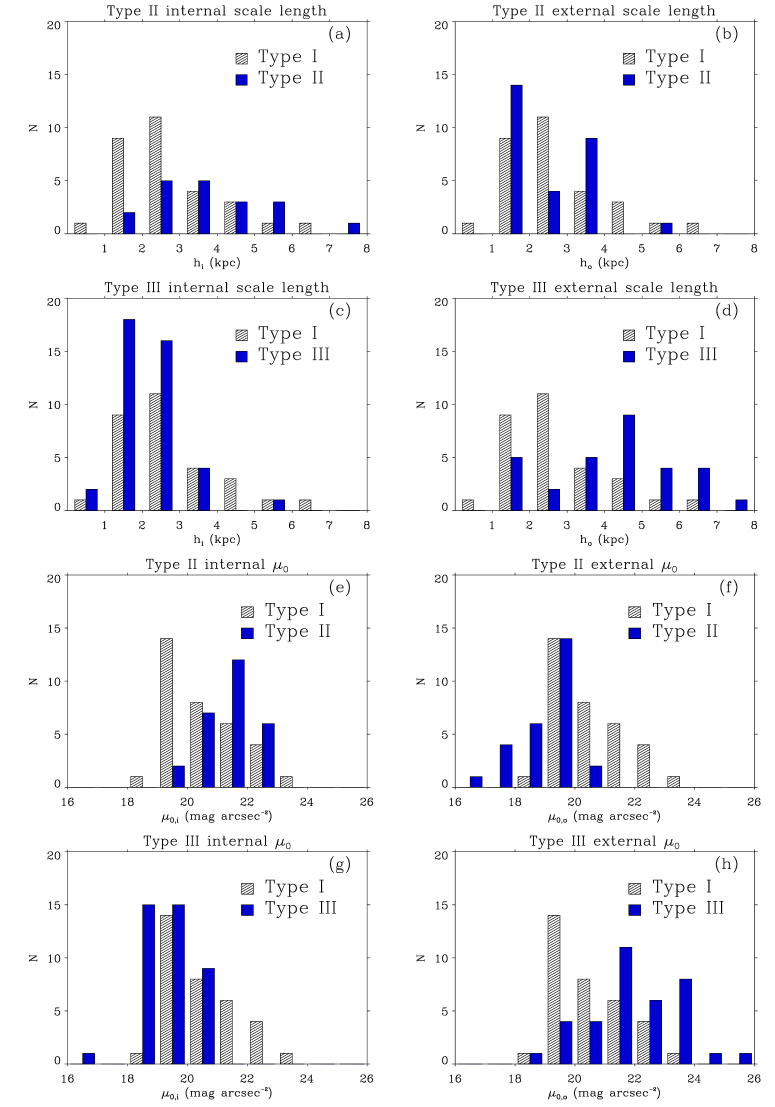
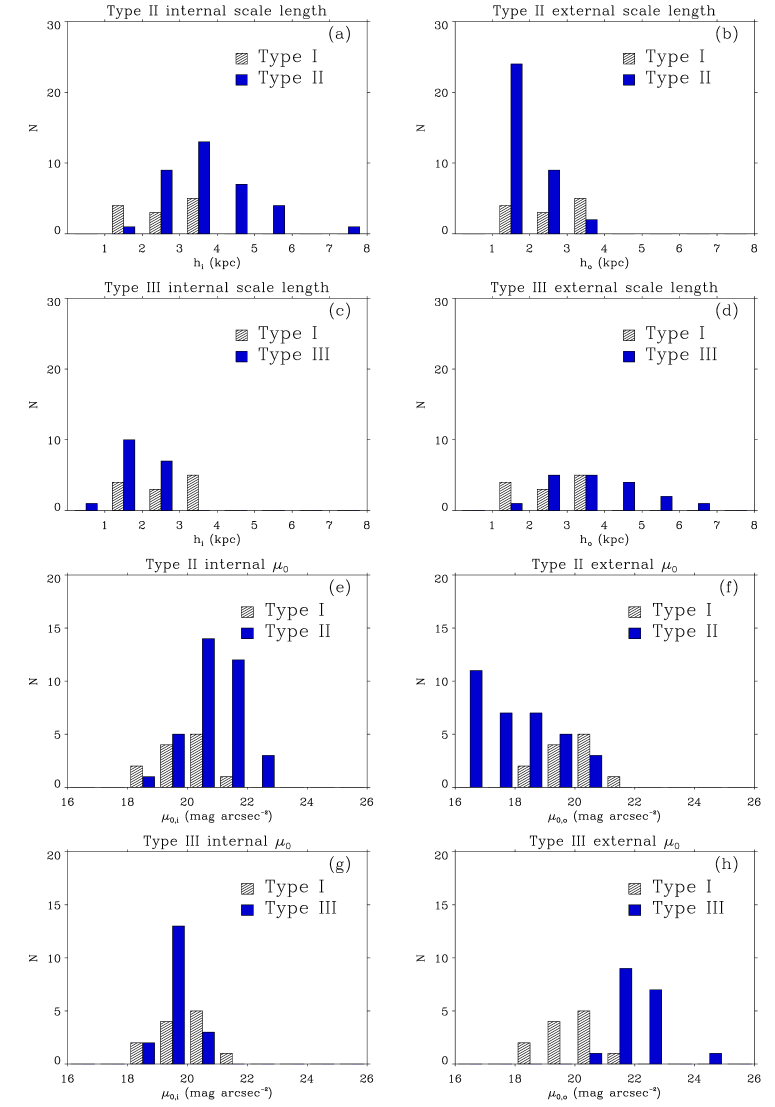
The only potential similarity that we can identify is between Type I profiles and the inner parts of Type II profiles. The latter do tend to have longer scale lengths and fainter values, but K-S tests do not rule the null hypothesis of the same parent population ( and 0.10 for scale lengths of early- and late-type disks, respectively; and 0.14 for values). So scenarios in which (at least some) Type II profiles are merely truncations of what would otherwise be Type I profiles are still plausible. Not surprisingly, the outer components of Type II profiles have significantly shorter scale lengths and brighter values, and do not match Type I profiles ( and 0.0042 for early- and late-type scale lengths; and 0.00025 for ).
Analysis of the late-type spirals in the PT06 sample by Bakos et al. (2008) showed that Type II profiles tend to have color profiles that are bluest at the break (also seen for colors in galaxies out to ; Azzollini et al., 2008). Bakos et al. showed that the stellar surface-density profiles of late-type truncations were smoothed out — sometimes to the point of looking like Type I profiles. The difference between the stellar and the surface-brightness profiles is apparently due to the relative youth of stars near the break radius, with the stellar populations located away from the break (on both sides) being predominantly older. The difference we observe between the parameters of Type I and (many) Type II profiles is at least broadly consistent with this: an excess of light near the break due to younger stellar populations will tend to flatten the inner part of a Type II profile and push its estimated to fainter values.
However, we should note that there do exist individual Type II profiles — in particular, some of the Type II.o-OLR profiles in Paper I — where the inner zone is either extremely flat (very large scale length) or simply not exponential (the latter values are obviously not included in the histograms and statistical tests), so not all Type II profiles can be characterized this way; see Erwin et al. (in prep) for more discussion of the differences in, and possible origins of, Type II profiles.
On the other hand, we can probably rule out common parent populations for Type I profiles and both parts of Type III profiles. The inner components of Type III profiles have shorter scale lengths and significantly brighter values ( and 0.03 for early- and late-type scale lengths; and 0.00092 for ). This suggests that scenarios where Type III profiles are formed merely by adding or redistributing stars at large radii to a pre-existing Type I profile may not explain all such cases. This includes the minor-merger simulations of Younger et al. (2007), where the inner scale lengths of their Type III profiles were very similar to the initial (single-exponential) scale length of the primary galaxy. The scale lengths of Type III outer components do not differ drastically from those of Type I profiles ( and 0.074 for early- and late-types), but the values do: Type III outer components have values mag arcsec-2 brighter ( and ).
Finally, in Figure 13 we plot the break radii (in units of ) against the deprojected rotation velocities (left hand panels) and against absolute blue magnitude (right hand panels); we do this separately for Type II-CT, Type II-OLR, and Type III profiles. Rotation velocities are derived primarily from HyperLeda observed gas rotation velocities (deprojected using our values for the inclination) for spiral galaxies111111Since gas in S0 galaxies is frequently misaligned with respect to the stellar disk (e.g., Kuijken et al., 1996; Davis et al., 2011), we do not attempt to do this for S0 galaxies., supplemented by stellar circular velocities from Neistein et al. (1999) for some of the S0 galaxies from Paper I. Overall trends within each profile type are weak or absent, except possibly for Type III profiles, where the break radius tends to be smaller for higher rotation velocities and luminosities. Type II-CT tend to occur in galaxies with low values of rotation velocity, compared to the Type II-OLR and Type III profiles; the median values of the rotation velocity for each profile type are 125.0, 193.7, and 195.7 km s-1, respectively. This is probably due the higher frequency of classical truncations (II-CT) in late-type spirals, which tend to have lower rotation velocities. As PT06 show (their Figure 11), the majority of Type II profiles in Sc and later Hubble types are II-CT (amounting to % of all Sc and later galaxies); by contrast, only % of the S0–Sb galaxies in Paper I and this paper are II-CT.

6. Summary of the Main Conclusions
In this paper, we have presented azimuthally averaged -band surface-brightness profiles for 47 early-type (S0–Sb) disk galaxies. These galaxies, mostly unbarred, complement and complete a sample of 66 barred S0–Sb galaxies presented in Paper I. The profiles are derived from a variety of images, about half of them obtained with the Isaac Newton Telescope’s Wide Field Camera and most of the rest from the Sloan Digital Sky Survey. The profiles are classified following a scheme first sketched out in Erwin (2005) (based in part on the original scheme of Freeman 1970) and elaborated in PT06 and Paper I: Type I (profile is a single exponential), Type II (profile steepens at large radii, including so-called “truncations”), and Type III (“antitruncations”, where the profile becomes shallower at large radii). A small subset of the profiles are composite “Type II+III” systems, where the inner part of the disk has a Type II shape, with an additional, shallower profile at the largest radii.
Although the sample presented in this paper was intended to be purely unbarred galaxies, careful analysis of the images turned up bars of various sizes and strengths in a total of twelve of the galaxies. This implies that % of optically unbarred S0–Sb galaxies (that is, galaxies with RC3 classifications of S or SA) are actually barred at some level.
The combination of this paper’s galaxies and those in Paper I forms a set of 113 S0–Sb disk galaxies with profile classifications. By combining this with the 70 Sbc–Sdm galaxies with profile classifications in PT06, we can make the first general statements about how common the different disk-profile types are, and their dependence on Hubble type in the local universe. The traditional idea that galaxy disks are either all pure exponential or all radially truncated, already weakened as a result of previous related studies on well resolved nearby galaxy images (Paper I; Erwin et al. 2005; PT06), is clearly not valid. The global frequencies we find are 21% Type I, 50% Type II, and 38% Type III; 8% of the galaxies are composite Type II+III profiles. Including barred and unbarred galaxies, we find strong trends with Hubble type: Type II profiles increase from only % of S0 galaxies to % of the latest-type spirals, while Type I profiles decrease in frequency from early-type disks (% of galaxies) to late-type spirals (only % of galaxies). Comparisons of exponential fits to the different profiles suggests a possible similarity in slope and projected central surface brightness for Type I profiles and the inner parts of Type II profiles. However, neither the inner nor outer parts of Type III profiles resemble Type I profiles, which suggests that antitruncations are not simply excess light added at large radii to Type I profiles.
References
- Adelman-McCarthy et al. (2007) Adelman-McCarthy, J.K., et al. 2007, ApJS, 172, 634
- Adler & Westpfahl (1996) Adler, D. S., & Westpfahl, D. J. 1996, AJ, 111, 735
- Athanassoula et al. (1990) Athanassoula, E., Morin, S., Wozniak, H., Puy, D., Pierce, M. J., Lombard, J., & Bosma, A. 1990, MNRAS, 245, 130
- Azzollini et al. (2008) Azzollini, R., Trujillo, I., & Beckman, J. E. 2008, ApJ, 679, L69
- Bakos et al. (2008) Bakos, J., Trujillo, I., & Pohlen, M. 2008, ApJ, 683, L103
- Bakos et al. (2011) Bakos, J., Trujillo, I., Azzollini, R., Beckman, J. E., Pohlen, M. 2011, Mem. S. A. It. Suppl., 18, 113
- Barway et al. (2005) Barway, S., Mayya, Y. D., Kembhavi, A. K., & Pandey, S. K. 2005, AJ, 129, 630
- Bigiel et al. (2010) Bigiel, F., Leroy, A., Walter, F., Blitz, L., Brinks, E., de Blok, W. J. G., & Madore, B. 2010, AJ, 140, 1194
- Bland-Hawthorn et al. (2005) Bland-Hawthorn, J., Vlajić, M., Freeman, K. C., & Draine, B. T. 2005, ApJ, 629, 239
- Brown, Cai, & DasGupta (2001) Brown, L. D., Cai, T. T., & DasGupta, A. 2001, Statistical Science, 16, 101
- Dale et al. (2009) Dale, D.A., et al. 2009, ApJ, 703, 517
- Debattista et al. (2006) Debattista, V. P., Mayer, L., Carollo, C. M., Moore, B., Wadsley, J., & Quinn, T. 2006, ApJ, 645, 209
- de Grijs (1998) de Grijs, R, 1998, MNRAS, 299, 595
- de Vaucouleurs et al. (1991) de Vaucouleurs, G., de Vaucouleurs, A., Corwin, H. G., Buta, R. J., Paturel, G., & Fouqué, P. 1991, Third Reference Catalogue of Bright Galaxies (New York: Springer-Verlag) (RC3)
- Davis et al. (2011) Davis, T. A., et al. 2011, arXiv:1107.0002v1
- Eliche-Moral et al. (2006) Eliche-Moral, M. C., Balcells, M., Prieto, M., García-Dabó, C. E., Erwin, P., & Cristóbal-Hornillos, D. 2006, ApJ, 639, 644
- Elmegreen et al. (1995) Elmegreen, D. M., Chromey, F. R., & Johnson, C. O. 1995, AJ, 110, 2101
- Elmegreen & Hunter (2006) Elmegreen, B. G., & Hunter, D. A. 2006, ApJ, 636, 712
- Erwin & Sparke (2003) Erwin, P., & Sparke, L. S. 2003, ApJS, 146, 299
- Erwin et al. (2003) Erwin, P., Vega-Beltrán, J. C., Graham, A. W., Beckman, J. E.. 2003, ApJ, 597, 929
- Erwin (2004) Erwin, P. 2004, A&A, 415, 941
- Erwin (2005) Erwin, P. 2005, MNRAS, 364, 283
- Erwin et al. (2005) Erwin, P., Beckman, J. E., & Pohlen, M. 2005, ApJ, 626, L81
- Erwin et al. (2008) Erwin, P., Pohlen, M, & Beckman, J.E. 2008, AJ, 135, 20 (Paper I)
- Eskridge et al. (2000) Eskridge, P. B., et al. 2000, AJ, 119, 536
- Eskridge et al. (2002) Eskridge, P. B., et al. 2002, ApJS, 143, 73
- Fabbiano et al. (1992) Fabbiano, G., Kim, D.-W., & Trinchieri, G. 1992, ApJS, 80, 531
- Ferrarese et al. (2006) Ferrarese, L., et al. 2006, ApJS, 164, 334
- Foyle et al. (2008) Foyle, K., Courteau, S., & Thacker, R. J. 2008, MNRAS, 386, 1821
- Franco-Balderas et al. (2003) Franco-Balderas, A. Hernández-Toledo, H. M., Dultzin-Hacyan, D., & García-Ruiz, G. 2003, A&A, 406, 415
- Freedman (2001) Freedman, W. L., et al. 2001, ApJ, 553, 47
- Freeman (1970) Freeman, K. C. 1970, ApJ, 160, 811
- Garrido (2003) Garrido, O., Marcelin, M., Amram, P., & Boissin, O. 2003, A&A, 399, 51
- Gil de Paz et al. (2007) Gil de Paz, A., et al. 2007, ApJS, 173, 185
- Greusard et al. (2000) Greusard, D., Friedli, D., Wozniak, H., Martinet, L., & Martin, P. 2000, A&AS, 145, 425
- Haynes et al. (2000) Haynes, M. P., Jore, K. P., Barrett, E. A., Broeils, A. H., & Murray, B. M. 2000, AJ, 120, 703
- Heraudeau & Simien (1996) Heraudeau, P., & Simien, F. 1996, A&AS, 118, 111
- Hubble (1926) Hubble, E. 1926, ApJ, 64, 321
- Hunter & Elmegreen (2006) Hunter, D. A., & Elmegreen, B. G. 2006, ApJS, 162, 49
- Huchtmeier (1994) Huchtmeier, W. K. 1994, A&A, 286, 389
- James et al. (2004) James, P.A., et al. 2004, A&A, 414, 23
- Jogee et al. (2002) Jogee, S., Knapen, J. H., Laine, S., Shlosman, I., Scoville, N. Z., & Englmaier, P. 2002, ApJ, 570, L55
- Kassin et al. (2006) Kassin, S. A., de Jong, R. S., & Pogge, R. W. 2006, ApJS, 162, 80
- Kennicutt (1989) Kennicutt, R. C. 1989, ApJ, 344, 685
- Knapen et al. (2000) Knapen, J. H., Shlosman, I., & Peletier, R. F. 2000, ApJ, 529, 93
- Knapen et al. (2004) Knapen, J. H., Whyte, L. F., de Blok, W. J. G., & van der Hulst, J. M. 2004, A&A, 423, 481
- Koopmann & Kenney (1998) Koopmann, R. A., & Kenney, J. D. P. 1998, ApJ, 497, L75
- Kormendy & Norman (1979) Kormendy, J., & Norman C. A. 1979, ApJ, 233, 539
- Kormendy (1982) Kormendy, J. 1982, in Morphology and Dynamics of Galaxies: Twelfth Advanced Course of the Swiss Society of Astronomy and Astrophysics, ed. L. Martinet & M. Mayor (Sauverny: Observatoire de Genève), 113
- Kormendy & Kennicutt (2004) Kormendy, J., & Kennicutt, R. C. 2004, ARA&A, 42, 603
- Kuijken et al. (1996) Kuijken, K., Fisher, D., & Merrifield, M. R. 1996, MNRAS, 283, 543
- Laine et al. (2002) Laine, S., Shlosman, I., Knapen, J. H., & Peletier, R. F. 2002, ApJ, 567, 97
- Landolt (1992) Landolt, A. U. 1992, AJ, 104, 340
- Lauer et al. (1995) Lauer, T. R., et al. 1995, AJ, 110, 2622
- Laurikainen et al. (2004) Laurikainen, E., Salo, H., Buta, R., & Vasylyev, S. 2004, MNRAS, 355, 1251
- Laurikainen et al. (2005) Laurikainen, E., Salo, H., & Buta, R. 2005, MNRAS, 362, 1319
- Martínez-Serrano et al. (2009) Martínez-Serrano, F. J., Serna, A., Doménech-Moral, M., & Domínguez-Tenreiro, R. 2009, ApJ, 705, L133
- Mei et al. (2005) Mei, S., et al. 2005, ApJ, 625, 121
- Mei et al. (2007) Mei, S., et al. 2007, ApJ, 655, 144
- Menéndez-Delmestre et al. (2007) Menéndez-Delmestre, K., Sheth, K., Schinnerer, E., Jarrett, T. H., & Scoville, N. Z. 2007, ApJ, 657, 790
- Michard & Marchal (1994) Michard, R., & Marchal, J. 1994, A&AS, 105, 481
- Michard & Poulain (2000) Michard, R., & Poulain, P. 2000, A&AS, 141, 1
- Möllenhoff & Heidt (2001) Möllenhoff, C., & Heidt, J. 2001, A&A, 368, 16
- Möllenhoff et al. (1995) Möllenhoff, C., Matthias, M., & Gerhard, O. E. 1995, A&A, 301, 359
- Neistein et al. (1999) Neistein, E., Maoz, D., Rix, H.-W., & Tonry, J. L. 1999, AJ, 117, 2666
- Nilson (1973) Nilson, P. 1973, Uppsala General Catalog of Galaxies, Uppsala Astron. Obs. Annals, 5, 1
- Noordermeer & van der Hulst (2007) Noordermeer, E., & van der Hulst, J. M. 2007, MNRAS, 376, 1480
- Peletier et al. (1999) Peletier, R. F., Knapen, J. H., Shlosman, I., Pérez-Ramírez, D., Nadeau, D., Doyon, R., Rodríguez Espinosa, J. M., & Pérez García, A. M. 1999, ApJS, 125, 363
- Pérez (2004) Pérez, I. 2004, ApJ, 427, L17
- Pohlen et al. (2002) Pohlen, M., Dettmar, R.-J., Lütticke, R., & Aronica, G. 2002, A&A, 392, 807
- Pohlen & Trujillo (2006) Pohlen, M., & Trujillo, I. 2006, A&A, 454, 759 (PT06)
- Prugniel & Heraudeau (1998) Prugniel, P., & Heraudeau, P. 1998, A&AS, 128, 299
- Quillen et al. (2000) Quillen, A. C., Bower, G. A., & Stritzinger, M. 2000, ApJS, 128, 85
- Roškar et al. (2008a) Roškar, R., Debattista, V. P., Stinson, G. S., Quinn, T. R., Kaufmann, T., & Wadsley, J. 2008a, ApJL, 675, L65.
- Roškar et al. (2008b) Roškar, R., Debattista, V. P., Quinn, T. R., Stinson, G. S., & Wadsley, J. 2008b, ApJ, 684, L79.
- Sánchez-Blázquez et al. (2009) Sánchez-Blázquez, P., Courty, S., Gibson, B. K., & Brook, C. B. 2009, MNRAS, 398, 591
- Sánchez-Portal et al. (2004) Sánchez-Portal, M., Díaz, Á. I., Terlevich, E., & Terlevich, R. 2004, MNRAS, 350, 1087
- Sandage & Bedke (1994) Sandage, A., & Bedke, J. 1994, The Carnegie Atlas of Galaxies (Carnegie Inst. Washington Publ. 638) (Washington: Carnegie Inst.)
- Schaye (2004) Schaye, J. 2004, ApJ, 609, 667
- Schinnerer et al. (2000) Schinnerer, E., Eckart, A., Tacconi, L. J., & Genzel, R. 2000, ApJ, 533, 850
- Schlegel et al. (1998) Schlegel, D. J., Finkbeiner, D. P., & Davis, M. 1998, ApJ, 500, 525
- Schweizer & Seitzer (1992) Schweizer, F., & Seitzer, P. 1992, AJ, 104, 1039
- Scoville et al. (1988) Scoville, N. Z., Matthews, K., Carico, D. P., & Sanders, D. B. 1988, ApJ, 327, L61
- Shaw et al. (1993) Shaw, M., Combes, F., Axon, D. J., & Wright, G. S. 1993, A&A, 273, 31
- Smith et al. (2002) Smith, J. A., et al. 2002, AJ, 123, 2121
- Sparke et al. (2008) Sparke, L. S., van Moorsel, G., Erwin, P., & Wehner, E. 2008, AJ, 135, 99
- Tonry et al. (2001) Tonry, J. L., et al. 2001, ApJ, 546, 681
- Trujillo & Pohlen (2005) Trujillo, I. & Pohlen, M. 2005, ApJ, 630, L17
- van den Bergh (1976) van den Bergh, S. 1976, ApJ, 206, 883
- van der Kruit (1979) van der Kruit, P. C. 1979, A&AS, 38, 15
- van der Kruit (1987) van der Kruit, P. C. 1987, A&A, 173, 59
- van der Kruit & Searle (1981) van der Kruit, P. C., & Searle, L. 1981, A&A, 95, 105
- van der Kruit & Searle (1982) van der Kruit, P. C., & Searle, L. 1982, A&A, 110, 61
- Weiner et al. (2001) Weiner, B. J., Williams, T. B., van Gorkom, J. H., & Sellwood, J. A. 2001, ApJ, 546, 916
- Willner et al. (2004) Willner, S. P., et al. 2004, ApJS, 154, 222
- Wilson (1927) Wilson, E. B. 1927, J. Amerc. Statist. Assoc., 22, 209
- York et al. (2000) York, D.G., et al. 2000, AJ, 120, 1579
- Younger et al. (2007) Younger, J. D., Cox, T. J., Seth, A. C., & Hernquist, L. 2007, ApJ, 670, 269
Appendix A Surface Brightness Profiles and specific notes for each galaxy
In Figure 14 we present the surface brightness profiles of all the galaxies analyzed in this paper. They are the azimuthally averaged values of the surface brightness made using the ellipse fits discussed above, using calibrated -band images, plotted against position along the semimajor axis in arcsec and also in kpc. In each plot the level of 4.94 is shown as a horizontal dashed line, and , taken from the NED (Nasa/IPAC Extragalactic Database), is shown with a vertical arrow. In the few galaxies where a bar was found to be present the bar length is indicated with vertical dotted lines, and any ring features have their radii noted with vertical dashed-dotted lines. Exponentials were fitted to sections of the surface-brightness profile where the log plots are linear. The boundaries of these sections were defined by eye; the was defined as the point were the two fits intersect. See Section 4.5 of Paper I for a detailed description. The exponential fits are shown as one or more dashed straight lines superposed on the profiles. We now include specific notes on each galaxy. In the following notes when we refer to the bulge of the galaxy we mean the “photometric bulge”; this is the region where the surface brightness profile becomes brighter at small radii than the inward projection of the disk (or the inward projection of the inner part of the disk in the case of Type II and III profiles). For each galaxy, along with the profile type, we list the RC3 classification, the same as shown in Table 1.
IC 356 (III-d; SA(s)ab pec): The disk of this galaxy dominates the light at (2 kpc) from the center of the galaxy. The inner disk clearly shows spiral structure with multiple arms and dust lanes, and the bulge also shows dust lanes. Tightly wrapped spirals are clearly visible outside the antitruncation break, and the ellipticity is roughly constant out to , so this is a clear III-d profile. The profile is similar in some respects to that of NGC 4612 (Paper I), though there is no bar in IC 356.
IC 499 (II.o-CT + III-s; Sa): Though this galaxy is not classified as barred, we find an inner bar of length (1.5 kpc) (Section 4). The profile has a clear Type II break at (6.8 kpc); since this is more than four times the bar radius, we consider this a “classical truncation” rather than an OLR break. Further outside, we find an antitruncation at a radius of (13 kpc). The ellipticity declines from this point outwards, which leads to our classification of Type III-s.
NGC 278 (III; SAB(rs)b): This galaxy appears to host a very weak bar; evidence for this is discussed in Section 4 (see also Garrido, 2003). The wiggles between about 11 and 30 come from a dust ring of radius 11 (0.6 kpc) and tightly wound arms forming a pseudoring at 20 (1 kpc) radius. There is no visible structure in the outer zone, and the galaxy is so close to face-on that we cannot discriminate between disk and spheroid morphologies for the outermost light.
NGC 949 (III-d; SA(rs)b): The bulge shows strong streaks of dust, and is really bright out to 15.6 (830 pc). Further out the disk is smooth and shows no real evidence of spiral structure. The isophotes beyond the break radius appear to have approximately the same shape as those inside (though there may be a slight position-angle twist), so we consider this a III-d profile. As the ellipse fits show a roughly constant ellipticity inwards as far as some 10 arcseconds from the center, it is probable that nominal photometric bulge (r 0 arcsec) is in fact a “disky pseudobulge” (see Kormendy & Kennicutt, 2004; Erwin et al., 2003).
NGC 972 (III-s; Sab): This has a complex bulge with an obvious high dust content, irregularly distributed. The spiral form can just be discerned in the disk. Beyond 43 (4.5 kpc) the disk is smooth, and gives way to two lobes further out (more visible to the North) which may be arm fragments, or an external pseudoring at 90 (9.5 kpc). It is at this point where the antitruncation begins. The ellipticity starts to fall systematically from the break, which accounts for our classification as Type III-s.
NGC 1068 (II.o-OLR; (R)SA(rs)b): This is the closest Seyfert 2 galaxy. Although the RC3 classification is (R)SA(rs)b, it is in fact double-barred. Erwin (2004) summarizes the evidence for both bars, including the inner bar first detected in the NIR by Scoville et al. (1988) and the “oval disk” first noted by Kormendy & Norman (1979); see Schinnerer et al. (2000) for evidence that the latter structure is dynamically barlike. Because the galaxy is so large in angular size, we combined a total of three adjacent SDSS fields. The center is somewhat dusty, so that we used a image to determine the center, and then translated this information to the r image. Although we derive a somewhat higher inclination and a different PA than did PT06, we get the same classification (this is the only overlap of our sample with PT06).
NGC 1161 (I; S00): Franco-Balderas et al. (2003) suggested for this object the classification SAB0 pec. However, we find no evidence for a bar in this galaxy. Their suggestion might be due to the presence of a weak dust lane at 8″ (1.1 kpc) from the center of the galaxy. No break in the profile is seen out to at least 4 scalelengths.
NGC 2300 (I; SA00): Some observers have classified this as an elliptical (Huchtmeier (1994) classified it as E3), but its profile belies this. Asymmetries are seen in the outer disk, notably in the NE where a lobe is seen at ″ (some 24 kpc) from the center, possibly due to an interaction. NGC 2276 is optically close (at 7.6′), though the two redshifts ( km s-1 and km s-1) are sufficiently different to cast doubt on an interaction (Sandage & Bedke, 1994). In the same direction from the center as the extended lobe, but at a slightly smaller radius (90″), Fabbiano et al. (1992) found a source of X-ray emission with no optical counterpart. The profile is of Type I and it reaches 530″ (75 kpc) from the center before reaching our 4.94 uncertainty limit. No break in the profile is seen out to at least 4 scalelengths.
NGC 2460 (II-CT; SA(s)a): This galaxy has a tightly wound multi-armed spiral structure starting deep inside the galaxy. Even in what should be the genuine bulge there is a lot of structure. In the outer zone the two arms join to form a single arm, yielding an unusual appearance. This seems to be associated with the surface brightness truncation. There are no signs of a bar or a ring.
NGC 2775 (III-d(?); SA(r)ab): In this galaxy there is a bright nucleus in an elliptical genuine bulge. The disk extends in a multi-armed structure out to 85″ (7.4 kpc) from the center, where there is a band of dust absorption. From this point outwards the galaxy continues without fine structure forming what may be a stellar halo. This idea is backed up by the isophotes, whose ellipticity declines from 85″ (11.2 kpc) reaching a minimum at 213″ (18.5 kpc). Nevertheless the ellipticity increases again and the surface brightness profile is an almost perfect exponential between 138″ (12 kpc) and 345″ (30 kpc), suggesting that it has disk structure. This is why we have classified the profile as Type III-d(?), with the question mark. The radius where the fine structure ends coincides with the point where the profile breaks, and the antitruncated disk begins.
NGC 2985 (III-d; (R’)SA(rs)ab): The central part of the disk (out to 43″) has a tightly wound multi-armed structure, followed by another weaker spiral which extends out to 107″ (11 kpc). From there on out the spiral arms are more tenuous, forming a pseudo-ring near 68″ (7 kpc). The image quality does not let us trace the profile reliably further out than 312″ (32 kpc), but the profile is clearly Type III. Since the ellipticity at –200″ is only marginally higher than the ellipticity further inside, and since spiral structure is clearly visible beyond the break radius, we classify the profile as III-d.
NGC 3031 (II.o-OLR; SA(s)ab): This galaxy is the nearest in our sample, at 3.6 Mpc. We found a bar of 17″ (300 pc) radius which coincides with a maximum in the ellipticity; this is the small bar previously reported by Elmegreen et al. (1995). Inspection and ellipse-fitting of Spitzer IRAC images (Program ID 1035; Willner et al., 2004) provides evidence for a bar with 136″ (2.4 kpc) as the semi-major axis of maximum isophotal ellipticity () and 216″ (3.8 kpc) as an upper limit on the bar size (), with the latter estimated from the apparent inner ring in GALEX images (Gil de Paz et al., 2007). (The boxy morphology in this region also suggests a bar; see Erwin & Debattista, in prep.) Two outer arms open up quickly from a radius of 250″ (4.4 kpc), forming an incomplete outer pseudoring. We measured the outer pseudoring on both a VLA 21 cm image (Adler & Westpfahl, 1996) and a GALEX NUV image, both available from NED. Since the SE arm of the outer pseudoring is more symmetric, and can be seen to wrap around onto the NW arm, we measured from the nucleus to the center of the SE arm at its maximum extent. In both images, this yielded a semi-major axis of ( kpc), which we adopted as the radius for the outer pseudoring. Since the break in the surface brightness profile is only slightly inside (and a matching bump can be seen on top of the underlying broken exponential at ), this is a good example of an OLR break.
The outer-disk orientation for this galaxy (PA , ) is based on the analysis of H I data in Adler & Westpfahl (1996); almost identical values can be found using the large-scale () isophotes.
NGC 3032 (I; SAB(r)00): Although this galaxy is classified in the NED as SAB(r)00 there is no observable bar; see the discussion in Erwin & Sparke (2003). There is a weak ring between 15″ (1.6 kpc) and 22″ (2.3 kpc), and another peak in ellipticity close to 32″ (3.3 kpc) which could be due to a weak arm-like feature. The nucleus is very bright and point-like. This is the only galaxy for which we combined exposures from different runs. No break in the profile is seen out to at least 5 scalelengths.
NGC 3169 (I; SA(s)a pec): This is a peculiar galaxy, clearly interacting with NGC 3166 (Möllenhoff & Heidt, 2001), as seen from the weak low brightness bridge. Its bulge is large, though with considerable dust, and its spiral structure is filamentary. In spite of its irregularities, the brightness profile is of Type I. Eskridge et al. (2002) did mention “evidence for a weak bar”, but we do not find any sign of this, in agreement with Laurikainen et al. (2004) and Menéndez-Delmestre et al. (2007). No break in the profile is seen out to at least 6 scalelengths.
NGC 3245 (III-s; SA(r)00): The ellipticity profile shows a peak at 15″ (1.5 kpc), which coincides with a ring with inner and outer semiaxis lengths 12″ and 1.9″, respectively. This ring appears diffusely distributed along the minor axis (Michard & Marchal 1994 call it a “curious grey asymmetry”) so that it might perhaps be considered a bar, but this is not clear. The surface brightness profile shows an antitruncation with break point at 120″ (12 kpc). The ellipticity decreases continuously, from at 50″ (5 kpc) to 0.2 at 160″ (16 kpc), so we classify this as Type III-s.
NGC 3455 (II-CT + III-d; (R’)SAB(rs)b): Although this galaxy is classified as SAB, we were unable to find any convincing evidence for a bar. The ellipticity of the isophotes stays roughly constant out to at least 100″ (7.5 kpc), well beyond the antitruncation break ( = 40″); in addition, two spiral arms extend out to 70″ (5.4 kpc). Thus, we are confident that the outer profile is III-d.
NCG 3599 (I; SA00): This galaxy, almost face-on, has a weak ring between 45″ (4.3 kpc) and 71″ (6.8 kpc) and a small bar 11 ″ (1.05 kpc) long (see Figure 3). No break in the profile is seen out to at least 6 scalelengths.
NGC 3604 (III-d(?); SA(s)a pec): The inner region of this galaxy is dusty and slightly asymmetric, while one or more arcs and a spectacular off-center tidal tail dominate the outer regions, indicating that this galaxy is in the midst of an interaction. The outer profile is clearly affected by the arcs and tidal arm; we tentatively classify the profile as III-d only because the outer light is so clearly not anything like a “spheroid”; it is conceivable that the tidal structures could eventually evolve into something more spheroid-like. This antitruncation might possibly be caused by UGC 6306 at 3 arcminutes from NGC 3604, if the measured radial velocity difference (170 km s-1) is due to orbital motion rather than the Hubble flow.
NGC 3607 (I; SA(s)00): The circular dust lane does not appear to have a significant influence on the brightness profile. The central region of the bulge is structured, and may contain an internal disk. However this is not resolvable in our image. No break in the profile is seen out to at least 4 scalelengths.
NGC 3619 (III; (R)SA(s)0+): This is probably a nearly face-on shell galaxy. Four shells, which show up as arcs, can be seen, two at 129″ (14.9 kpc) and two weaker arcs at 185″ (21.3 kpc) and 200″ (23.1 kpc). One of the two inner arcs might be the extension of an arm. This structure makes it difficult to determine the galaxy’s orientation, though the inner isophotes are very round and the galaxy is probably close to face-on. The surface brightness profile is clearly of Type III, with a gradual change of gradient around the break; the outer slope is the region where the shells/arcs show up.
NGC 3626 (I; (R)SA(rs)0+): Although classified as unbarred, this galaxy has a broad bar structure of radial length between 21″ (2 kpc) and 47″ (4.4 kpc) (Figure 5), surrounded by a pseudo-ring at 71″ (6.7 kpc) radius. It also has a secondary bar of radius 4″ (400 pc), along with a ring at 5.2″ (490 pc) and a clear dust ring at 15″ (1.4 kpc). No break in the profile is seen out to at least 6 scalelengths.
NGC 3675 (III-s; SA(s)b): Although Eskridge et al. (2000) say that this galaxy shows a strong bar in the IR, Möllenhoff & Heidt (2001) find no indication of a bar in their JHK observations, and we find no signs of a bar in either the SDSS images or any of the publically available near-IR images. A very bright nucleus is surrounded by a spiral disk, with a dust structure which shows up more strongly in the East, suggesting a possible warp. The profile is Type III with a break at 154″ (9.6 kpc); since the ellipticity decreases steadily out to the limits of our free-ellipse fitting (ellipticity = 0.3 at 270″), we classify this as III-s.
NGC 3813 (II-CT+III-s; SA(rs)b): This is a small spiral, of irregular form with a bright nucleus. In the spiral structure there are bright knots. The brightness profile is quite noisy beyond 160″ (17 kpc). There is a sharp downward break in the profile slope at 43″ (4.6 kpc), making for a Type II profile. However, beyond 70″ (7.5 kpc), still used for the fit, the profile becomes shallower, accompanied by much rounder isophotes (the ellipticity drops from to between 50″ and 65″), so the outer profile is pretty clearly III-s.
NGC 3898 (III-d; SA(s)ab): A bright nucleus sits within a bulge well defined out to 27″ (2.5 kpc) on the SDSS image. From this point outwards we see a clear disk, with a multi-armed spiral structure out to some 90″ (8 kpc). The surface brightness is very low beyond this radius, but there are clear signs of an arm going out to beyond 220″ (20 kpc). This outer zone retains the ellipticity of the inner (). So we consider it an extended part of the disk; thus, this is a Type III-d profile. The break is found at 111″.
NGC 3900 (III-d; SA(r)0+): A ring between 31″ (3.9 kpc) and 47″ (5.9 kpc) bounds the denser part of the disk, surrounded by a fainter zone with a spiral form. The ring shows up as a feature with local changes in gradient on the brightness profile. The isophotes remain highly elliptical beyond the break; for 240″ (30 kpc), they actually become more elliptical, which might hint at a warp or interaction affecting the outer disk. The broad, smooth transition zone between the inner and outer exponentials is similar to that seen for the Type III-d profiles of NGC 3489 and NGC 7177 in Paper I. It could indicate that we are seeing two co-extensive, superimposed components, though the high ellipticity of the isophotes implies that both components have a similar flattening.
NGC 3998 (III-d(?); SA(r)00?): In this object we see a small bar ( 7.8″; 0.6 kpc) and a ring between 30″ (2.1 kpc) and 50″ (3.5 kpc) which produces a slight bump on the brightness profile, and coincides with a peak in the ellipticity at 36″ (2.4 kpc). Sánchez-Portal et al. (2004) claimed that this galaxy has a Freeman Type II disk, with a cut-off at 30″ (2 kpc), but this is probably just the effect of the bump associated with the ring. Our profile extends out to 350″ (23 kpc) and shows an antitruncation with its break point at 120″ (8 kpc). As this galaxy is only slightly inclined, so that its ellipticity is low over the whole of the disk, both inner and outer, it is not easy to say that there is no surrounding stellar halo. However, the fact that isophotes outside the break show no significant decline in ellipticity leads us to classify this as Type III-d(?), albeit with some uncertainty.
NGC 4138 (III-d; SA(r)0+): The bulge of this galaxy is surrounded by a dust lane, which subtends almost a semi-circle at the center. The contrast between this dust feature and the bright spiral structure arising from the bulge can explain the “ring” classification of this object. In the brightest zone, at 20″ (1.3 kpc) radius the ellipticity peaks, and there is slight bump in the brightness profile. The profile as a whole is of Type III, with a sharp change of slope at the break point. Traces of spiral structure can be seen out to approximately the break radius; the ellipticity of the isophotes remains almost perfectly constant out to at least 140″ (9 kpc), making this a clear III-d profile. We agree with Sandage & Bedke (1994) that S0 is not the best classification for this galaxy. However, we want to retain the original classification here for purposes of discussing RC3 Hubble type statistics.
NGC 4150 (III-s; SA(r)00): The innermost isophotes of this galaxy are distorted by a roughly circular dust lane (radius ); there is fine spiral and irregular dust structure at smaller radii, clearly visible in HST images (e.g., Lauer et al., 1995; Quillen et al., 2000). The ellipticity declines steadily for 45″ (3 kpc), which suggests gradual domination of the light by a rounder outer structure, hence the III-s profile classification.
NGC 4223 (III-s(?); SA(s)0+): The bulge is encircled by a very tight spiral forming a pseudo-ring between 35″ and 46″ (2.8 and 3.7 kpc) in radius. Further out, at 80″ (6.5 kpc), we see two extended arms in an elongated S shape, which cause the isophotes to become more elliptical. The isophotes appear to become rounder for 100″ (8 kpc) (though we cannot measure isophote shapes at 190″), which leads us to tentatively classify this profile as III-s.
NGC 4281 (III-s; S0+): The ellipticity of this galaxy rises to a relatively constant plateau value (the latter covering the range 22″ – 55″), and then falls smoothly at larger radii. This suggests an inclined disk embedded in a rounder, luminous spheroid, making this a clear if somewhat extreme example of a Type III-s profile. There is a small dust ring with radius 9″ (1 kpc), which produces a dip in the ellipticity profile.
NGC 4369 (II.o + III; (R)SA(rs)a): Although classified as unbarred, near-IR images show a very strong, short bar (Knapen et al., 2000). In our image we detect a ring between 36″ and 57″. The coincidence of this ring with the Type II break might suggest an OLR break; however, the break is at times the bar radius, which is well outside the usual range seen in Paper I. Consequently, we leave the inner classification at II.o. Since the galaxy is essentially face-on, with no visible evidence for spirals beyond the break at 112″ (9 kpc), we are unable to sub-classify the outer part of the profile.
NGC 4459 (III-d; SA(r)0+): This object has a bright nucleus and a dust ring out to 8″ (620 pc). In fact this “ring” has a very fine multi-armed spiral structure, clearly visible in HST ACS images (see Fig. 7 of Ferrarese et al., 2006). This structure gives the outer part of the bulge (which should really be termed a pseudobulge; Kormendy & Kennicutt 2004) a ring-like appearance and a minimum in the ellipticity, as well as a small jump in the brightness profile. From 55″ (4.3 kpc) to 270″ (21 kpc) the profile is a double exponential, with the break at 120″ (9.3 kpc); since the ellipticity is roughly constant out to at least 200″ (16 kpc), we judge this to be a III-d profile. Michard & Marchal (1994) refer to this galaxy as a “well-known S0 dominated by a disk”.
NGC 4578 (I; SA(r)00): A broad, weak ring between 50″ (4 kpc) and 90″ (7 kpc) produces a clear bump in the surface brightness profile; the underlying profile is clearly Type I. No break in the profile is seen out to at least 6 scalelengths.
NGC 4736 (II.o-OLR; (R)SA(r)ab): This is one of the two cases where we have made a mosaic of INT-WFC images, since this galaxy is very large. Although traditionally classified as unbarred, NGC 4736 has in fact two bars of semi-major axis lengths 170″ (4.2 kpc) and 25″ (0.6 kpc), respectively. The outer bar is weak, and has been classified by some authors as an “oval disk”. However, there is evidence that its dynamical behavior is that of a bar (see, e.g., the discussion in Erwin, 2004). This is a similar system to NGC 1068, although the outer pseudoring in NGC 4736 is relatively faint.
NGC 4750 (III-d; (R)SA(rs)ab): There is a ring formed by tightly wound spiral structure at some 16″ (2 kpc) radius and a similar structure at 45″ (5.5 kpc) radius. There are indications in the optical images of a weak bar of length some 4″ (490 pc); this is consistent with the known nuclear bar detected in the near-IR by Laine et al. (2002). These features produce some waviness in the inner part of the brightness profile. See Section 4 for discussion of the weak, large-scale bar. In the outer zone the disk is elongated N-S, and at the extremities we detect material apparently being accreted onto the disk; the antitruncated profile may be due to this accreting material.
NGC 4772 (I; SA(s)a): Evidence for a very large, faint bar in the galaxy is discussed in Section 4. Our best estimate for the galaxy’s overall orientation using the outermost low S/N isophotes in the SDSS image is consistent with that from Haynes et al. (2000). Given that the bar extends to at least 85″ (6 kpc) in radius, we consider the profile out to 110″ (8 kpc) to be part of the extended excess light associated with the bar (as in other barred galaxies profiles, e.g., NGC 278, 4369, and 4750, or numerous examples in Paper I). Consequently, we fit the profile outside that radius as the outer disk proper; the result is a Type I profile. The broad bump in the profile centered at 200″ (14 kpc) appears to correspond with the outer H I ring reported by Haynes et al. (2000); see the discussion in Section 4 and Figure 8. No break in the profile is seen out to at least 5 scalelengths.
NGC 4826 (III-s; (R)SA(rs)ab): This is the second of two galaxies for which we had to create a complete mosaic from individual fields of the INT-WFC. It has an outer ring of 180″ (6.3 kpc) radius. The strong dust structure within this object causes the brightness profile to be somewhat wavy at 60″ (2 kpc). The ellipticity of the isophotes drops sharply beyond 340″ (12 kpc), coinciding with the appearance of the outer, shallower profile, which is good evidence for a rounder spheroid surrounding the disk proper.
NGC 4880 (II-CT; SA(r)0+): The surface brightness profile shows a truncation at 68″ (6.5 kpc). The inner disk has spiral structure with thick tightly wound but not very well defined arms. Given the dust in the inner disk, it is difficult to completely rule out a weak bar in this galaxy, but in the absence of stronger evidence we consider this galaxy to be unbarred.
NGC 4941 (I; (R)SAB(r)ab): On this image we can see, between 37″ and 73″, a bright annular region which is clearly a disk with strong streaks of dust in front of it. We can also see a broad but weak bar (out to 95″; see Figure 7) at the extremities of which there is an outer ring, between 81″ (5.9 kpc) and 120″ (8.7 kpc) (this bar plus ring structure was termed an “oval disk” by Kormendy & Norman, 1979). The ring produces a bump in surface brightness which is seen above the exponential disk component. Classification of this profile is not straightforward, but overlooking the internal waviness and concentrating on the outer part of the disk we find that we are dealing with a Type I profile. No break in the profile is seen out to at least 6 scalelengths.
NGC 5273 (II-CT + III-d; SA(s)00): Between 26″ (2 kpc) and 44″ (3.4 kpc) there is a ring onto which two inner spiral arms converge. The form of the brightness profile makes this a Type II+III-d, but there is some ambiguity. For example, it is possible that the combination of bulge and ring produces a broad excess in the inner part of the galaxy, superposed on a Type I profile. Although the ellipticity is low, it remains almost constant out to 150″ (11.7 kpc), leading us to classify the outer profile as III-d.
NGC 5485 (I; SA00 pec): This galaxy is classified as peculiar. It has a 40-arcsec-long dust lane which crosses the bulge close to the nucleus, perpendicular to the major axis. Between 112″ (14 kpc) and 178″ (22 kpc) we see a very weak ring, which produces a slight, extended bump in the surface-brightness profile. Although the profile clearly extends beyond 400″ (50 kpc), we have not measured it further out as stray light affects the outer region. No break in the profile is seen out to at least 4 scalelengths.
NGC 5520 (I; Sb): This object has a dusty and asymmetric spiral structure extending out to the edge of the measured disk, but in spite of this the profile is clearly Type I. We think the bump at 12″ is related to the dusty and asymmetric structure. No break in the profile is seen out to at least 6 scalelengths.
NGC 6340 (III; SA(s)0/a): This face-on galaxy shows a faint dust lane near the nucleus coming in from the west. It has several fine tightly wound arms wrapped around the bulge in almost circular structures, and there are a number of dust lanes between the bulge and the rest of the disk; this extends outwards to large radii following an antitruncation. Traces of stellar spiral structure can be seen in unsharp masks out to 85″ (8.3 kpc). Since the galaxy is approximately face-on and we do not see any spiral structure at larger radii, we cannot determine whether the profile outside the break is still part of the disk or not; thus, the profile is an undefined Type III.
NGC 7217 (III; (R)SA(r)ab): The bulge of this galaxy, as normally defined (out to some 52″) is in fact filled with dust structures in loosely spiral forms. At some 72″ (5.2 kpc) out from the center of this galaxy, a tightly wound spiral of filamentary arms forms a pseudo-ring which quickly (at 100″) dissolves into a smooth structure further outside. This regions shows up in the surface-brightness profile as a bump on top of the antitruncation transition. This galaxy is too close to face-on, and too featureless in the outer regions, for us to determine whether the outer light is from a spheroid or a continuation of the disk.
NGC 7457 (III-d; SA(rs)0-?): There is no notable structure in this S0 galaxy, and the brightness profile is quite smooth. It shows an exponential slope beginning at 20″ (1.3 kpc), with a break to shallower gradient at 42″ (2.6 kpc). Outside the (rounder) photometric bulge region, the ellipticity of the isophotes is virtually constant with radius, indicating that we are seeing a disk at all radii.
UGC 3580 (I; SA(s)a pec): In this galaxy we can see considerable structure even within the inner part of the bulge, close to the nucleus. A weak ring of “knots” encircles the bulge at 28″ (2.6 kpc) radius. No break in the profile is seen out to at least 6 scalelengths.
UGC 4599 (III-d; (R)SA00): This is a face-on galaxy with striking ring composed of tightly wound spiral arms. Spiral arms begin at a radius of 40″ (6 kpc) and wind out to form a ring with a radius of 55″ (8 kpc), forming a clear bump in the surface brightness profile. Faint spiral structure can be seen as far out as 200″ (27 kpc) to the southeast; this leads us to classify the outer-disk profile as III-d. Interior to the aforementioned ring, the galaxy is smooth, featureless, and close to circular. Given the complete absence of any barlike structure, it is tempting to speculate that this ring might be a collisionally generated structure, rather than an OLR resonance ring. Because the available -band images were of poor quality, we used a -band image to trace the outer disk profile.


Appendix B Tabulated surface brightness profiles
(The full tables of the brightness profiles for the whole set of galaxies listed in Tables 1, 2, 5, and 6 are available in the on-line version.)
| IC 356 | |
|---|---|
| a | |
| arcsec | mag arcsec-2 |
| 1.01 | 17.13 |
| 1.04 | 17.14 |
| 1.07 | 17.15 |
| 1.10 | 17.17 |
| 1.13 | 17.18 |
| 1.17 | 17.20 |
| 1.20 | 17.22 |
| 1.24 | 17.24 |
| 1.28 | 17.26 |
| 1.32 | 17.28 |