Variations in Structure Explain the Viscometric Behavior of AOT Microemulsions at Low Water/AOT Molar Ratios
S. Sharifi1, P. Kudla2, C. L. P. Oliveira3, J. S. Pedersen4, and J. Bergenholtz5,∗
1 Department of Physics, University of Sistan and Baluchestan, 98135-674 Zahedan, Iran; 2 Structure analysis, Beiersdorf AG, D-20245, Hamburg, Germany; 3 Instituto de Física, Universidade de São Paulo, Caixa Postal 66318, 05314-970, São Paulo, Brasil; 4 Department of Chemistry and iNANO Interdisciplinary Nanoscience Center, University of Aarhus, DK-8000, Aarhus C, Denmark; 5 Department of Chemistry, University of Gothenburg, SE-41296 Göteborg, Sweden
The viscosity of AOT/water/decane water-in-oil microemulsions exhibits a well-known maximum as a function of water/AOT molar ratio, which is usually attributed to increased attractions among nearly spherical droplets. The maximum can be removed by adding salt or by changing the oil to CCl4. Systematic small-angle X-ray scattering (SAXS) measurements have been used to monitor the structure of the microemulsion droplets in the composition regime where the maximum appears. On increasing the droplet concentration, the scattering intensity is found to scale with the inverse of the wavevector, a behavior which is consistent with cylindrical structures. The inverse wavevector scaling is not observed when the molar ratio is changed, moving the system away from the value corresponding to the viscosity maximum. It is also not present in the scattering from systems containing enough added salt to essentially eliminate the viscosity maximum. An asymptotic analysis of the SAXS data, complemented by some quantitative modeling, is consistent with cylindrical growth of droplets as their concentration is increased. Such elongated structures are familiar from related AOT systems in which the sodium counterion has been exchanged for a divalent one. However, the results of this study suggest that the formation of non-spherical aggregates at low molar ratios is an intrinsic property of AOT.
1 Introduction
The anionic surfactant Aerosol OT (sodium bis-(2-ethylhexyl) sulfosuccinate, AOT) together with water and an oil readily forms ternary microemulsions without cosurfactants. Such AOT-based systems form a variety of self-assembled structures in solution; in particular, they exhibit a generous single-phase, water-in-oil (L2) microemulsion region in terms of composition and temperature in which the structure is rather simple and characterized by water droplets in oil with an AOT-stabilized interface. As is well known, the size of the droplets can be controlled by the water-to-AOT molar ratio and the oil concentration provides control of the droplet concentration [1, 2]. L2 phases of AOT and water with liquid alkanes have been the subject of numerous studies [3, 4]. Viscosity measurements have revealed a maximum at low-to-moderate molar ratios as the droplets are gradually swollen by adding water at constant droplet mass fraction [5, 6, 7, 8, 9]. Given that the measured droplet size appears to vary linearly with molar ratio [1, 2] and that interactions are expected to do the same [10], one expects a monotonically increasing viscosity instead of a maximum [8, 9]. In addition to the viscosity, the osmotic compressibility and scaled collective diffusion coefficient exhibit corresponding minima as a function of molar ratio, which persist even on diluting the microemulsions down to concentrations where only single-particle properties and pair interactions matter [9]. Since the relatively low intrinsic viscosities measured suggested close to spherical droplets, the origin of the maximum was attributed to increased attractive interactions between droplets that are close to spherical in shape [8, 9, 11, 12].
Several other properties are known to change irregularly at these lower molar ratios. The apparent molar volume of the solubilized water deviates significantly from the bulk value [13, 14] and the apparent AOT head group area varies strongly with molar ratio in this composition region [15, 16]. Water motion is restricted [17] and interfacial and core water fractions can be identified at molar ratios near the viscosity maximum [18, 19]. The conclusion that attractions cause the viscosity maximum as well as the associated minima in the second virial coefficient and the dilute collective diffusivity rests on droplets being spherical in shape. The modest intrinsic viscosities measured do not deviate much from the sphere value [20, 8, 9] and have consequently given little cause for concern in this regard. However, in terms of more detailed structural characterization, the composition regime where the viscosity maximum is observed has been mostly overlooked as previous small-angle X-ray and neutron scattering studies have focused primarily on micelles [21] and swollen systems at higher molar ratios [22, 23, 24]. More recent studies using self-diffusion NMR [25] and computer simulations [26] do give some cause for concern as according to them non-spherical droplet shapes seem to be the rule rather than the exception at low molar ratios. Moreover, microemulsions with cylindrical droplet structures are predicted from mean-field theory for systems with an actual radius of curvature different from the preferred one [27].
Similar viscosity maxima, although far more extreme, are observed in lecithin/oil systems upon addition of small amounts of water, where these systems produce highly viscoelastic gels in a narrow interval of water-lecithin molar ratios ranging between 1 and 12 depending on the continuous phase [28]. In contrast, at similar molar ratios the AOT systems remain viscous, Newtonian liquids and exhibit a modest viscosity enhancement at the peak. Nevertheless, given that the viscoelasticity and the viscosity maxima of the lecithin systems are caused by a water-induced structural transformation to polymer-like aggregates [28, 29], it seems an examination of the structure of the AOT microemulsions in the composition regime of the viscosity maximum is warranted.
It is against this background that we set out to perform a systematic structural study of AOT/water/decane microemulsions using small-angle X-ray scattering (SAXS) at compositions corresponding to those where the viscosity maximum is observed. The purpose is to examine whether the viscosity maximum is caused by increased attractions among nearly spherical microemulsion droplets, as concluded in the past [8, 9, 11, 12], or whether structural changes need to be accounted for. To this end, we seek for ways to reduce or remove the viscosity maximum. Exchanging the alkane continuous phase for CCl4 accomplishes this and so does addition of sufficient amounts of salt. Here we have used tetrabutyl ammonium chloride (TBAC), where TBA+ has a 20-fold higher affinity for the AOT molecule than does the usual Na+ counterion [30]. Comparison between microemulsions with and without TBAC, leading to microemulsions with and without a viscosity maximum, allows for identifying structural features in the SAXS spectra tied to the viscosity maximum. In short, the data are consistent with droplets undergoing gradual cylinder-sphere transitions with increasing and cylindrical rather than globular shapes being favored with increasing droplet concentration. Considered in a broader context, the results suggest that such shape changes, at least qualitatively, are an intrinsic property of the AOT molecule rather than being intimately connected to the choice of counterion [31, 32, 33, 20, 34].
2 Experimental
Sodium bis-(2-ethylhexyl) sulfosuccinate (99% purity), tetrabutylammonium chloride, and n-decane were obtained from Sigma-Aldrich and the carbon tetrachloride used was from Riedel-de Haën. All chemicals were used as received and MilliQ water was used in preparing all samples. Microemulsions were prepared by weight, in terms of the mass fraction of droplets (AOT and water) and the molar ratio =[H2O]/[AOT], and all experiments were done at a temperature of 20∘C. In cases of salt-containing microemulsions, aqueous salt solutions were used in place of water. Samples were filtered using 0.2-m Teflon filters (Gelman).
Density measurements were made using a precision density meter (DMA 5000, Anton Paar) on oil dilution series of microemulsions at constant H2O/AOT and TBAC/AOT molar ratios. The reciprocal sample density behaved in all cases as a linear function of the droplet (AOT+H2O+TBAC) mass fraction, which indicates that the mixture of droplets and solvent behave as an ideal mixture. This was used to extract a droplet density, which was used to determine sample densities required for converting the kinematic viscosity from the viscometry measurements to an absolute viscosity as well as to convert droplet mass fractions to droplet volume fractions. Viscosity measurements were carried out using three dilution-type Ubbelohde capillary viscometers (Cannon Instrument Co.), covering roughly the viscosity range 1.6-35 mPas. The temperature of the viscosity measurements was controlled to within C by keeping the viscometers submerged in a constant-temperature water bath. Several solutions were examined with rotational rheometry (Paar Physica MCR300) using a double-gap concentric cylinder measuring system in controlled strain mode. Without exception they behaved as Newtonian liquids over an extended range of shear rates, confirming the findings of Peyrelasse et al. [7].
Small-angle X-ray scattering (SAXS) measurements were performed using the pinhole SAXS instrument at the University of Aarhus [35]. The instrument consists of an X-ray camera (NanoSTAR, Bruker AXS) with a rotating anode X-ray (Cu Kα radiation) source, cross-coupled Göbel mirrors, collimation using three pinholes and an evacuated beam path, and a 2D position-sensitive gas detector (HiSTAR). In the current experiments pinholes were used to give a range of scattering vectors as Å, where is the modulus of the wave vector, is the scattering angle, and Å is the X-ray wavelength. Samples were held in 1 mm quartz capillaries, which were thermostated to a temperature of 20∘C. Scattering data were corrected for detector efficiency and for spatial distortions, and azimuthally averaged. The scattering from n-decane in the same capillaries was measured as background and was subtracted to yield the excess scattering as a function of for microemulsion samples. In addition, data were converted to an absolute intensity scale by using water as a standard.
3 Results and discussion
3.1 Viscometry
Building on early studies by Rouviere et al. [5, 6], Peyrelasse and co-workers showed that for a range of hydrocarbon oils the viscosity of AOT w/o microemulsions exhibits a maximum as a function of water/AOT molar ratio at constant droplet concentration [7]. The maximum occurred at , which is a region where the behavior of the entrained water deviates strongly from that of bulk water. In other words, there is some question as to whether the system should be thought of as a micellar system with bound water or a microemulsion system with solubilized water. Moreover, they observed a strong correlation between the viscosity maximum and the conductivity percolation threshold [7], something that was rationalized later in terms of percolation theories of attractive spheres [36].

In the study by Peyrelasse et al. [7], the choice of oil had little effect on the viscosity. However, past dilute viscosity measurements [37, 8] suggest that using CCl4 as continuous phase should have a strong effect on the viscosity of non-dilute AOT microemulsions. Figure 1 shows the relative viscosity as a function of droplet concentration for microemulsion droplets in decane and CCl4 at the same molar ratio, [H2O]/[AOT]=6.7. As seen, the viscosity increases far more rapidly with droplet volume fraction for AOT/H2O/decane microemulsions than for AOT/H2O/CCl4 microemulsions. In fact, the relative viscosity of AOT/H2O/CCl4 microemulsions agrees quite well with the Quemada equation [38], , which captures rather well the viscosity of dispersions of somewhat polydisperse hard-sphere particles [39]. This difference in viscosity of the two systems persists along the oil-dilution line in the phase diagram down to very low droplet concentrations [8]. Similar measurements at varying molar ratio produce the data shown in the inset to Fig. 1. As seen, a pronounced maximum in viscosity appears for intermediate values of the molar ratio, centered around , which has been the subject of previous study [5, 6, 7, 8, 9, 11, 12]. As also seen, the maximum is removed on exchanging decane for CCl4, consistent with measurements under dilute conditions [8]. In the AOT/water/decane case the maximum is followed by another increase in viscosity at higher molar ratios, which is not observed for, e.g., AOT/water/heptane microemulsions at the same temperature. This increase is connected to the proximity of the lower critical solution curve [22], which is approached by increasing the molar ratio at constant volume fraction of droplets. Similar maxima at low molar ratios are reported for a range of liquid alkanes [7]. However, with CCl4 as the continuous phase the maximum is eliminated, showing that solvent penetration in the surfactant tail region is an important factor for the observed behavior [40].
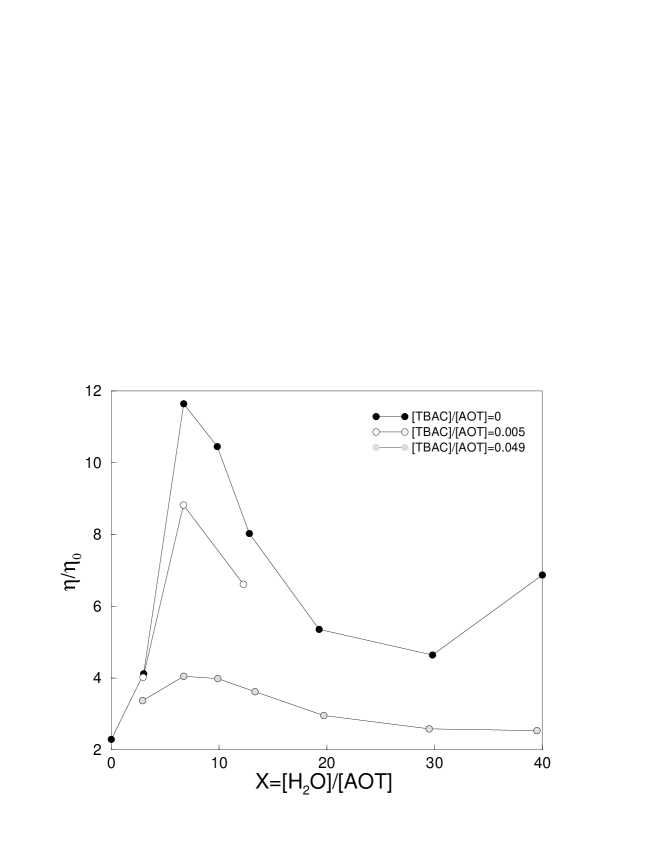
Salt has a profound effect on the viscosity in these systems, which was reported on by Rouviere et al. [6]. The tetrabutyl ammonium cation TBA+ of the chloride salt (TBAC) has been found to exhibit about a 20-fold higher affinity for AOT molecules than the usual Na+ counterion [30] and similar salts are known to have a strong effect on water solubilization in AOT microemulsions [41]. To perturb the structure and interactions in the system, we add varying amounts of TBAC. As seen in Fig. 2, where we show the relative viscosity of AOT/H2O/decane microemulsions at a droplet mass fraction of 0.3, addition of TBAC results in a reduction of the viscosity maximum. Little is left of the maximum on reaching TBAC/AOT ratios of about 0.05, which corresponds to a TBAC concentration in the aqueous pools of the droplets of roughly 0.4 M. Note also that as TBAC is added the viscosity maximum is reduced in magnitude without shifting in position to other H2O/AOT molar ratios.
3.2 Small-angle X-ray scattering results
The viscosity maximum is eliminated either by using CCl4 as a continuous phase or by dissolving TBAC in the droplet interiors. Presumably both alterations lead to different aggregate structures and/or changes in inter-aggregate interactions and with SAXS measurements we expect to be able to distinguish between these two possibilities. Unfortunately samples rich in chlorine, like the AOT/H2O/CCl4 microemulsions, cannot be studied by SAXS because of strong absorption. Therefore, the systematic SAXS study undertaken here has been made on decane-based microemulsions, varying both in terms of molar ratio and droplet volume fraction. The study included molar ratios around the viscosity maximum, , 6.8, 9, and 12.2. In addition, we examine also TBAC-containing samples at , which, as seen in Fig. 2, exhibit only a very weak viscosity enhancement.
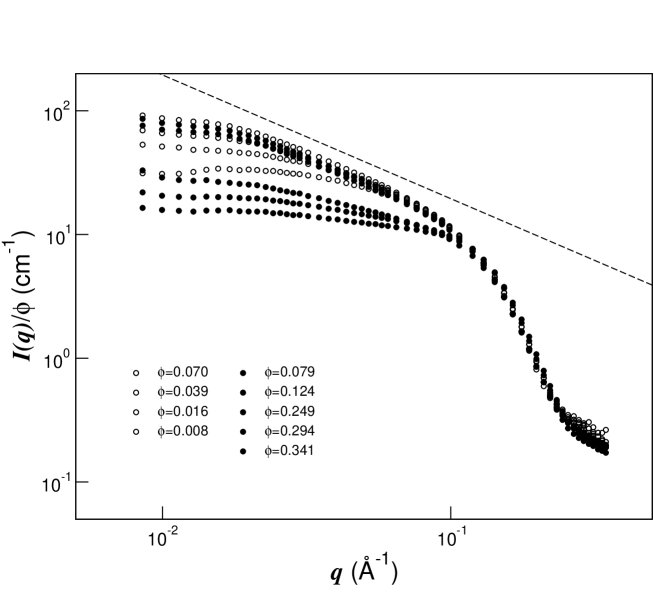
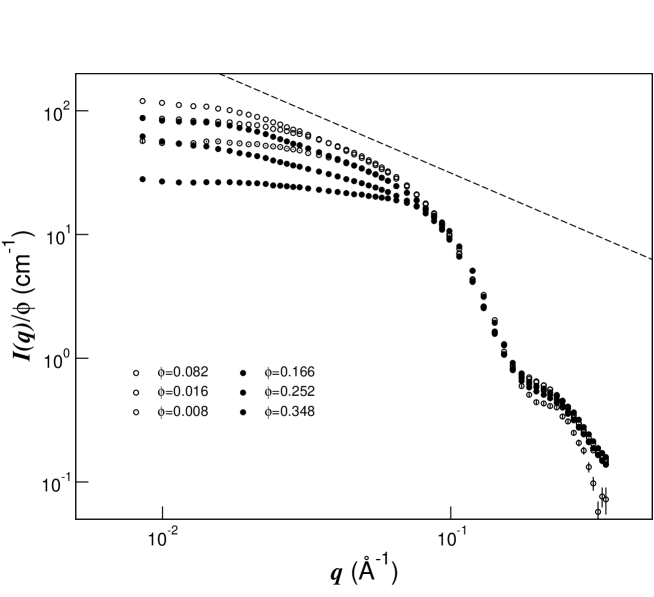
In Fig. 3 SAXS results are shown for salt-free microemulsions at . This corresponds to the molar ratio of the viscosity maximum in Figs. 1 and 2. The intensity as a function of wavevector has been scaled by the droplet volume fraction, which is applied to account for the expected leading-order, linear increase of the intensity with the concentration of scatterers. The figure shows that the scaled intensity initially grows with concentration. Such an increase points to changes in aggregate structure with concentration or possibly a negative second virial coefficient. Since the scaling results only in a fair collapse of the data at high , where only form factor effects are at play, the former seems more likely. However, if so, the bend in the intensity at the highest , being positioned roughly at the same independent of concentration, suggests that some length scale is preserved in the process and that the structural changes occur mostly in one or two dimensions. The increase in continues until a regime of power-law scattering, with , develops at intermediate wavevectors, a telltale sign of linear or locally linear aggregates [42]. It sets in at a crossover or overlap volume fraction of about 7% and at this point the trend also reverses and the scaled intensity begins to decrease gradually with increasing concentration. The region of power-law scattering remains beyond , but it is now characterized by a smaller exponent. Turning to samples of higher molar ratios, corresponding to compositions where the viscosity has dropped relative to the maximum value in Fig. 1, qualitatively similar behavior is observed. Taking as an example, Fig. 4 shows the scaled intensity as a function of . As for the microemulsions, increases initially with increasing concentration, but now the region of scattering is less pronounced. Again, on varying the concentration some changes at large are observed, suggesting that structural changes occur at the droplet level.
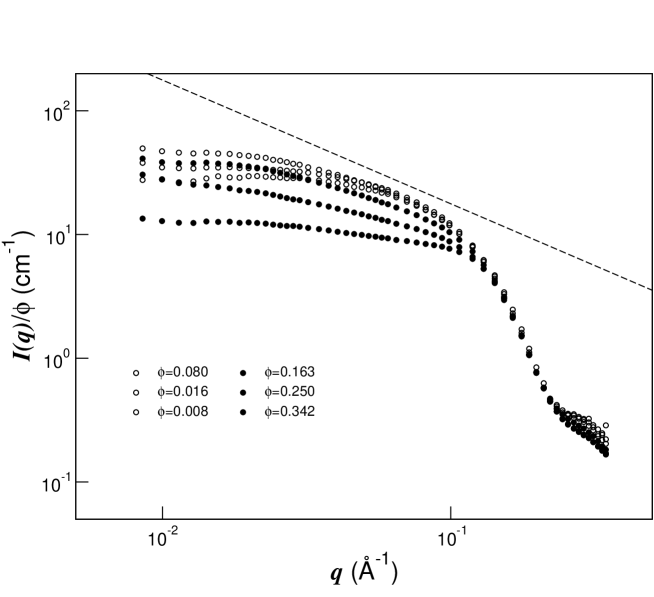
Aside from changing the composition via the molar ratio to move away from the peak in viscosity, one can introduce TBAC to suppress the viscosity enhancement altogether. In Fig. 5, TBAC has been introduced at a concentration that nearly eliminates the maximum in viscosity in Fig. 2, [TBAC]/[AOT]=0.05. The same initial increasing trend in with increasing concentration is observed as is the ensuing decrease beyond . Some power-law scattering is observed over limited ranges of at the higher volume fractions, but a region of scattering is not present. Also, the scattering from samples at (data not shown) did not contain any power-law scattering at all. It follows that we can conclude that for microemulsions at the viscosity maximum the scattering intensity increases strongly initially with concentration and eventually presents a clear-cut region where . This behavior points to a reorganization of aggregates with increasing concentration into elongated structures.
3.3 Analysis of scattering results
Extracting precise structural information from the scattering data requires quantitative modeling, usually done by model fitting [43]. In many cases model-independent analyses can also be used very effectively [44, 45, 46, 47, 48]. In this work we have only pursued model fitting to a limited extent because of the lack of an appropriate structure factor model that captures the coupling between positional and orientational correlations in systems with a significant degree of particle form anisotropy over an extended range of concentration.
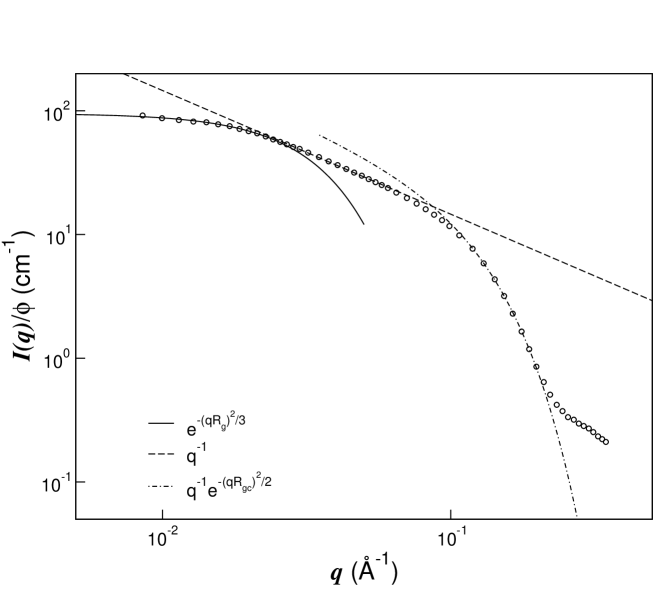
Since the instrumental SAXS setup delivers data that extend almost two orders of magnitude in , it is worthwhile to begin with an asymptotic analysis. In Fig. 6 we illustrate three regimes of which seem to accommodate such an analysis. At small the scattering is only sensitive to the overall dimension of the scattering particles and we expect from Guinier’s law that the intensity should behave as , where is the radius of gyration. For higher concentrations we define an apparent correlation length , viz. [49], which crosses over to under dilute conditions. For cylindrical particles of length and cross-sectional radius with , the Guinier regime in principle requires . At intermediate we observe that the intensity varies inversely with , pointing to cylindrical aggregates. We dismiss the possibility that this power-law scattering comes from highly random, fractal aggregates of spherical droplets simply because the microemulsions here are equilibrium systems; such fractal structures in dispersions of colloidal particles result from irreversible, non-equilibrium aggregation processes [50]. For cylindrical structures in the small-, Guinier regime we expect the following to hold in the dilute limit
| (1) |
where the radius of gyration, , and is the electron density difference between the homogeneous particle and the solvent. It follows that for sufficiently large aspect ratios both and are linearly proportional to the cylinder length. At larger the scattering no longer depends on the actual cylinder length and provided that one might hope to find a regime within which [42, 51, 29, 52]
| (2) |
where is a radius of gyration of the cross-sectional area. Indeed, in the scattering data for in Fig. 3 we find a small linear regime on graphing versus and determine Å. For a circular droplet cross-section this corresponds to a radius of about 16.1 Å. A similar analysis for varying at this revealed no systematic variation in , suggesting that droplets elongate without changing their cross-section significantly. More detailed analyses of the cross-sectional structure of surfactant micelles have been done using small-angle neutron scattering measurements combined with contrast variation [47]. One slight worry is that Eq. 2 is not able to capture the rather abrupt cross-over in Fig. 6 to a dependence, but the analysis here is strictly speaking restricted to homogeneous, monodisperse cylinders under neglect of concentration effects.
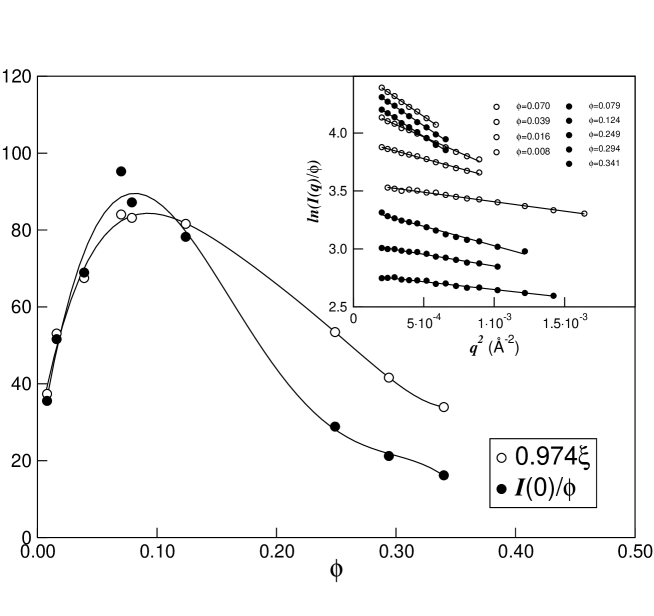
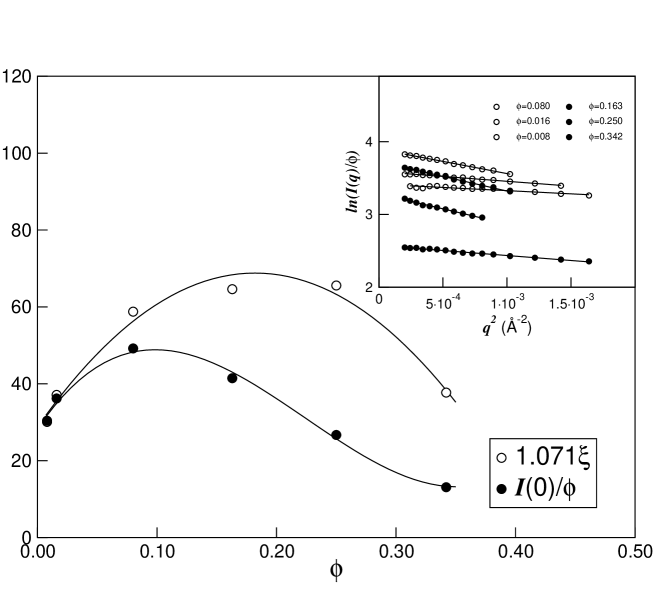
As pointed out in connection with Eq. 1, for systems that are not too concentrated we expect both and to be roughly proportional to the cylinder length provided the axial ratio is significant. To examine whether this holds for these microemulsions, we show in Fig. 7 the results of extracting and from a Guinier analysis of the data in Fig. 3, i.e. as the intercept and slope on a vs. graph of low--limiting data. For comparative purposes the correlation length in Fig. 7 has been shifted by a multiplicative factor. One observes that as a function of both and pass through a maximum at . In addition, the fact that they track each other closely for volume fractions below suggests first of all that for this range of concentrations; secondly, it points to the low- scattering being caused by droplet growth into elongated, perhaps cylindrical aggregates, which proceeds by increasing at roughly constant . On adding the salt TBAC to the microemulsions, the same analysis yields the results in Fig. 8. The intensity and correlation length are both reduced for most volume fractions relative to the corresponding values for the salt-free microemulsions at . Although maxima are observed again in both and as functions of , the location of the maximum in correlation length is shifted to larger compared to in the absence of salt. In addition, except for the two most dilute microemulsions, and do not exhibit the same volume fraction dependence, suggesting very limited cylindrical growth and small aspect ratios on the whole.
The behavior in Figs. 7 and 8 is qualitatively the same as for polymer-like reverse micelles, though the limited growth here is in no way comparable. Similarly to the microemulsions in this study, however, the growth in those systems is triggered by addition of water [28, 29, 53] and an extreme viscosity maximum appears as well as a function of molar ratio [28]. Similar maxima as in Fig. 7 have been interpreted as reflecting the crossover from dilute to semi-dilute concentration regimes [54]. For rigid cylinders the volume fraction at which their rotational motion starts to become impeded due to concentration effects is , but static properties are not expected to be too seriously affected until excluded-volume effects become significant at another volume fraction, [49]. With from Fig. 7, regardless of whether or is assigned as the overlap concentration, we can expect axial ratios of close to for microemulsions with . In other words, it is indeed a rather modest degree of cylindrical growth.
To extract a more precise measure of the initial droplet growth, we attempt to model some of the data quantitatively. Anticipating droplet axial ratios of , this is a difficult task because orientational correlations are expected to have to be taken into account. Models that incorporate orientational correlations are available for slender rigid rods [55, 56, 57, 58, 59], but they are in severe disagreement with the experimental data in Figs. 3-5 at large due to their tending to the form factor of an infinitely thin rod. To remedy this situation, we follow the procedure suggested by Weyerich et al. [60] for approximately accounting for finite-thickness effects. The scattering intensity is expressed as
| (3) |
where is the number density and is the structure factor for slender hard rods with as the slender rod form factor. The dilute-limiting behavior is then , where we take as the orientationally-averaged form factor of core-shell-structured cylinders [61],
| (4) | |||||
where the inner and outer cylinder radii are given by and , respectively, both proportional to the total cylinder cross-sectional radius . In addition, , is the first-order Bessel function of the first kind, is the electron density difference between the core and shell of the cylinder, and is the electron density difference between the shell and the solvent. In Eq. 4 the cylinder radius is taken as polydisperse. We assign a log-normal distribution [62], , characterized by a mean cross-sectional radius and a standard deviation , to govern the polydisperse radius. For simplicity, the core and core-plus-shell radii are assumed proportional to the total radius so that only a single polydispersity index, , is needed.
Inspection of the SAXS data in Figs. 3-5 shows no evidence of a structure factor peak in the intensity. Instead, beyond the overlap concentration the scattering at small is increasingly suppressed as the concentration is increased. At still higher concentrations, peaks in the intensity do appear [8]. This behavior is qualitatively consistent with the expected behavior of slender hard rods under relatively dilute conditions [57, 58]. Guided by this observation we have used the structure factor of slender hard rods, derived by van der Schoot and Odijk [57], which is given by
| (5) |
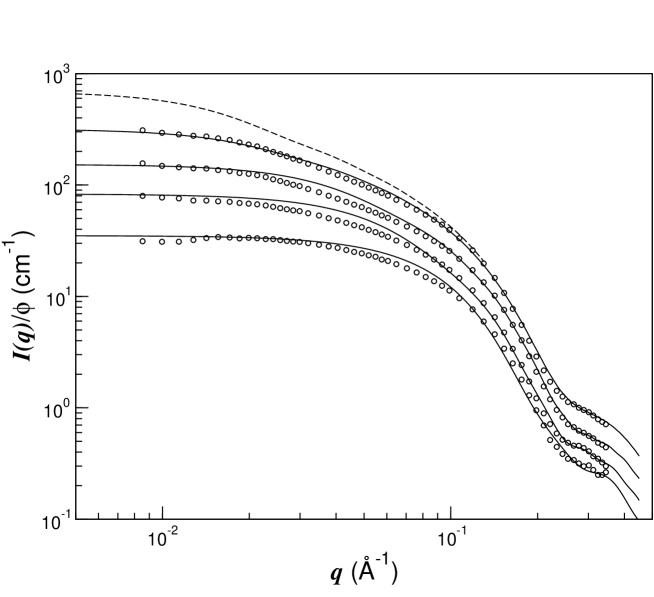
where , is the form factor of a slender rod, given in terms of the sine integral , and . Polydispersity in cylinder length is neglected because, as observed by Weyerich et al. for unimodal distributions [60], the polydisperse slender hard-rod structure factor [58] is insensitive to polydispersity in length. In keeping with the limitations of using the slender hard-rod structure factor of van der Schoot and Odijk, we restrict attention to concentrations up to the overlap concentration, for , where we see the largest droplet growth. In Fig. 9 these data are shown along with fits of Eqs. 3-5. In the fits we have constrained the parameters so that and are fulfilled, with and the volume fractions of water and water plus surfactant, respectively. Furthermore, the cylinder radius that enters the monodisperse hard-rod structure factor has been equated with the average radius used in . The necessary integrations in Eq. 4 were completed numerically using Simpson’s rule.
The analysis is complicated by the change in basic structure of the droplets. Nevertheless, as shown in Fig. 9, model fits can be produced that are in reasonable accord with the experimental data. The results are consistent with the asymptotic analysis and reflect a significant elongation with increasing droplet volume fraction. In going from the most dilute to the most concentrated microemulsion in Fig. 9, the cylinder length increases from 45 up to 270 Å with very slight changes in the cross-sectional parameters. This growth corresponds to axial ratios increasing from 2.8 to 19.2. As seen in Fig. 9, the agreement between model fits and data improves with increasing axial ratio, which we attribute to the use of a slender-rod structure factor. Though structure factor effects are completely negligible at the lowest volume fraction in Fig. 9, the analysis suggests that they are quite significant at higher volume fractions. To illustrate the extent of the effect of the structure factor, we show in Fig. 9 essentially what amounts to the form factor, , for the most concentrated sample. The ratio between the model fit and this quantity is in Eq. 3 at this concentration. It is worth noting that the structure factor matters up to fairly large values of .
The asymptotic analysis produced a cylinder thickness of about 16.5 Å, but in the model fits of Fig. 9 smaller values in the range 11.5-11.9 Å were used. We attribute this discrepancy to the implicit use of a homogeneous rather than a core-shell cylinder model in the asymptotic analysis. As a consequence, is an apparent value weighted by the cross-sectional electron density distribution in the droplet [52]. Some additional comments regarding the fits are in order. The model fits in Fig. 9 correspond to the core-shell cylinder model in Eq. 4 with contrast factors and . Comparison with results of similar analyses done at larger molar ratios [23, 24], , shows that the fits here require a broader interfacial region in terms of the shell thickness, . At larger this could be set to a small value, based on a large-, Porod analysis [63], with a large value of 850 /nm3. In contrast, the model fits here are generated with a 5 Å shell thickness, close instead to that deduced from small-angle neutron scattering on AOT micelles [21] and used by others [64], and a correspondingly weaker contrast of the shell, 440-480 /nm3. Similarly broad interfaces result also on changing the cylindrical core-shell form factor in Eq. 4 to other basic core-shell structures, such as spheres or prolate ellipsoids. The quality of the fits at the lowest in Fig. 9 did not improve with such a change in droplet structure.
Eicke and Rehak [15] and Maitra [16], based on a spherical droplet model, determined an area per surfactant headgroup that was found to decrease dramatically with decreasing molar ratio, a trend that seems to extrapolate to a value far below that obtained from small-angle neutron scattering measurements on micelles [21]. Furthermore, Maitra suggested a model for AOT microemulsions at low values in which the surfactant-water interface is overcrowded by surfactant, effectively reducing the area per headgroup. This was speculated to give rise to an increased attraction that in turn caused the viscosity enhancement [8]. Considering changes in droplet structure instead, we determine the area per headgroup as , which yields values ranging from 49 Å2 at the lowest to 56 Å2 at the highest in Fig. 9. This range of values is more in line with scattering results on AOT micelles [21] and microemulsions at larger [22, 23, 24]. In other words, the trend of a decreasing area per headgroup with decreasing molar ratio [16, 15] is likely a consequence of constraining the droplets to be spherical in shape. In a similar way, it is possible that a change in aggregate structure from globular to cylindrical can also explain irregular trends in the apparent molar volume of solubilized water, as conceived by Yoshimura et al. [14].
Measurements at similar molar ratios to the ones studied here have been carried out on related AOT microemulsions where the usual Na+ counterion has been exchanged for a variety of monovalent and divalent cations [31, 32, 33, 20, 34]. As in the present measurements, power-law, scattering has been used to infer elongated, rodlike droplets in many of these systems and the tendency to form cylindrical droplets has been correlated with the hydrated volume of the counterion [33, 20]. Moreover, it is emphasized that the usual AOT system, from the Na-salt, forms only spherical aggregates in the L2 phase regardless of molar ratio along with a few other AOT systems, such as AOT with Ca2+ counterions. However, recently Pan and Bhatia [12] found a viscosity maximum for AOT microemulsions with Ca2+ counterions at somewhat larger values of than those in Fig. 2. If there are composition ranges within which droplets based on the usual AOT form cylindrical structures then one is led to believe that such composition ranges also exist for AOT microemulsions with, for instance, Ca2+ counterions. Indeed, Pitzalis et al. [25] conclude, based on NMR self-diffusion measurements, that non-spherical shapes are rather the rule than the exception at low molar ratios for AOT microemulsions with Na+ and Ca2+ counterions. In addition, nuclear spin relaxation measurements, done at somewhat larger molar ratios than the viscosity maximum, seem to extrapolate to sizeable shape anisotropies at the molar ratios of the viscosity maximum [65]. With scattering data as function of both molar ratio and droplet concentration in hand (see Figs. 3-5) one sees that the scattering regime is easily missed, since it only appears clearly at certain volume fractions.
4 Conclusions
Viscosity measurements have been conducted on AOT/H2O/decane microemulsions confirming a maximum in the viscosity as a function of H2O/AOT molar ratio. Exchange of the continuous oil phase for carbon tetrachloride and sufficient addition of salt eliminates the viscosity maximum. Systematic small-angle X-ray scattering measurements have been conducted and analyzed. They reveal that these microemulsions produce globular aggregates at very low molar ratios. At low-to-intermediate molar ratios they yield somewhat anisotropic, elongated structures, presumably due to incomplete hydration of the headgroup and packing constraints imposed, e.g., by headgroup interactions and oil penetration of surfactant tails. In addition, the structures grow in length with increased concentration of water and surfactant, as anticipated already by Wennerström and Lindman [66]. At still larger molar ratios less elongated droplets are produced. The viscosity of the microemulsions appears to reflect directly, albeit qualitatively, the degree of structural anisotropy in this region of molar ratio. The results suggest that the AOT molecule, regardless of the identity of the counterion, preferentially packs into non-spherical aggregates at lower molar ratios. However, the precise composition range where this occurs and the degree of structural anisotropy is no doubt a function of the identity of the counterion.
Acknowledgment
Financial support by the Swedish Research Council is gratefully acknowledged.
References
- [1] M. Zulauf, H.-F. Eicke, J. Phys. Chem. 83 (1979) 480.
- [2] R. A. Day, B. H. Robinson, J. H. R. Clarke, J. V. Doherty, J. Chem. Soc. Faraday Trans. 1 75 (1979) 132.
- [3] T. K. De, A. Maitra, Adv. Colloid Interface Sci. 59 (1995) 95.
- [4] S. P. Moulik, B. K. Paul, Adv. Colloid Interface Sci. 78 (1998) 99.
- [5] J. Rouviere, J.-M. Couret, M. Lindheimer, J.-L. Dejardin, R. Marrony, J. Chim. Phys. 76 (1979) 289.
- [6] J. Rouviere, J.-M. Couret, A. Lindheimer, M. Lindheimer, B. Brun, J. Chim. Phys. 76 (1979) 297.
- [7] J. Peyrelasse, M. Moha-Ouchane, C. Boned, Phys. Rev. A 38 (1988) 4155.
- [8] J. Bergenholtz, A. A. Romagnoli, N. J. Wagner, Langmuir 11 (1995) 1559.
- [9] U. Batra, W. B. Russel, J. S. Huang, Langmuir 15 (1999) 3718.
- [10] J. S. Huang, J. Chem. Phys. 82 (1985) 480.
- [11] M. Hirai, R. Kawai-Hirai, S. Yabuki, T. Takizawa, T. Hirai, K. Kobayashi, Y. Amemiya, M. Oya, J. Phys. Chem. 99 (1995) 6652.
- [12] X. Pan, S. R. Bhatia, J. Colloid Interf. Sci. 327 (2008) 152.
- [13] A. Amarene, M. Gindre, J.-Y. Le Huerou, W. Urbach, D. Valdez, M. Waks, Phys. Rev. E 61 (2000) 682.
- [14] Y. Yoshimura, I. Abe, M. Ueda, K. Kajiwara, T. Hori, Z. A. Schelly, Langmuir 16 (2000) 3633.
- [15] H.-F. Eicke, J. Rehak, Helv. Chim. Acta 59 (1976) 2883.
- [16] A. Maitra, J. Phys. Chem. 88 (1984) 5122.
- [17] M. Wong, J. K. Thomas, T. Nowak, J. Am. Chem. Soc. 99 (1977) 4730.
- [18] P. E. Zinsli, J. Phys. Chem. 83 (1979) 3223.
- [19] A. M. Dokter, S. Woutersen, H. J. Bakker, Proc. Nat. Acad. Sci. 103 (2006) 15355.
- [20] J. Eastoe, T. F. Towey, B. H. Robinson, J. Williams, R. K. Heenan, J. Phys. Chem. 97 (1993) 1459.
- [21] M. Kotlarchyk, J. S. Huang, S.-H. Chen, J. Phys. Chem. 89 (1985) 4382.
- [22] M. Kotlarchyk, S.-H. Chen, J. S. Huang, M. W. Kim, Phys. Rev. A 29 (1984) 2054.
- [23] C. Robertus, W. H. Philipse, J. G. H. Joosten, Y. K. Levine, J. Chem. Phys. 90 (1989) 4482.
- [24] L. Arleth, J. S. Pedersen, Phys. Rev. E 63 (2001) 061406.
- [25] P. Pitzalis, R. Angelico, O. Soderman, M. Monduzzi, Langmuir 16 (2000) 442.
- [26] A. Gardner, V. R. Vasquez, A. Clifton, O. A. Graeve, Fluid Phase Equilibria 262 (2007) 264.
- [27] S. A. Safran, L. A. Turkevich, P. Pincus, J. Phys. Lett. 45 (1984) L69.
- [28] P. L. Luisi, R. Scartazzini, G. Haering, P. Schurtenberger, Colloid Polym. Sci. 268 (1990) 356.
- [29] P. Schurtenberger, L. J. Magid, S. M. King, P. Lindner, J. Phys. Chem. 95 (1991) 4173.
- [30] V. Haverd, G. G. Warr, Langmuir 16 (2000) 157.
- [31] C. Petit, P. Lixon, M. P. Pileni, Langmuir 7 (1991) 2620.
- [32] J. Eastoe, G. Fragneto, B. H. Robinson, T. F. Towey, R. K. Heenan, F. J. Leng, J. Chem. Soc. Faraday Trans. 88 (1992) 461.
- [33] J. Eastoe, B. H. Robinson, R. K. Heenan, Langmuir 9 (1993) 2820.
- [34] J. Eastoe, D. C. Steytler, B. H. Robinson, R. K. Heenan, A. N. North, J. C. Dore, J. Chem. Soc. Faraday Trans. 90 (1994) 2479.
- [35] J. S. Pedersen, J. Appl. Cryst. 37 (2004) 369.
- [36] J. Peyrelasse, C. Boned, Z. Saidi, Phys. Rev. E 47 (1993) 3412.
- [37] G. Onori, A. Santucci, J. Colloid Interf. Sci. 150 (1992) 195.
- [38] D. Quemada, Rheol. ACTA 16 (1977) 82.
- [39] C. G. de Kruif, E. M. F. van Iersel, A. Vrij, W. B. Russel, J. Chem. Phys. 83 (1986) 4717.
- [40] S. J. Chen, D. F. Evans, B. W. Ninham, D. J. Mitchell, F. D. Blum, S. Pickup, J. Phys. Chem. 90 (1986) 842.
- [41] A. Derouiche, C. Tondre, J. Disp. Sci. Tech. 12 (1991) 517.
- [42] G. Porod, In O. Glatter and O. Kratky, editors, Small-angle X-ray scattering, pages 17-51. Academic Press, London, 1982.
- [43] J. S. Pedersen, Adv. Colloid Interface Sci. 70 (1997) 171.
- [44] O. Glatter, J. Appl. Cryst. 13 (1980) 577.
- [45] G. G. Warr, T. N. Zemb, M. Drifford, J. Phys. Chem. 94 (1990) 3086.
- [46] J. S. Pedersen, S. U. Egelhaaf, P. Schurtenberger, J. Phys. Chem. 99 (1995) 1299.
- [47] P. Schurtenberger, G. Jerke, J. S. Pedersen, Langmuir 12 (1996) 2433.
- [48] G. Fritz, O. Glatter, J. Phys.: Condens. Matter 18 (2006) S2403.
- [49] M. Doi, S. F. Edwards, The theory of polymer dynamics. Oxford University Press, Oxford, 1986.
- [50] W. C. K. Poon, M. D. Haw, Adv. Colloid Interface Sci. 73 (1997) 71.
- [51] T.-L. Lin, S.-H. Chen, N. E. Gabriel, M. F. Roberts, J. Phys. Chem. 91 (1987) 406.
- [52] M. A. Long, E. W. Kaler, S. P. Lee, G. D. Wignall, J. Phys. Chem. 98 (1994) 4402.
- [53] J. Eastoe, Langmuir 8 (1992) 1503.
- [54] P. Schurtenberger, C. Cavaco, F. Tiberg, O. Regev, Langmuir 12 (1996) 2894.
- [55] T. Shimada, M. Doi, K. Okano, J. Chem. Phys. 88 (1988) 2815.
- [56] M. Doi, T. Shimada, K. Okano, J. Chem. Phys. 88 (1988) 4070.
- [57] P. van der Schoot, T. Odijk, Macromolecules 23 (1990) 4181.
- [58] P. van der Schoot, Macromolecules 25 (1992) 2923.
- [59] T. Maeda, Macromolecules 24 (1991) 2740.
- [60] B. Weyerich, J. Brunner-Popela, O. Glatter, J. Appl. Cryst., 32 (1992) 197.
- [61] I. Livsey, J. Chem. Soc. Faraday Trans. 2 83 (1987) 1445.
- [62] P. N. Pusey, H. M. Fijnaut, A. Vrij, J. Chem. Phys. 77 (1982) 4270.
- [63] C. Robertus, J. G. H. Joosten, Y. K. Levine, Prog. Colloid Polym. Sci., 77:115, 1988.
- [64] R. Hilfiker, H.-F. Eicke, W. Sager, C. Steeb, U. Hofmeier, R. Gehrke, Ber. Bunsenges. Phys. Chem. 94 (1990) 677.
- [65] G. Carlström, B. Halle, J. Phys. Chem. 93 (1989) 3287.
- [66] H. Wennerström, B. Lindman, Phys. Rep. 52 (1979) 1.