Spectral properties of transitions between soft and hard state in GX 339-4
Abstract
We present a study of the spectral properties during state transition of GX 339-4. Data are taken from the 2010 outburst of GX 339-4, which is densely covered by Rossi X-ray Timing Explorer, providing an excellent coverage of the state transitions between the low/hard state and the high/soft state. We select all observations within a certain hardness ratio range during the soft intermediate state (SIMS). This sample was chosen in such a way to comprise all observations that show a type-B quasi-periodic oscillation (QPO). In addition, we also investigate the spectra of hard intermediate state observations. The spectra, obtained from Proportional Counter Array data in the 10 to 40 keV range, are fitted with a power law and an additional high energy cut-off if needed. We find that the spectra are significantly harder during the SIMS of the soft-to-hard transition than they are during the hard-to-soft transition. This demonstrates that during the SIMS of the soft-to-hard transition not only the luminosity and peak frequencies of type-B QPOs are lower, but that also the photon index is lower, compared to the hard-to-soft transition. Hence, type-B QPOs can be associated to a different spectral shape even though they appear at the same hardness. However, in each branch only certain combinations of centroid frequency and photon index are realised.
keywords:
X-rays: binaries – X-rays: individual: GX 339-4 – binaries: close – black hole physics1 Introduction
GX 339-4, a black hole X-ray transient (BHT), was discovered in 1973 by the OSO-7 satellite (Markert et al., 1973). Since then GX 339-4 showed several X-ray outburst (see e. g. Miyamoto et al., 1991; Belloni et al., 1997; Mendez & van der Klis, 1997; Zdziarski et al., 2004; Belloni et al., 2005; Belloni et al., 2006; Yu et al., 2007; Motta et al., 2009; Muñoz-Darias et al., 2011). The system is a low mass X-ray binary, harbouring a 6 M⊙ black hole accreting from a subgiant star in a 1.7 d orbital period (Hynes et al., 2003; Muñoz-Darias et al., 2008). GX 339-4 represents a prime example for the spectral and temporal evolution of a BHT during outburst. The different states through which a BHT evolves during an outburst can be identified in the hardness intensity diagram (HID; Belloni et al., 2005; Homan & Belloni, 2005; Gierliński & Newton, 2006; McClintock & Remillard, 2006; Fender et al., 2009; Belloni, 2010). In a log-log representation different states are found to correspond to different branches/areas of a q-shaped pattern. Recently, Muñoz-Darias et al. (2011) showed that the rms-intensity diagram (RID) allows the identification of states based on temporal information only. It is widely agreed on that at the begin and end of an outburst a BHT is in the so-called low/hard state (LHS), and that there is in between a transition to the high/soft state (HSS). In the HSS a strong thermal component, associated with disc emission is present, while spectra taken during the LHS show characteristics of hard (comptonized) emission. However, the exact definition of the states and especially of the transition between these states are still under debate. In this work we follow the classification of Belloni (2010) (see also Belloni et al., 2005; Homan & Belloni, 2005), which comprises a hard as well as a soft intermediate state (HIMS/SIMS); see however McClintock & Remillard (2006) for an alternative classification and Motta et al. (2009) for a comparison.
In this paper we investigate the spectral properties of transitions between the LHS and HSS. We focus on a comparison of the spectral properties of the SIMS observed during the hard-to-soft and the soft-to-hard transition.
2 Observations
The 2010 outburst of GX 339-4 was densely covered by Rossi X-ray Timing Explorer (RXTE), providing the (up to now) best coverage of the state transitions between the LHS and the HSS. For each observation of the outburst we determined the hardness ratio using Proportional Counter Unit 2 (PCU2) channels 7 – 13 (2.87 – 5.71 keV) for the soft band, and channels 14 – 23 (5.71 – 9.51 keV) for the hard band. The hardness intensity diagram (HID) as well as the hardness-rms diagram (HRD) of the whole outburst is shown in Fig. 1. The fractional rms was computed within the 0.1 – 64 Hz frequency band following Belloni & Hasinger (1990).
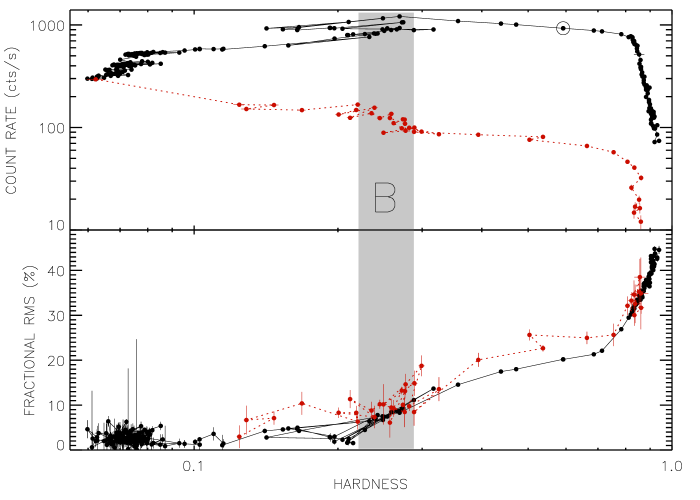
GX 339-4 shows the standard q-shaped pattern in the HID of this outburst. After the passage through the LHS and HIMS, type-B QPOs (quasi periodic oscillations; for a description of different types of QPOs see Wijnands et al., 1999; Casella et al., 2005) are seen in the power density spectra (see Sect. 3), indicating that the system is in the SIMS. Once this state is reached, several fast transitions between the SIMS and the HSS are observed with one extending to the HIMS (see Fig. 1). During the SIMS in the soft-to-hard transition at lower luminosities, the source also shows a few minor transitions.
In the transition from the LHS to the HSS, in the following called the upper branch, we select all observations that show a type-B QPO. These observations have a hardness ratio ranging from 0.2208 to 0.2883 (grey shaded area in Fig. 1). Please note that this hardness ratio range also includes observations without a type-B QPO. The same hardness ratio range is used to select observations from the lower branch (the back transition from the HSS to the LHS at lower luminosities). All observations showing type-B QPOs on either branch are within the hardness ratio range used. On the upper branch the centroid frequency of the type-B QPOs is 5 Hz, while on the lower branch it reduces to 2 Hz (see Motta et al., 2011). The fractional rms of observations showing type-B QPOs lies in the expected 5 – 10 % range (see Muñoz-Darias et al., 2011). Furthermore, observations with a type-B QPO have a lower fractional rms during back transition than in the hard-to-soft transition. For most of the remaining parts of the outburst the fractional rms during back transition is higher than it has been in the hard-to-soft transition (observations belonging to the back transition are marked in red in Fig. 1).
In summary, observations were included in the sample for comparison if their hardness ratio ranged between 0.2208 and 0.2883, as this interval comprises all observations with type B-QPOs. We also analysed HIMS observations (0.2883 HR 0.8) to cover the whole transition.
3 Power density spectra
We produced power density spectra (PDS) using 16 second long stretches of GoodXenon, Event and SingleBit mode data. We limited PDS production to the Proportional Counter Array (PCA) channel band 0 – 35 (2 – 15 keV). After averaging the PDS and subtracting the contribution due to Poissonian noise (see Zhang et al., 1995), the PDS were normalised according to Leahy et al. (1983) and converted to square fractional rms (Belloni & Hasinger, 1990). We fitted the PDS using the Xspec fitting package by applying a one-to-one energy-frequency conversion and a unit response. The noise components were fitted with three broad Lorentzian shapes, one zero-centered and other two centered at a few Hz (Belloni et al., 2002). We fitted the QPOs with one Lorentzian each. Occasionally it was possible to achieve a significant improvement of the value of reduced by adding a Gaussian component, which better approximates the shape of the narrow peaks. The QPO centroid frequency as well as the total fractional rms for each observation is listed in Table 1.


Casella et al. (2004); Casella et al. (2005) showed that QPOs could be classified by the following properties: the quality factor () and the shape of the noise associated with the oscillation in the PDS. It has been also proven that QPOs can be discriminated by the amount of noise present in the PDS, which is quantified by the fractional rms (Muñoz-Darias et al., 2011). This leads to a more specific version of the ABC classification (Motta et al., 2011), in which type-B QPOs are characterised by rms strictly within the 5 – 10% interval and are observed at frequencies ranging from 1 to 7 Hz.
The relation between centroid frequency and fractional rms is shown in Fig. 2. This plot allows us to distinguish clearly between type-C (filled circles) and type-B QPOs (open circles). Similar plots for XTE J1859+226 and a sample of sources can be found in Casella et al. (2004) and Casella et al. (2005), respectively. The four points associated to type-B QPOs detected in the soft-to-hard transition (open circles with QPO centroid frequency between 0.9 and 2.0 Hz) are located in an area which is empty in the Casella et al. (2004); Casella et al. (2005) plots, as these plots contain only type-B QPOs detected during the hard-to-soft transition. Furthermore, the four points associated to type-B QPOs during the soft-to-hard transition are located clearly outside the regions associated to type-C and type-A QPOs. Therefore we identify these four QPOs as type-B. A selection of PDS with type-B QPOs observed during the hard-to-soft as well as the soft-to-hard transition is shown in Fig. 3. For a more detailed study of different types of QPOs detected in a sample comprising data of four outbursts of GX 339-4 and a discussion of QPO properties with respect to source flux as well as spectral properties see Motta et al. (2011).
4 Spectral analysis
Energy spectra were extracted from PCA PCU2 data using the standard RXTE software within heasoft V. 6.9. We had to exclude all High Energy X-ray Timing Experiment (HEXTE) data from our analysis, since most of the HEXTE spectra contain strong residuals that are related to the difficulties in determining the background contribution in the spectra since the “rocking” mechanism of HEXTE is broken. To account for residual uncertainties in the instrument calibration a systematic error of 0.6 per cent was added to the PCA spectra111A detailed discussion on PCA calibration issues can be found at: http://www.universe.nasa.gov/xrays/programs/rxte/pca/doc/rmf/pcarmf-11.7/. The spectra were fitted with isis V. 1.6.1 (Houck & Denicola, 2000).
Since we were only interested in the behaviour of the hard spectral component we decided to neglect the contribution of the soft (disc) component and to focus our spectral analysis on the high energy range. We fitted the PCA (10 – 40 keV) data using a power law model. For the first few observations of the HIMS an additional high energy cut-off was needed to obtain good fits.
The fits resulted in formally acceptable reduced values and the spectra were clearly free of residuals. As an iron line was present at lower energies, indicating the presence of reflection processes (Zdziarski et al., 1999), it might be possible that also a broad reflection feature showed up around 30 keV (e. g. Magdziarz & Zdziarski, 1995). This feature could be due either to reflection of the comptonized emission onto the accretion disk (see Gilfanov, 2010, for a review) or to extended layers of material covering certain regions of the optically thick accretion disk (e.g. wind clouds surrounding the central black hole, see Shaposhnikov & Titarchuk, 2006). To exclude that the value of the photon index was affected by the presence of this feature we also tried a different model, consisting of a power law multiplied by a reflection component (reflect). We found that the relative reflection component was only needed for the first few HIMS observations.
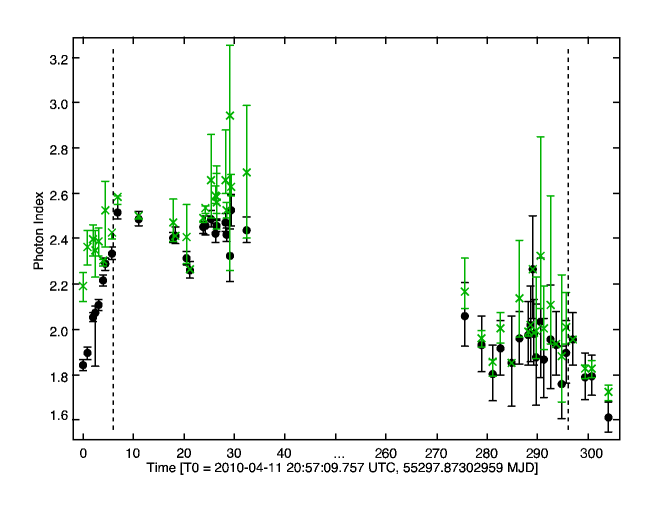
Taking reflection into account changes the value of the photon index in each individual observation. This has to be expected, since a “phenomenological model” such as a power law is not able to take into account the reflection features around 30 keV. However the overall behaviour of the photon index observed between upper and lower branch stays the same (Fig. 4). In the remaining observations the relative reflection component found was always consistent with zero within errors. In the following, we discuss only the results from the PCA 10 – 40 keV spectra.
5 Results and Discussion
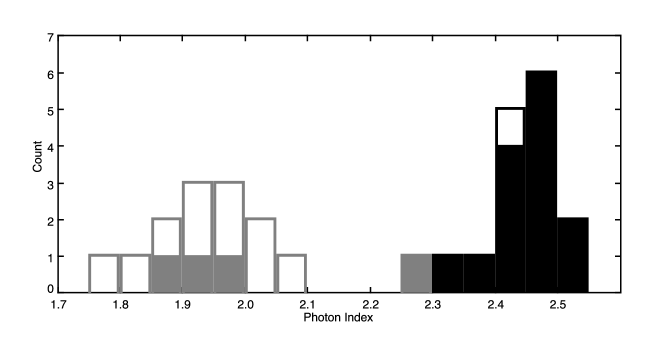
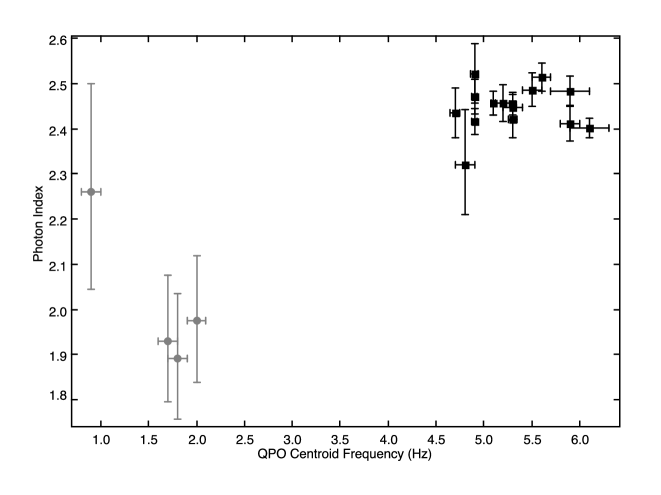
In spite of GX 339-4 has been deeply studied by RXTE during the last years, spectral transitions are very fast, which results in a few SIMS observations per outburst. Most of these observations are usually concentrated in the upper branch. Since the SIMS was intensively covered during 2010 and many type-B QPOs could be observed, it was possible to make an unprecedented detailed direct comparison between the upper and lower branch SIMS. Hence, we investigated PCA spectra (10 – 40 keV) to search for differences in the spectral properties of both branches and how they can be addressed in the light of (non)detection of radio emission and QPO properties. Figure 4 shows the temporal evolution of the photon index. It increases during the HIMS and reaches a more or less constant value during the SIMS in the upper branch. In the lower branch, the SIMS spectra have a consistently lower photon index than those in the upper branch. The HIMS shows a moderate decrease in photon index. The fact that the soft-to-hard transition takes place at a much lower photon index (see also Fig. 5) means that the high energy part of the spectrum is harder in the lower branch than it was in the upper branch. There are numerous works on BHTs that study the evolution of the temporal and spectral properties during the whole outburst (e. g. McClintock et al., 2009; Motta et al., 2010; Shaposhnikov et al., 2010). Other papers are dedicated to a detailed investigation of those properties during the outburst decay (e. g. Kalemci et al., 2004; Kalemci et al., 2005, 2006). The overall evolution of the photon index throughout a BHT outburst, which – roughly speaking – consists of an increase from the LHS to the HSS followed by a decrease when the source goes back to the LHS, is already known from those studies. However none of these studies focuses on the behaviour of the photon index during the upper and lower branch SIMS, which is most probably related to the previously sparsely sampling of (lower branch) SIMSs.
Remember that the observations were selected from the same hardness ratio range. A different contribution of the disc to the overall emission – which arises in a reduced inner disc temperature – compared to the upper branch has to be expected due to the lower luminosity in the soft-to-hard transition (Maccarone & Coppi 2003; see e. g. Shaposhnikov et al. 2010 or Stiele et al. 2011 for XTE J1752-223 or Muñoz-Darias et al. 2011 for MAXI J1659-152). This change in the disc contribution to the emission requires that also the rest of the spectrum must be modified since the hard tail depends (in a complicated way, via Comptonization processes; see e. g. Sunyaev & Titarchuk 1980; Titarchuk & Lyubarskij 1995 and references therein for thermal Comptonization, Titarchuk et al. 1996 and references therein for non-thermal Comptonization, Del Santo et al. 2008 and references therein for hybrid Comptonization) from the disc itself. Thus the spectral shapes between upper and lower branch at a similar hardness ratio should differ from each other. While hardness ratio can be used as a good tracker of the spectral shape for observations obtained at more or less the same flux, our results show that one should be cautious especially when analysing spectra at very different fluxes, as it is the case for observations of the upper and lower branch. In this case it is necessary to “re-calibrate” its meaning according to the new flux level. In other words, the same hardness range tracks different photon index intervals at different fluxes.
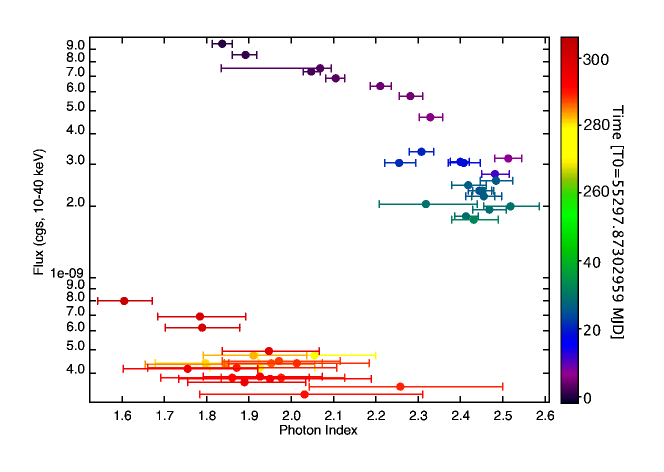
The connection between source flux and photon index is shown in Fig. 6. The colour of the dots represents the temporal evolution of the parameters during the outburst. The behaviour seen is expected according to the HID.
The observations of the upper and lower branch were selected in such a way to include all observations with type-B QPOs and have a similar fractional rms. Furthermore, they are all located within a certain hardness ratio range, which is represented as a vertical strip in the HID. It is known that the jet line does not follow a vertical line in the HID, but shows a more complex behaviour (Fender et al., 2009). In the lower branch the jet does not turn on before the source is settled in the LHS (Kalemci et al., 2006; Russell & Lewis, 2011). We showed that the photon index during the SIMS in the lower branch transition is smaller than in the upper branch transition. This means that lines of constant photon index run from the upper right to the lower left in the HID during state transition.
It is known that the disappearance of the steady radio jet in the upper branch and the re-appearance of the jet in the lower branch take place at different hardness ratios. Our finding of a lower photon index during the SIMS of the lower branch implies that the jet appears at a much lower photon index in the soft-to-hard transition than it disappeared at in the upper branch. This implies that there is either no relation between photon index and radio emission or that this relation has to be extremely complicated.
The photon indices found in the SIMS of the lower branch correspond to values obtained at the onset of the HIMS in the upper branch (see encircled dot in Fig. 1). This finding is in agreement with the lagging of timing properties compared to spectral properties in the soft-to-hard transition, as reported in Kalemci et al. (2004). Furthermore Muñoz-Darias et al. (2011) showed that the onset of the upper branch HIMS and the transition form the lower branch HIMS to the LHS are situated on two different hard lines in the intensity-rms diagram of GX 339-4.
Furthermore, we found that type-B QPOs can be associated to different spectral shape. Previous studies, which did not differentiate between type-B and other types of QPOs, used a relation between photon-index and QPO centroid frequency to estimate the mass of the black hole in X-ray binaries (Shaposhnikov & Titarchuk, 2007, 2009). In the upper branch type-B QPOs appear at a centroid frequency of 5 Hz (Motta et al., 2011) and in observations where the photon index is between 2.3 and 2.6. In the lower branch the centroid frequency of type-B QPOs reduces to 2 Hz (Motta et al., 2011) and they are mainly observed in observations which spectra have a photon index of 1.9 (see Fig. 6). However, we observe type-B QPOs neither in observations of the upper branch that have a photon index of 1.9 nor in observations of the lower branch which have a photon index of 2.4. Therefore, the physical conditions that lead to the QPO do not depend in an obvious way on the power law parameters. Figure 5 clearly shows that within each branch the photon index is not enough to distinguish between observations with and without type-B QPOs in the selected sample. The difference is just in the timing. In addition, Motta et al. (2011) showed that there is a correlation between centroid frequency of type-B QPOs and the count rate. We do not want to claim here a relation between centroid frequencies of type-B QPOs and photon index, but our findings underline that type-B QPOs can appear only in a very narrow range of properties of a BHT that are realised during state transitions. These properties occur in a rather narrow window in the HID and they are characterised by selected combinations of peak frequencies of type-B QPOs and photon index in the upper and lower branch, respectively.
Recent works indicate that the hard component observed in spectra of intermediate states arises from hybrid Comptonization (e. g. Del Santo et al., 2008, and references therein). In the intermediate states, a hard tail extended to the MeV is observable in the spectra (Done et al., 2007, like those observed in the HSS (Grove et al., 1998)). This intermediate state tail is softer than the tail that can be observed in the hard state and comes either in the form of a cut-off power law rolling over at energies larger than 150 keV (Motta et al., 2009) or in the form of a simple power law, with no observable cut-off up to a few MeV (Caballero García et al., 2007). The extent of the tail shows that there must be non-thermal Compton scattering, as in the high/soft state. However, the tail is steeper, which means that the mean electron energy is lower. The observed spectral shape can only be produced by a combination of thermal/non-thermal Compton scattering. This could be produced in a single region filled with two populations of electrons (one thermal and the other non thermal). Alternatively there could be two different regions, one with thermal electrons (the same electrons that in the hard state are responsible of the thermal comptonization) and one with non-thermal, perhaps related to the jet base. Assuming that the hard component results from hybrid Comptonization, the appearance of type-B QPOs depends directly on the properties of the hybrid Comptonizing medium. In particular, the type-B QPO frequency is strictly related to the temperature distribution of the electrons, that in turn determines the inclination of the hard part of the spectrum. In this regard, it appears natural to assume that the properties (i. e. the temperature distribution) of such a medium are different in the softening and hardening phase, which are separated by the HSS, where the hard contribution to the emission is nearly negligible and therefore, our results are consistent with this scenario.
However, the presence of diverse elements acting together in spectral/temporal evolution of the system (such as different populations of electrons, accretion flow and even a magnetic field) results in several effects that are difficult to disentangle. The complexity of the situation makes it difficult to identify how the behavior of the emitting components could affect the properties of the QPOs and to determine whether the appearance of type-B QPOs is related to changes in the corona, in the disc, the accretion-ejection process, or a combination of several processes. Such issue is not trivial to the understanding of accretion and of the fundamental physics acting in presence of compact objects and strong gravitational fields and should be the topic of further investigations.
6 Conclusion
We investigated the spectral properties in the 10 – 40 keV band during state transitions in the 2010 outburst of GX 339-4. The sample of SIMS observations used contained all observations with type-B QPOs. Comparing the (mean) photon index found in the SIMS of the hard-to-soft transition with the one of the soft-to-hard transition a flatting of the power law is clearly evident. This means that the back transition from the soft to the hard state does not only occur at lower luminosity and with lower peak frequencies of type-B QPOs, but also at lower photon index. Hence, type-B QPOs can be associated to different spectral shape. However, in each branch only certain combinations of centroid frequency and photon index are realised.
Acknowledgments
The research leading to these results has received funding from the European Community’s Seventh Framework Programme (FP7/2007-2013) under grant agreement number ITN 215212 “Black Hole Universe”. SM and TB acknowledge support from grant ASI-INAF I/009/10/0.
This work makes use of EURO-VO software, tools or services. The EURO-VO has been funded by the European Commission through contracts RI031675 (DCA) and 011892 (VO-TECH) under the 6th Framework Programme and contracts 212104 (AIDA) and 261541 (VO-ICE) under the 7th Framework Programme.
References
- Belloni & Hasinger (1990) Belloni T., Hasinger G., 1990, A&A, 227, L33
- Belloni et al. (2005) Belloni T., Homan J., Casella P., van der Klis M., Nespoli E., Lewin W. H. G., Miller J. M., Méndez M., 2005, A&A, 440, 207
- Belloni et al. (2006) Belloni T., Parolin I., Del Santo M., Homan J., Casella P., Fender R. P., Lewin W. H. G., Méndez M., Miller J. M., van der Klis M., 2006, MNRAS, 367, 1113
- Belloni et al. (2002) Belloni T., Psaltis D., van der Klis M., 2002, ApJ, 572, 392
- Belloni et al. (1997) Belloni T., van der Klis M., Lewin W. H. G., van Paradijs J., Dotani T., Mitsuda K., Miyamoto S., 1997, A&A, 322, 857
- Belloni (2010) Belloni T. M., 2010, in T. Belloni ed., Lecture Notes in Physics, Berlin Springer Verlag Vol. 794 of Lecture Notes in Physics, Berlin Springer Verlag, States and Transitions in Black Hole Binaries. pp 53–+
- Caballero García et al. (2007) Caballero García M. D., Miller J. M., Kuulkers E., Díaz Trigo M., Homan J., Lewin W. H. G., Kretschmar P., Domingo A., Mas-Hesse J. M., Wijnands R., Fabian A. C., Fender R. P., van der Klis M., 2007, ApJ, 669, 534
- Casella et al. (2004) Casella P., Belloni T., Homan J., Stella L., 2004, A&A, 426, 587
- Casella et al. (2005) Casella P., Belloni T., Stella L., 2005, ApJ, 629, 403
- Del Santo et al. (2008) Del Santo M., Malzac J., Jourdain E., Belloni T., Ubertini P., 2008, MNRAS, 390, 227
- Done et al. (2007) Done C., Gierliński M., Kubota A., 2007, A&ARv, 15, 1
- Fender et al. (2009) Fender R. P., Homan J., Belloni T. M., 2009, MNRAS, 396, 1370
- Gierliński & Newton (2006) Gierliński M., Newton J., 2006, MNRAS, 370, 837
- Gilfanov (2010) Gilfanov M., 2010, in T. Belloni ed., Lecture Notes in Physics, Berlin Springer Verlag Vol. 794 of Lecture Notes in Physics, Berlin Springer Verlag, X-Ray Emission from Black-Hole Binaries. pp 17–+
- Grove et al. (1998) Grove J. E., Johnson W. N., Kroeger R. A., McNaron-Brown K., Skibo J. G., Phlips B. F., 1998, ApJ, 500, 899
- Homan & Belloni (2005) Homan J., Belloni T., 2005, Ap&SS, 300, 107
- Houck & Denicola (2000) Houck J. C., Denicola L. A., 2000, in N. Manset, C. Veillet, & D. Crabtree ed., Astronomical Data Analysis Software and Systems IX Vol. 216 of Astronomical Society of the Pacific Conference Series, ISIS: An Interactive Spectral Interpretation System for High Resolution X-Ray Spectroscopy. pp 591–+
- Hynes et al. (2003) Hynes R. I., Steeghs D., Casares J., Charles P. A., O’Brien K., 2003, ApJ, 583, L95
- Kalemci et al. (2005) Kalemci E., Tomsick J. A., Buxton M. M., Rothschild R. E., Pottschmidt K., Corbel S., Brocksopp C., Kaaret P., 2005, ApJ, 622, 508
- Kalemci et al. (2006) Kalemci E., Tomsick J. A., Rothschild R. E., Pottschmidt K., Corbel S., Kaaret P., 2006, ApJ, 639, 340
- Kalemci et al. (2004) Kalemci E., Tomsick J. A., Rothschild R. E., Pottschmidt K., Kaaret P., 2004, ApJ, 603, 231
- Leahy et al. (1983) Leahy D. A., Elsner R. F., Weisskopf M. C., 1983, ApJ, 272, 256
- Maccarone & Coppi (2003) Maccarone T. J., Coppi P. S., 2003, MNRAS, 338, 189
- Magdziarz & Zdziarski (1995) Magdziarz P., Zdziarski A. A., 1995, MNRAS, 273, 837
- Markert et al. (1973) Markert T. H., Canizares C. R., Clark G. W., Lewin W. H. G., Schnopper H. W., Sprott G. F., 1973, ApJ, 184, L67+
- McClintock & Remillard (2006) McClintock J. E., Remillard R. A., 2006, Black hole binaries. pp 157–213
- McClintock et al. (2009) McClintock J. E., Remillard R. A., Rupen M. P., Torres M. A. P., Steeghs D., Levine A. M., Orosz J. A., 2009, ApJ, 698, 1398
- Mendez & van der Klis (1997) Mendez M., van der Klis M., 1997, ApJ, 479, 926
- Miyamoto et al. (1991) Miyamoto S., Kimura K., Kitamoto S., Dotani T., Ebisawa K., 1991, ApJ, 383, 784
- Motta et al. (2009) Motta S., Belloni T., Homan J., 2009, MNRAS, 400, 1603
- Motta et al. (2010) Motta S., Muñoz-Darias T., Belloni T., 2010, MNRAS, 408, 1796
- Motta et al. (2011) Motta S., Muñoz-Darias T., Casella P., Belloni T., Homan J., 2011, ArXiv e-prints, arXiv1108.0540
- Muñoz-Darias et al. (2008) Muñoz-Darias T., Casares J., Martínez-Pais I. G., 2008, MNRAS, 385, 2205
- Muñoz-Darias et al. (2011) Muñoz-Darias T., Motta S., Belloni T. M., 2011, MNRAS, 410, 679
- Muñoz-Darias et al. (2011) Muñoz-Darias T., Motta S., Stiele H., Belloni T. M., 2011, MNRAS, 415, 292
- Russell & Lewis (2011) Russell D. M., Lewis F., 2011, The Astronomer’s Telegram, 3191, 1
- Shaposhnikov et al. (2010) Shaposhnikov N., Markwardt C., Swank J., Krimm H., 2010, ApJ, 723, 1817
- Shaposhnikov & Titarchuk (2006) Shaposhnikov N., Titarchuk L., 2006, ApJ, 643, 1098
- Shaposhnikov & Titarchuk (2007) Shaposhnikov N., Titarchuk L., 2007, ApJ, 663, 445
- Shaposhnikov & Titarchuk (2009) Shaposhnikov N., Titarchuk L., 2009, ApJ, 699, 453
- Stiele et al. (2011) Stiele H., Munoz-Darias T., Motta S., Belloni T., 2011, ArXiv e-prints
- Sunyaev & Titarchuk (1980) Sunyaev R. A., Titarchuk L. G., 1980, A&A, 86, 121
- Titarchuk & Lyubarskij (1995) Titarchuk L., Lyubarskij Y., 1995, ApJ, 450, 876
- Titarchuk et al. (1996) Titarchuk L., Mastichiadis A., Kylafis N. D., 1996, A&AS, 120, C171+
- Wijnands et al. (1999) Wijnands R., Homan J., van der Klis M., 1999, ApJ, 526, L33
- Yu et al. (2007) Yu W., Lamb F. K., Fender R., van der Klis M., 2007, ApJ, 663, 1309
- Zdziarski et al. (2004) Zdziarski A. A., Gierliński M., Mikołajewska J., Wardziński G., Smith D. M., Harmon B. A., Kitamoto S., 2004, MNRAS, 351, 791
- Zdziarski et al. (1999) Zdziarski A. A., Lubinski P., Smith D. A., 1999, MNRAS, 303, L11
- Zhang et al. (1995) Zhang W., Jahoda K., Swank J. H., Morgan E. H., Giles A. B., 1995, ApJ, 449, 930
Appendix A Online Material
| Obs. id. | MJD | state | Flux∗ | fold energy | cutoff energy | QPO centroid | total | |
|---|---|---|---|---|---|---|---|---|
| [keV] | [keV] | frequency | fractional rms (%)‡ | |||||
| 95409-01-14-02 | 55297.9 | HIMS | 1.840.02 | 9.43 | 132 | 19.9 | 1.250.01 | 21.90.1 |
| 95409-01-14-03 | 55298.7 | HIMS | 1.890.03 | 8.47 | 65 | 23.1 | 1.590.01 | 21.60.2 |
| 95409-01-14-06 | 55299.8 | HIMS | 2.050.02 | 7.25 | 61 | 26.2 | 2.430.01 | 20.00.1 |
| 95409-01-14-04 | 55300.3 | HIMS | 2.07 | 7.45 | 152 | 20.6 | 2.380.01 | 20.00.2 |
| 95409-01-14-07 | 55300.9 | HIMS | 2.100.02 | 6.78 | 165 | 18.45 | 2.920.01 | 19.40.1 |
| 95409-01-14-05 | 55301.8 | HIMS | 2.21 | 6.25 | – | – | 3.640.02 | 17.70.2 |
| 95409-01-15-00 | 55302.2 | HIMS | 2.280.03 | 5.73 | – | – | – | – |
| 95409-01-15-01 | 55303.6 | HIMS | 2.330.03 | 4.63 | – | – | 5.650.04 | 14.610.1 |
| 95409-01-15-02 | 55304.7 | SIMS | 2.510.03 | 3.14 | – | – | 5.60.1 | 8.30.2 |
| 95409-01-15-06 | 55309.0 | SIMS | 2.480.03 | 2.70 | – | – | 5.90.2 | 6.50.1 |
| 95409-01-16-05 | 55315.7 | SIMS | 2.400.02 | 3.02 | – | – | 6.10.2 | 9.30.1 |
| 95409-01-17-00 | 55316.1 | SIMS | 2.410.04 | 3.00 | – | – | 5.90.1 | 10.00.1 |
| 95409-01-17-02 | 55318.4 | HIMS | 2.310.03 | 3.34 | – | – | 6.670.19 | 13.690.13 |
| 95409-01-17-03 | 55319.1 | HIMS | 2.260.04 | 3.00 | – | – | – | – |
| 95409-01-17-05 | 55321.7 | SIMS | 2.440.03 | 2.30 | – | – | 5.30.1 | 7.20.1 |
| 95409-01-17-06 | 55322.2 | SIMS | 2.450.04 | 2.18 | – | – | 5.20.1 | 7.50.2 |
| 95409-01-18-00 | 55323.2 | SIMS | 2.480.04 | 2.53 | – | – | 5.50.1 | 8.60.1 |
| 95335-01-01-07 | 55324.2 | SIMS | 2.420.04 | 2.41 | – | – | 5.30.04 | 8.70.2 |
| 95335-01-01-00 | 55324.3 | SIMS | 2.450.02 | 2.30 | – | – | 5.30.03 | 8.50.1 |
| 95335-01-01-01 | 55324.4 | SIMS | 2.450.03 | 2.17 | – | – | 5.10.02 | 7.40.1 |
| 95335-01-01-05 | 55326.2 | SIMS | 2.470.04 | 1.91 | – | – | 4.90.03 | 7.10.2 |
| 95335-01-01-06 | 55326.3 | SIMS | 2.410.03 | 1.79 | – | – | 4.90.03 | 6.30.2 |
| 95409-01-18-04 | 55327.0 | SIMS | 2.32 | 2.01 | – | – | 4.80.1 | 8.80.4 |
| 95409-01-18-05 | 55327.3 | SIMS | 2.520.07 | 1.96 | – | – | 4.90.04 | 6.40.4 |
| 95409-01-19-00 | 55330.3 | SIMS | 2.43 | 1.73 | – | – | 4.70.05 | 3.31.1 |
| 96409-01-02-02 | 55573.5 | SIMS | 2.05 | 0.47 | – | – | – | – |
| 96409-01-03-00 | 55576.8 | SIMS | 1.93 | 0.42 | – | – | – | – |
| 96409-01-03-01 | 55578.9 | SIMS | 1.80 | 0.43 | – | – | – | – |
| 96409-01-03-02 | 55580.6 | SIMS | 1.91 | 0.47 | – | – | – | – |
| 96409-01-04-00 | 55582.7 | SIMS | 1.85 | 0.43 | – | – | – | – |
| 96409-01-04-01 | 55584.4 | SIMS | 1.95 | 0.44 | – | – | – | – |
| 96409-01-04-04 | 55585.9 | SIMS | 1.97 | 0.45 | – | – | 2.00.1 | 10.10.6 |
| 96409-01-04-02 | 55586.5 | SIMS | 2.01 | 0.43 | – | – | – | – |
| 96409-01-04-05 | 55586.9 | SIMS | 2.26 | 0.35 | – | – | 0.90.1 | 8.52.0 |
| 96409-01-04-03 | 55587.2 | SIMS | 1.98 | 0.38 | – | – | – | – |
| 96409-01-04-07 | 55587.5 | HIMS | 1.87 | 0.42 | – | – | – | – |
| 96409-01-04-08 | 55588.5 | SIMS | 2.03 | 0.32 | – | – | – | – |
| 96409-01-05-00 | 55589.2 | SIMS | 1.86 | 0.38 | – | – | – | – |
| 96409-01-05-04 | 55590.4 | HIMS | 1.95 | 0.37 | – | – | – | – |
| 96409-01-05-01 | 55591.6 | SIMS | 1.93 | 0.39 | – | – | 1.70.1 | 9.91.0 |
| 96409-01-05-05 | 55592.7 | HIMS | 1.76 | 0.41 | – | – | – | – |
| 96409-01-05-02 | 55593.5 | SIMS | 1.89 | 0.36 | – | – | 1.80.1 | 9.02.9 |
| 96409-01-05-03 | 55594.9 | HIMS | 1.95 | 0.49 | – | – | – | – |
| 96409-01-06-00 | 55597.3 | HIMS | 1.78 | 0.69 | – | – | – | – |
| 96409-01-06-01 | 55598.7 | HIMS | 1.790.09 | 0.62 | – | – | – | – |
| 96409-01-06-02 | 55601.9 | HIMS | 1.61 | 0.79 | – | – | – | – |
Notes:
†: photon index
∗: flux in the 10 – 40 keV band in units of 10-9 erg s-1 cm-2
†: in the 0.1 – 64 Hz range