Probing magnetic order in LiMPO4, Ni, Co, Fe and lithium diffusion in LixFePO4
Abstract
Muon spin relaxation measurements are reported on three members of the LixMPO4 series. The magnetic properties of stoichiometric samples with Ni, Co, Fe, were investigated at low-temperature. In LiNiPO4 we observe different forms of the muon decay asymmetry in the commensurate and incommensurate antiferromagnetic phases, accompanied by a change in the temperature dependence of the muon oscillation frequency. In LiCoPO4 the form of the muon decay asymmetry indicates that the correlation between layers decreases as the Néel temperature is approached from below. LiFePO4 shows more conventional behaviour, typical for an antiferromagnet. Measurements on LixFePO4 with & show evidence for lithium diffusion below K and muon diffusion dominating the form of the relaxation at higher temperature. The thermally activated form of the observed hopping rate suggests an activation barrier for lithium diffusion of meV and a diffusion constant of cm2s-1 at room temperature.
pacs:
76.75.+i, 75.50.Ee, 82.47.Aa, 82.56.LzI Introduction
The series of phosphates LiMPO4 crystallize in the orthorhombic olivine structure, with layers of magnetic transition metal M ions that are relatively well coupled, meaning they are intermediate between two- and three-dimensional magnetism. geller60 ; vakninprl The choice of M ion allows the single ion interactions to be tuned discretely and a range of magnetic behaviour results. In LiNiPO4 the low-temperature commensurate antiferromagnetic state becomes incommensurate just below the bulk ordering temperature. vakninprl Both LiCoPO4 and LiNiPO4 exhibit magnetoelectric behaviour kornev00 and the resulting toroidal domains in LiCoPO4 have been observed using optical measurements. vanaken
A separate interest in this series of phosphates comes from their application as battery cathode materials. This is particularly relevant for LiFePO4 which has a slightly lower cell voltage and energy density than the widely used LiCoO2, but a significantly better lifetime, resistance to thermal runaway, and a smaller environmental impact. padhi97 ; yamada ; whittingham05 ; ohzuku07 ; yuan11 The use of LixFePO4 as a battery cathode material leads to questions concerning its electrochemical properties and the kinetics of lithium diffusion, both of which have received considerable study. yuan11 Both calculations and experiment have addressed the activation barriers for lithium ion and electron conduction, as well as the lithium ion diffusion rate. ellis06 ; dodd07 ; prosini02 ; churikov10 ; franger02 ; yu07 ; morgan04 ; islam ; amin08 ; takahashi02 ; wang07 ; maxisch06 ; hoangxx ; cabana10 While the calculated values have converged there are considerable variations in the results of experiments carried out using different techniques.
In this paper we present a muon-spin relaxation (SR) investigation of the low-temperature magnetic properties of LiMPO4 ( Ni, Co, Fe) and the high-temperature diffusive properties of LixFePO4 ( 0.8, 0.9, 1.0). As well as being a sensitive probe of magnetic ordering, blundell99 ; yddrbook SR provides a means of investigating diffusion processes of both the muon kadono89 and other species that perturb its environment. sugiyama09 Lithium diffusion is a process that provides such a perturbation and SR has now been applied to studying it in a wide range of battery cathode materials: Lix[Mn1.96Li0.04]O4, kaiser00 ; ariza03 Li0.6TiO2, gubbens06 Li3-x-yNixN, powell09 , LixCoO2, mukai07 ; sugiyama09 and LiNiO2. sugiyama10 Of these, the studies on LixCoO2 have been the most extensive and found that the lithium diffusion rate in this compound is well suited to the timescale probed by SR. Similar studies on a different timescale can be carried out using NMR. verhoeven01 ; nakamura06 ; cabana10
We describe the preparation of the samples and the general SR technique in section II, including the details of how the low-temperature data were analysed. In sections III.1, III.2, and III.3 we present our SR data and analysis. In section IV we discuss the existing literature on lithium diffusion in LixFePO4, describe our higher-temperature SR experiments, data analysis, and results. Our conclusions are summarized in section V.
II Experimental Method
Powders of stoichiometric and Li-deficient LixMPO4 (Ni, Co and Fe; and ) were synthesized by the solid state reaction technique. Starting materials of high purity ( %) Li3PO4, NiO, Co3O4, Fe2O3, and NH4H2PO4 were mixed and sintered in three stages; C for 10 h, C for 5 h, and C for 24 h. After grinding, they were sintered again at C for 24 h. Finally the powders were made into rods and sintered at C for 12 h. Single crystals of stoichiometric LiMPO4 were grown in a four-mirror optical floating-zone furnace (Crystal System Inc.). The growth was carried out at a speed of 2–3 mm/h with the feed and seed rods counter rotating at 25 rpm. Crystals were grown in an argon pressure of 1–4 atmosphere.
Spin-polarized positive muons were implanted into the samples where they stop at interstitial sites with large electronegativity, and decay with a mean lifetime of s. While the muons remain within the sample their spin direction is affected by the local magnetic field at their stopping site, with the muon’s gyromagnetic ratio MHz T-1 being intermediate between those of the electron and proton. The muon spin polarization is followed as a function of time by measuring the asymmetry in the count rate of decay positrons, , in two detectors on opposite sides of the sample. blundell99 Our SR experiments were carried out at the Paul Scherrer Institute using the General Purpose Surface-muon instrument (GPS) for the low-temperature measurements of the stoichiometric crystalline samples and at the ISIS Facility using the MuSR spectrometer for the high-temperature measurements of the LixFePO4 samples.
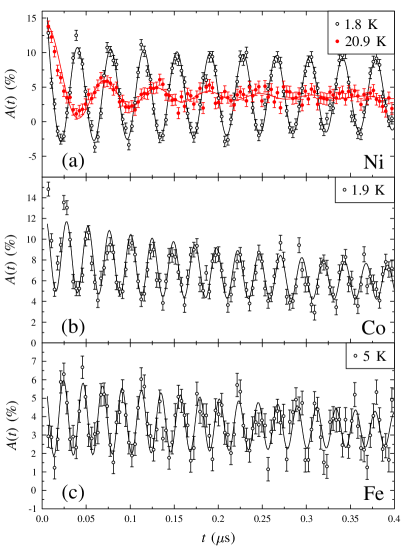
The data shown in Fig. 1 were analysed using the WiMDA program. wimda It was found that similar fitting functions were suitable for describing the data on each of the three stoichiometric samples, based on the general form:
| (1) |
The term describes an exponentially damped oscillation due to a quasistatic magnetic field perpendicular to the muon spin direction. The phase could be fixed to zero in both the low-temperature commensurate phase of LiNiPO4, and below in LiFePO4. In LiCoPO4, was found to depend on temperature. The term describes the exponential relaxation for muon spins with their direction along that of the local field at their stopping site, which are depolarized by spin fluctuations. The final term describes the temperature-independent contribution to the asymmetry from muons stopping outside the sample. Just above the magnetic ordering transition there is no oscillatory signal and, as is generally the case in paramagnets, the data are well described by an exponential relaxation, with rate . This form of the data is not compatible with short-ranged static magnetic order persisting above the long-range magnetic ordering transition on the timescales probed by muons. We discuss the form of the muon depolarization at higher temperatures in section IV.
In the incommensurate antiferromagnetic phase of LiNiPO4 we found that Eq. 1 did not provide a satisfactory description of the data, even allowing to change from the value of zero found to describe the commensurate phase. For incommensurate magnetic phases, where the muons sample a significant range of magnetic fields, the oscillatory part of the muon relaxation function takes the form of a Bessel function, yddrbook so that can be written as:
| (2) |
For well-defined oscillation frequencies that varied continuously below we fitted the temperature dependence to the phenomenological function:
| (3) |
where describes the trend and describes the trend approaching .
III Low-temperature results
III.1
On cooling LiNiPO4 orders incommensurately at K, then orders commensurately at K. vakninprl ; kharchenko03 Neutron diffraction has characterized both the long-range ordered phases and found diffuse scattering well above . The trend in the magnetic order parameter approaching the breakup of collinear order was found to follow the dependence expected for a 2D Ising model; vakninprbni an anomalous correlation between the spin wave spectrum and the incommensurate magnetic order jensenprb413 and coexisting short- and long-range incommensurate magnetic order were reported for the intermediate phase. vakninprl
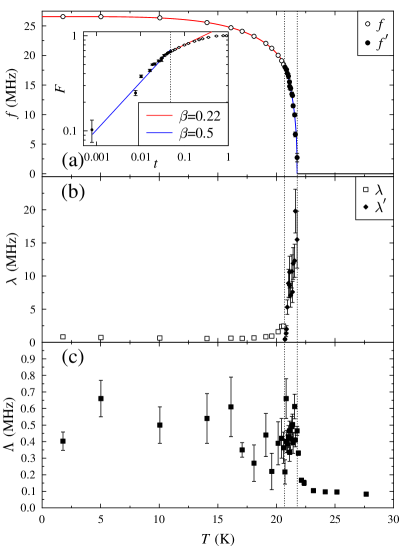
In LiNiPO4 we can divide the data into three distinct temperature regions. At the lowest temperatures, below K, we observe underdamped oscillations at a single frequency, with the data shown in Fig. 1 (a) well described by Equation 1 with . This is consistent with the commensurate magnetic structure determined by neutron diffraction. vakninprl The temperature dependence of the oscillation frequency, , is shown in Fig. 2 (a), the linewidth in (b), and the relaxation rate in (c). The linewidth is relatively small compared to the oscillation frequency, as is evident from the persistence of the oscillations in the low-temperature data, and only grows slightly approaching the commensurate-incommensurate phase transition.
Between and K the oscillations persist, but their form changes from the cosinusoidal form described by equation 1 with to the Bessel function form described by equation 2 as expected from the incommensurate behaviour determined by neutron diffraction. vakninprl While it is possible to obtain convergent fits to Eq. 1 with as a free parameter the quality of fit is markedly poorer than for Eq. 2 and the difference is obvious even to the eye. The oscillation frequency, , linewidth, , and relaxation rate are shown in Fig. 2 (a), (b), and (c) respectively. The linewidth grows more rapidly in this temperature region which suggests that it is dominated by critical fluctuations approaching .
Fitting the oscillation frequencies shown in Fig. 2 (a) using Eq. 3, extended to two phases with different values in each phase but a continuous order parameter, leads to the parameters: K, MHz, , , and , the last two parameters being in the commensurate (C) and incommensurate (IC) ordered phases respectively. The relaxation rate does not display any clear trend in the lowest temperature phase but there is a distinct rise in the incommensurate phase. Above the data take the exponential form typical of paramagnets where the electronic spin fluctuations are fast compared to the distribution of local fields. The relaxation rate also appears to vary critically above .
In the inset to Fig. 2 (a) we show the reduced oscillation frequencies plotted against reduced temperature, taking and as the fixed points for and respectively. Trends following the expected values for the two phases are sketched as guides to the eye, without the parameter used in fitting the trend shown in the main panel. A kink in the plot of against is evident at the commensurate-incommensurate phase transition.
III.2
LiCoPO4 has been found to be a model example of a magnet intermediate between 2D and 3D exchange coupling. vakninprbco This gives rise to some unusual critical behaviour, with a neutron diffraction study reporting that the temperature dependence of the staggered magnetization follows the form expected for the 2D Ising model and that the critical scattering above K follows a 3D Ising form. vakninprbco The spin waves have also been studied in detail tian , showing that as well as the dispersions predicted by linear spin wave theory, there is an anomalous dispersionless excitation at meV that was suggested to be related to the magnetoelectric effect in this material.
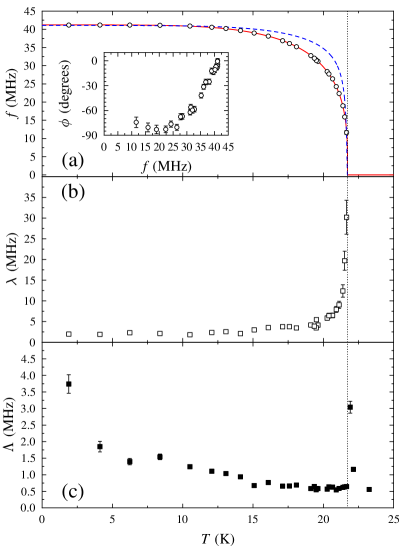
The form of the raw data for LiCoPO4, shown in Fig. 1 (b), is similar to that in the commensurate phase of LiNiPO4, and can be fitted successfully using Eq. 1. However, it was not possible to constrain all the way up to . In such a situation, caution is required in distinguishing between a systematic shift in the time offset of the raw data (arising from an error in determining when muons enter the sample) and a phase offset due to the magnetic field distribution in the sample. Both possibilities were considered in the data analysis. Because the muons were implanted into the sample with their initial spin direction rotated relative to the symmetry axes of the detector system it was possible to use the geometric phase offsets to show that only the phase of the signal was varying with temperature. The data were subsequently analyzed with as a free parameter, leading to the parameters shown in Fig. 3.
The oscillation frequency shows a smooth, monotonic decrease with increasing temperature and can be fitted to the empirical form of Eq. 3 with the parameters: MHz, K, , and . This value of is smaller than that expected for the 3D Ising model (), but considerably larger than that for the 2D Ising model (). Vaknin et al. vakninprbco compared the results of their neutron diffraction measurements to the analytic Onsager/Yang form onsageryang for the temperature dependence of the sublattice magnetization in the 2D Ising model, including an additional multiplicative term to describe the interlayer fluctuations relevant near the crossover to 3D behaviour. Neither the purely 2D model nor the extended version were able to describe above K, although the additional multiplicative term does bring the predicted order parameter closer to the trend we observe. We plot the coupled layer model of Ref. vakninprbco, as a dashed line in Fig. 3 (a) to illustrate this difference. Given the effectiveness of the analytic model below K and the unusually large value of (dominated by these low-temperature data points), it seems that there is a gradual crossover in the effective dimensionality of the system around K that is reflected in the form of the muon data. This is consistent with the 3D fluctuations occurring on the longer timescale probed by muons at a lower temperature than they affect neutron diffraction measurements.
The linewidth shown in Fig. 3 (b) is slightly larger than in LiNiPO4 at low temperature and appears to grow in two stages as is approached: around K there is a small step and above K there is a sharper rise associated with critical fluctuations. The relaxation rate shows almost the opposite temperature dependence to and is considerably larger than in either of the other two samples. There is no sign of a critical divergence approaching from below and these observations suggest that is dominated by a quasistatic distribution of magnetic fields. Above , shows a more conventional critical divergence.
The temperature dependence of the phase is plotted in the inset of Fig. 3 (a). Below K there is only a slow change in but it rapidly changes from to above K. This suggests that, approaching , a magnetic inequivalency develops between muon stopping sites in a manner akin to the intermediate phase in LiNiPO4, albeit less pronounced. While a weakly incommensurate structure could generate such an effect, the sharp increase in occurring at the same temperature as both the departure from the quasi-2D trend in and the growth in the linewidth suggests that in LiCoPO4 the phase shift comes from increasing disorder in the stacking of the magnetic layers while approaching from below.
III.3
LiFePO4 shows a commensurate collinear antiferromagnetic structure below K, with neutron diffraction measurements finding . rousse ; li06 The Fe moments are orientated slightly away from the -axis, expected on the basis of the crystal symmetry. No evidence for short-range order has been observed above , in contrast to the other members of this series.
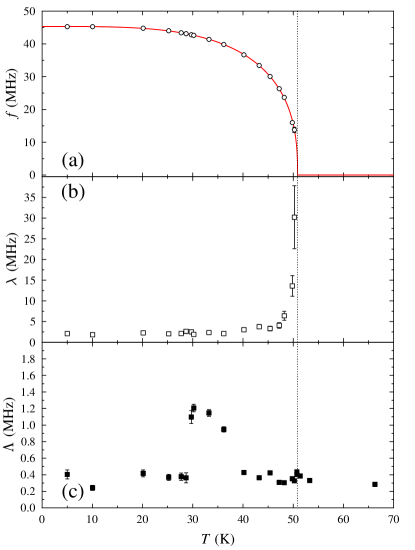
The parameters derived from fits of equation 1 to the LiFePO4 data are shown in Fig. 4. The temperature dependence of the frequency and linewidth behave conventionally, with being well described by equation 3 with parameters: MHz, K, , and . This value of is close to that expected for 3D Heisenberg critical behaviour, as opposed to the value of previously estimated from neutron scattering measurements. rousse ; li06 The linewidth for is considerably smaller than the oscillation frequency and it diverges smoothly approaching .
The relaxation rate behaves differently in LiFePO4, compared with the other two samples. There is only a small increase around but the primary feature occurs at K, well below . Associated with this feature is an increase in the relaxing amplitude of the signal as the temperature is increased. Examining the low-temperature data more carefully allows us to identify a further oscillating component with an amplitude around % of the primary oscillating component, with an oscillation frequency of MHz. This component disappears above K and appears to be replaced by the strongly relaxing term that causes an increase in . We attribute this behavior to a % impurity phase that is most likely to be FePO4, since LixFePO4 is known to form an LiFePO4:FePO4 binary phase mixture yuan11 and (FePO4) K. battle82
IV High-temperature results for
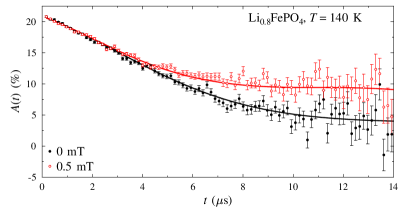
To investigate the lithium diffusion behavior in LixFePO4 we measured three samples with , , and at temperatures between and K and at fields of and mT. By measuring at more than one magnetic field at each temperature it is possible to get a more reliable determination of the fitted parameters, since we have more information on how the field distribution experienced by the muon is decoupled by the field applied parallel to the initial muon spin polarization. Examples of the raw data at the two magnetic fields used are shown in Fig. 5 with the fits described below.
For our high-temperature measurements on LixFePO4 we assume a Gaussian distribution of random local fields due to the various magnetic moments present in the sample. For a static magnetic system this would lead to a muon depolarization described by the Gaussian Kubo-Toyabe function. hayano79 Any fluctuations present within the muon time window, which may be caused by either lithium or muon diffusion, can be treated using the strong collision approximation, leading to a dynamic Kubo-Toyabe function. hayano79 Analysis of the data measured at a series of fields and temperatures using such a dynamic Kubo-Toyabe function proved to be unsuccessful. In studies of lithium-containing battery materials it has been usual to multiply the dynamic Gaussian Kubo-Toyabe function by an exponential relaxation to eliminate any magnetic contribution to the relaxation. sugiyama09 ; kaiser00 ; powell09 ; sugiyama10 This does not lead to reliable fits to our raw data either. A consistently better quality of fit was obtained by applying Keren’s analytic generalization of the Abragam function appropriate for SR, keren multiplied by a temperature-independent relaxation rate fixed for each sample:
| (4) |
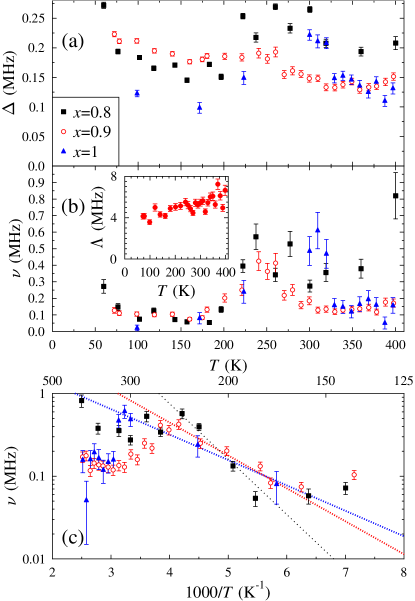
where is defined in Ref. keren, . The parameter describes the quasistatic distribution of field at the muon stopping site, is the temperature-dependent fluctuation rate, is the muon’s Larmor precession frequency in the applied magnetic field, and is due to temperature-independent fluctuations. (After initial unconstrained fits had been made, values were fixed at , , and MHz for the , , and samples respectively.) In the sample we found a strong temperature independent relaxation coming from a minority phase which could be subtracted from the data analysis using , with the values of shown in the inset to Fig. 6 (b). The values of and obtained from these fits are shown in Fig. 6 (a) and (b) respectively.
The values in Fig. 6 (a) show the trend observed in the vast majority of lithium-containing battery materials investigated to date for , where a low-temperature plateau is followed by a smooth decrease to a high-temperature plateau. sugiyama09 ; kaiser00 ; powell09 ; sugiyama10 In the and samples there is a peak at around the temperature where the low-temperature plateau ends in the sample. The values of MHz are broadly similar to those in LixCoO2 sugiyama09 , LiMn2O4, kaiser00 and Li1-xNi1+xO2, sugiyama10 but smaller than in Li3-x-yNixN. powell09
The temperature dependence of follows a similar trend in each sample, with a slight fall from the lowest measured temperature to around K, followed by a smooth rise towards K, and then a sharp drop-off to either the low-temperature value, or in , to the value at the peak. It seems likely that the change observed below 100 K is due to the buildup of magnetic correlations that are not well described by our temperature-independent value. Above 100 K the thermally activated growth in the hopping rate mirrors that observed in LixCoO2 sugiyama09 and Li1-xNi1+xO2, sugiyama10 albeit with a different temperature scale. The behavior above the peak at K may be related to the onset of muon hopping, but this may not be a unique explanation.
| Technique | (cm2s-1) | (meV) |
|---|---|---|
| SR (This study) | ||
| Mössbauer spectroscopy ellis06 | 111Determined around 600 K. | |
| Mössbauer spectroscopy dodd07 | 222Determined around 450 K. | |
| Titration and ac impedance prosini02 | - | |
| Titration churikov10 | - | |
| Impedance franger02 | - | |
| Cyclic voltammetry yu07 | 400 | |
| First-principles calculations morgan04 | 270 | |
| First-principles calculation islam | - | 550 |
| AC and DC conductivity amin08 | - | 620 – 740 |
| AC impedance takahashi02 | - | 155 |
| Electrochemistrywang07 | - | 155 |
Comparing our results to those obtained previously naturally leads to the question of whether the phenomena we observe are associated with the diffusion of lithium and/or muons. The similarity of the temperature dependences of both and to previous results on other materials indeed suggest that they are caused by the same phenomenon. This leaves the further question of whether we can obtain quantitative information about the lithium diffusion from our results. While we could not use the dynamic Gaussian Kubo-Toyabe function multiplied by an exponential used in Refs. sugiyama09, , kaiser00, , and sugiyama10, , the modified Keren function we have employed provides the same information and a more robust fit of our data over the whole measured temperature range. That follows an activated temperature dependence over a similar temperature range to that observed in other materials, as is illustrated in Fig. 6 (c), strongly suggests that up to around K we can assign the change in to lithium diffusion. Above this temperature it is likely that the muons become mobile and this results in either a drop in or as the form of the data changes.
Arrhenius fits to over the thermally activated region allow us to estimate the energy barriers for lithium diffusion, which for , , and are , , and meV respectively. Extrapolating the fits to 300 K for comparison with other measured values gives us estimates of the lithium hopping rate at room temperature of s-1 (), s-1 (), and s-1 (). (The extrapolation to room temperature introduces an error of % in these values whereas the individual points within the measured range have errors around %.)
Taking the primary hopping pathway to be along the -axis nishimura08 we can further estimate the diffusion constant for LiFePO4. The distance travelled in each hop will be and this leads to a diffusion constant . Given these assumptions we estimate cm2s-1 for the sample, and cm2s-1 and cm2s-1 for the and samples respectively.
We can compare our estimates for the activation barrier and diffusion constant to those derived from other techniques, which are summarized in Table 1. Most theoretical work and experiments find for lithium diffusion within the range – meV, delacourt05 ; ellis06 ; molenda06 ; amin08 ; hoangxx although there is both theoretical and experimental evidence for – meV. takahashi02 ; shi03 ; morgan04 ; wang07 Smaller energy barriers have been suggested for the electronic conduction via the hopping of small polarons and it has been argued that the polaron hopping may be correlated with the hopping of lithium ions. ellis06 ; maxisch06 ; hoangxx The activation energy of meV that we observe suggests that the hopping process observed by the muons is unlikely to be associated with a barrier as large as meV and this suggests that another, perhaps correlated, process facilitates lithium diffusion at lower temperatures.
The disparity between measurements of from different techniques is far greater than that seen for , with values ranging from to cm2s-1. prosini02 ; franger02 ; ellis06 ; yu07 ; churikov10 Theoretical work morgan04 and local measurements, such as Mössbauer spectroscopy, ellis06 ; dodd07 seem to give larger values of – cm2s-1 than bulk measurements, which give – cm2s-1 (Ref. churikov10, ). Our estimate lies within the overlap of these groups. This suggests that there is a difference between microscopic and bulk determinations of which could result from the effect of the LiFePO4/FePO4 phase boundary motion or mesoscopic barriers to lithium diffusion such as the blocking of diffusion channels by FeLi defects and grain boundaries, the latter accentuated by the habit of crystallites to be platelets with the -axis as their shortest dimension.
V Conclusion
We have used SR to provide a new window on both the magnetic and diffusive properties of this series of olivine phosphates. This has shown how the commensurate-incommensurate phase transition in LiNiPO4 occurs without a discontinuity in the internal field at the muon stopping site; how the nature of the fluctuations approaching in LiCoPO4 are more three-dimensional in the muon time window than those found to be quasi-two dimensional in neutron scattering measurements; and that the ordering of LiFePO4 is more conventional than the other two materials studied, though again the three-dimensional fluctuations are more evident in determining the behavior of the order parameter approaching . Our measurements also provide a new means of investigating the process of lithium diffusion in LixFePO4, finding a diffusion constant cm2s-1 and an energy barrier of meV.
Shortly before we submitted this paper Ref. sugiyama11, was published reporting analogous measurements of LiFePO4. Two oscillating components and a fast relaxing component were observed to extend up to suggesting that the higher frequency component may originate in a metastable muon site or nearly degenerate muon sites between which the muon hops. The high-temperature data were parameterized slightly differently but led to nearly identical values of both and .
Acknowledgements.
Parts of this work were performed at the Swiss Muon Source, Paul Scherrer Institute, Villigen, CH and the ISIS Facility, UK. We thank A. Amato for experimental assistance and the EPSRC and STFC (UK) for financial support.References
- (1) S. Geller and J. L. Durand, Acta Cryst. 13, 325 (1960).
- (2) D. Vaknin, J. L. Zarestky, J.-P. Rivera, and H. Schmid, Phys. Rev. Lett. 92, 207201 (2004).
- (3) I. Kornev, M. Bichurin, J.-P. Rivera, S. Gentil, H. Schmid, A. G. M. Jansen, and P. Wyder, Phys. Rev. B 62, 12247 (2000).
- (4) B. B. Van Aken, J.-P. Rivera, H. Schmid, and M. Fiebig, Nature 449, 702 (2007).
- (5) A. K. Padhi, K. S. Nanjundaswamy, and J. B. Goodenough, J. Electrochem. Soc. 144, 1188 (1997).
- (6) A. Yamada, S. C. Chung, and K. Hinokuma, J. Electrochem. Soc. 148, A224 (2001).
- (7) M. S. Whittingham, Y. Song, S. Lutta, P. Y. Zavalij, and N. A. Chernova, J. Mater. Chem. 15, 3362 (2005).
- (8) T. Ohzuku and R. Brodd, J. Power Sources 174, 449 (2007).
- (9) L.-X. Yuan, Z.-H. Wang, W.X. Zhang, X.-L. Hu, J.-T. Chen, Y.-H. Huang, and J. B. Goodenough, Energy Environ. Sci. 4, 269 (2011).
- (10) B. Ellis, L. K. Perry, D. H. Ryan, and L. F. Nazar, J. Am. Chem. Soc. 128, 11416 (2006).
- (11) J. L. Dodd, I. Halevy, and B. Fultz, J. Phys. Chem. C 111, 1563 (2007).
- (12) P. P. Prosini, M. Lisi, D. Zane, and M. Pasquali, Solid State Ionics 148, 45 (2002).
- (13) A. V. Churikov, A. V. Ivanishchev, I. A. Ivanishcheva, V. O. Sycheva, N. R. Khasanova, and E. V. Antipov, Electrochem. Acta 55, 2939 (2010).
- (14) S. Franger, F. Le Cras, C. Bourbon, and H. Rouault, Electrochem. Solid-State Lett. 5, A231 (2002).
- (15) D. Y. W. Yu, C. Fietzek, W. Weydanz, K. Donoue, T. Inoue, H. Kurokawa, and S. Fujitani, J. Electrochem. Soc. 154, A253 (2007).
- (16) D. Morgan, A. Van der Ven, and G. Ceder, Electrochem. Sol.-Stat. Lett. 7, A30 (2004).
- (17) M. S. Islam, D. J. Driscoll, C. A. J. Fisher, and P. R. Slater, Chem. Mater. 2005, 5085.
- (18) R. Amin, J. Maier, P. Balaya, D. P. Chen, and C. T. Lin, Solid State Ionics 179, 1683 (2008).
- (19) M. Takahashi, S. Tobishima, K. Takei, and Y. Sakurai, Solid State Ionics 148, 283 (2002).
- (20) C. Wang and J. Hong, Electrochem. Solid-State Lett. 10 A65 (2007).
- (21) T. Maxisch, F. Zhou, and G. Ceder, Phys. Rev. B 73, 104301 (2006).
- (22) K. Hoang and M. Johannes, arXiv:1105.3492 (unpublished).
- (23) J. Cabana, J. Shirakawa, G. Chen, T. J. Richardson, and C. P. Grey, Chem. Mater. 22, 1249 (2010).
- (24) S. J. Blundell, Contemp. Phys. 40, 175 (1999).
- (25) A. Yaouanc and P. D. de Réotier, Muon Spin Rotation, Relaxation, and Resonance (Oxford University Press, Oxford, 2011).
- (26) R. Kadono, J. Imazato, T. Matsuzaki, K. Nishiyama, K. Nagamine, T. Yamazaki, D. Richter, and J.-M. Welter, Phys. Rev. B 39, 23 (1989).
- (27) J. Sugiyama, K. Mukai, Y. Ikedo, H. Nozaki, M. Månsson, and I. Watanabe, Phys. Rev. Lett. 103, 147601 (2009).
- (28) C. T. Kaiser, V. W. J. Verhoeven, P. C. M. Gubbens, F. M. Mulder, I. de Schepper, A. Yaouanc, P. Dalmas de Réotier, S. P. Cottrell, E. M. Kelder, and J. Schoonman, Phys. Rev. B 62, R9236 (2000).
- (29) M. J. Ariza, D. J. Jones, J. Rozière, J. S. Lord, and D. Ravot, J. Phys. Chem. B, 2003, 6003.
- (30) P. C. M. Gubbens, M. Wagemaker, S. Sakarya, M. Blaauw, A. Yaouanc, P. Dalmas de Réotier, and S. P. Cottrell, Solid State Ionics 177, 145 (2006).
- (31) A. S. Powell, J. S. Lord, D. H. Gregory, and J. J. Titman, J. Phys. Chem. C 113, 20758 (2009).
- (32) K. Mukai, J. Sugiyama, Y. Ikedo, H. Nozaki, K. Shimomura, K. Nishiyama, K. Ariyoshi, and T. Ohzuku, J. Power Sources 174, 711 (2007).
- (33) J. Sugiyama, Y. Ikedo, K. Mukai, H. Nozaki, M. Månsson, O. Ofer, M. Harada, K. Kamazawa, Y. Miyake, J. H. Brewer, E. J. Ansaldo, K. H. Chow, I. Watanabe, and T. Ohzuku, Phys. Rev. B 82, 224412 (2010).
- (34) V. W. J. Verhoeven, I. M. de Schepper, G. Nachtegaal, A. P. M. Kentgens, E. M. Kelder, J. Schoonman, and F. M. Mulder, Phys. Rev. Lett. 86, 4314 (2001).
- (35) K. Nakamura, H. Ohno, K. Okamura, Y. Michihiro, T. Moriga, I. Nakabayashi, and T. Kanashiro, Solid State Ionics 177, 821 (2006).
- (36) F. L. Pratt, Physica B 289-290, 710 (2000).
- (37) Yu. N. Kharchenko, N. F. Kharcheno, M. Baran, and R. Szymczak, Low Temp. Phys. 29, 579 (2003).
- (38) D. Vaknin, J. L. Zarestky, J. E. Ostenson, B. C. Chakoumakos, A. Goñi, P. J. Pagliuso, T. Rojo, and G. E. Barberis, Phys. Rev. B 60, 1100 (1999).
- (39) T. B. S. Jensen, N. B. Christensen, M. Kenzelmann, H. M. Rønnow, C. Niedermayer, N. H. Andersen, K. Lefmann, M. Jiménez-Ruiz, F. Demmel, J. Li, J. L. Zarestky, and D. Vaknin, Phys. Rev. B 79, 092413 (2009).
- (40) D. Vaknin, J. L. Zarestky, L. L. Miller, J.-P. Rivera, and H. Schmid, Phys. Rev. B 65, 224414 (2002).
- (41) W. Tian, J. Li, J. W. Lynn, J. L. Zarestky, and D. Vaknin, Phys. Rev. B 78, 184429 (2008).
- (42) L. Onsager, Phys. Rev. 65, 117 (1944); C. N. Yang, ibid. 85, 809 (1952).
- (43) G. Rousse, J. Rodriguez-Carvajal, S. Patoux, and C. Masquelier, Chem. Mater. 2003, 4082.
- (44) J. Li, V. O. Garlea, J. L. Zarestky, and D. Vaknin, Phys. Rev. B 73, 024410 (2006).
- (45) P. D. Battle, A. K. Cheetham, C. Gleitzer, W. T. A. Harrison, G. J. Long, and G. Longworth, J. Phys. C, 15, L919 (1982).
- (46) R. S. Hayano, Y. J. Uemura, J. Imazato, N. Nishida, T. Yamazaki, and R. Kubo, Phys. Rev. B 20, 850 (1979).
- (47) A. Keren, Phys. Rev. B 50, 10039 (1994).
- (48) S. Nishimura, G. Kobayashi, K. Ohoyama, R. Kanno, M. Yashima, and A. Yamada, Nature Materials 7, 707 (2008).
- (49) C. Delacourt, P. Poizot, J.-M. Tarascon and C. Masquelier, Nature Mater. 4, 254 (2005).
- (50) J. Molenda, W. Ojczyk, K. Swierczek, W. Zajac, F. Krok, J. Dygas, and R.-S. Liu, Solid State Ionics 177, 2617 (2006).
- (51) S. Q. Shi, L. J. Liu, C. Y. Ouyang, D. S. Wang, Z. X. Wang, L. Q. Chen, and X. J. Huang, Phys. Rev. B 68, 195108 (2003).
- (52) J. Sugiyama, H. Nozaki, M. Harada, K. Kamazawa, O. Ofer, M. Månsson, J. H. Brewer, E. J. Ansaldo, K. H. Chow, Y. Ikedo, Y. Miyake, K. Ohishi, I. Watanabe, G. Kobayashi, and R. Kanno, Phys. Rev. B 84, 054430 (2011).