H2O Maser Polarization of the Water Fountains IRAS 154455449 and IRAS 180432116
Abstract
We present the morphology and linear polarization of the 22-GHz H2O masers in the high-velocity outflow of two post-AGB sources, d46 (IRAS 154455449) and b292 (IRAS 180432116). The observations were performed using The Australia Telescope Compact Array. Different levels of saturated maser emission have been detected for both sources. We also present the mid-infrared image of d46 overlaid with the distribution of the maser features that we have observed in the red-shifted lobe of the bipolar structure. The relative position of the observed masers and a previous radio continuum observation suggests that the continnum is produced along the blue-shifted lobe of the jet. It is likely due to synchrontron radiation, implying the presence of a strong magnetic field in the jet. The fractional polarization levels measured for the maser features of d46 indicate that the polarization vectors are tracing the poloidal component of the magnetic field in the emitting region. For the H2O masers of b292 we have measured low levels of fractional linear polarization. The linear polarization in the H2O maser region of this source likely indicates a dominant toroidal or poloidal magnetic field component. Since circular polarization was not detected it is not possible to determine the magnetic field strength. However, we present a - evaluation of the upper limit intensity of the magnetic field in the maser emitting regions of both observed sources.
keywords:
masers – stars: AGB and post-AGB – stars: late-type – stars: magnetic fields – polarization – stars: circumstellar matter.1 INTRODUCTION
Post-Asymtoptic Giant Branch (post-AGB) stars represent a very short phase in the evolution of
low and intermediate initial mass stars ().
During the post-AGB phase, the high mass-loss rate () observed at the
end of the Asymtoptic Giant Branch (AGB) evolution decreases. Simultaneously, the effective temperature of
the central star increases, while the circumstellar envelope (CSE) slowly detaches from the star
(see Habing & Olofsson 2003 for a review).
The post-AGB phase ends when the central star
is hot enough to ionize the material which was ejected from the AGB phase,
forming a new Planetary Nebula (PN) (e.g. van Winckel 2003). It is generally assumed
that the mass-loss process along the evolution
in the AGB is spherically symmetric (Habing & Olofsson, 2003). However, a high
percentage of PNe have been observed showing aspherical symmetries that include
elliptical, bipolar or multipolar shapes. It is still not clear at
what point in the evolution toward a PNe the departure from the spherical
symmetry starts and even more importantly, what the physical processes
involved to form the complex shapes observed are. Companion interactions, binary sources, magnetic fields,
fast and slow wind interaction, disks and a combination of these have been considered as
the main factors to shape PNe (e.g. Sahai et al. 2011, Balick & Frank 2002 and references therein).
Hydroxyl (OH) and Water (H2O) maser emission have been observed in the CSE of the
progenitors of the (pre-)PNe. Typically, for spherically symmetric CSEs, the double peak spectra
of the OH masers defines the most blue- and red-shifted velocities
in the CSE with respect to the stellar velocity. The velocity range of the H2O maser spectra is narrower than
the OH velocity distribution, and the H2O masers are confined closer to the central star.
A class of post-AGB stars, the so called “Water Fountains”, is characterized by the detection of
H2O maser emission over an unusually large velocity range broader than
the velocity range defined by the OH maser emission (Likkel & Morris, 1988). Sources
with H2O maser velocity spread over a range of
have been detected (e.g. Likkel & Morris 1988, Deacon et al. 2007, Walsh et al. 2009, Gomez et al. 2011). Those
H2O masers have been observed in regions where the interaction between the
high-velocity outflow and the slow AGB wind seems to be active, hence the H2O
masers are probably excited in the post-shock region.
Recent infrared imaging of water fountains have revealed bipolar and multipolar morphologies (Lagadec et al., 2011).
Vlemmings et al. (2006) have detected circular and linear polarization in the H2O
maser features along the jet of W43A, the archetypal water fountain. They found that the jets of W43A are magnetically
collimated. Therefore, the detection of polarized maser emission from water fountains is useful to determine the role
of the magnetic fields on the onset of wind asymmetries during the evolution from AGB stars to aspherical PNe.
Here we report the detection of linear polarization of 22-GHz H2O maser emission from two water fountains
d46 and b292 (IRAS 154455449, IRAS 180432116).


2 OBSERVATION AND DATA REDUCTION
The Australia Telescope Compact Array (ATCA) was used to observe the H2O maser emission
from d46 (IRAS 154455449) on 2006 November 28-30 using the 6B array configuration, and b292 (IRAS 180432116)
on 2007 July 6-9 with the 6C array configuration. The full track of observations of d46 was 8 hr, consisting of observations of the
source interspersed with scans on the phase calibrator 1613586. Later, b292 was observed over 16 hr, and
likewise, its observations were interleaved with a
phase reference source, 1730130. The primary flux calibrator source,
1934638, was observed during each observation program. The flux density of 1934638 at 22.2-GHz was taken to be
0.81 Jy. Both observations were performed in full polarization
mode, with rest frequency of 22.23508-GHz, using 4-MHz bandwidth with 1024 spectral channels,
covering a velocity width 50 and a velocity resolution of
. Before starting the full observations, some
snapshots were carried out, for each source, to determine at what range of velocity the brightest
emission occurred. As we could not cover the entire velocity range, the observing bands were centered
on the brightest emission peak.
The data reduction was performed using the MIRIAD package (Sault & Killeen, 2010). After flagging bad
visibilities, the flux density for each phase calibrator was determined using the flux density of
primary flux calibrator. We obtained flux densities of 1.83 Jy and 2.83 Jy for 1613586 and
1730130 respectively. Both sources were used to perform the polarization calibration as well as
to determine amplitude and phase solutions, which were applied to the corresponding target data set.
For polarization analysis, image cubes for stokes I, Q, U and V were created.
The resulting noise level in the emission free channels of the I cube of d46
was 37 , whereas that of b292 was 13 .
The stokes I image cubes were analysed using the AIPS task
SAD, which was used to fit, channel by channel, all the components with peak flux densities
higher than five times the rms with two-dimensional Gaussians. Only those maser features found in at least five consecutive channels
were considered reliable detections. The Right Ascension and
Declination for the maser features were calculated as the mean position for each set of
consecutive channels. Figure 1 shows the H2O maser spectra for both sources.
| d46 (IRAS 154455449) | ||||||
| Peak Intensity | RA | DEC | ||||
| Feature | (Jy ) | (15 48 X) | (54 58 X) | (km ) | (per cent) | (deg) |
| 1 | 11.662 | 19.4063 | 20.165 | 137.6 | 4.1 0.6 | 73.0 1.6 |
| 2 | 2.055 | 19.4064 | 20.155 | 136.5 | 7.5 0.7 | 40.7 4.6 |
| 3 | 0.909 | 19.4025 | 20.099 | 129.9 | – | – |
| 4 | 0.537 | 19.4086 | 20.090 | 128.9 | – | – |
| 5 | 5.021 | 19.3972 | 19.942 | 123.8 | – | – |
| 6 | 9.077 | 19.4032 | 20.069 | 120.4 | 3.4 0.9 | 51.6 13.1 |
| 7111Reference features in figure 2 and 3 | 11.883 | 19.4038 | 20.083 | 119.5 | 2.9 0.5 | 56.5 4.8 |
| 8 | 10.334 | 19.4029 | 20.057 | 116.1 | 8.3 0.9 | 83.4 2.7 |
| 9 | 0.351 | 19.3950 | 19.922 | 114.9 | – | – |
| 10 | 0.735 | 19.3736 | 19.363 | 113.2 | – | – |
| 11 | 0.820 | 19.4012 | 20.041 | 110.8 | – | – |
| 12 | 1.166 | 19.3994 | 19.997 | 109.5 | – | – |
| 13 | 1.380 | 19.3897 | 19.977 | 108.4 | – | – |
| 14 | 2.055 | 19.4011 | 20.011 | 106.4 | – | – |
| 15 | 1.619 | 19.3960 | 19.898 | 105.3 | – | – |
| 16 | 2.201 | 19.3564 | 19.933 | 104.2 | – | – |
| 17 | 2.606 | 19.3912 | 19.851 | 102.8 | – | – |
| 18 | 2.922 | 19.3598 | 19.889 | 100.3 | – | – |
| 19 | 7.142 | 19.3593 | 19.858 | 98.6 | – | – |
| 20 | 3.209 | 19.3601 | 19.824 | 97.3 | – | – |
| b292 (IRAS 180432116) | ||||||
| Peak Intensity | RA | DEC | ||||
| Feature | (Jy ) | (18 07 X) | (21 16 X) | (km ) | (per cent) | (deg) |
| 1 | 2.820 | 20.8484 | 11.845 | 44.7 | – | – |
| 2 | 0.751 | 20.8485 | 11.891 | 47.7 | – | – |
| 3 | 0.240 | 20.8500 | 11.886 | 54.3 | – | – |
| 4a | 11.206 | 20.8480 | 11.860 | 60.8 | 1.3 0.2 | 4.2 4.9 |
| 5 | 10.821 | 20.8485 | 11.865 | 62.9 | 1.5 0.2 | 6.8 7.3 |
| 6 | 0.942 | 20.8483 | 11.844 | 69.4 | – | – |
| 7 | 0.500 | 20.8488 | 11.835 | 72.0 | – | – |
| 8 | 1.023 | 20.8477 | 11.838 | 74.3 | – | – |
| 9 | 0.667 | 20.8484 | 11.880 | 77.6 | – | – |
| 10 | 0.163 | 20.8476 | 12.040 | 79.8 | – | – |
3 RESULTS
In Table 1, we present the results of the analysis of the
H2O masers features of d46 and b292. We list the peak
intensity, the position as RA and DEC, LSR velocity (),
fractional linear polarization () and polarization angle
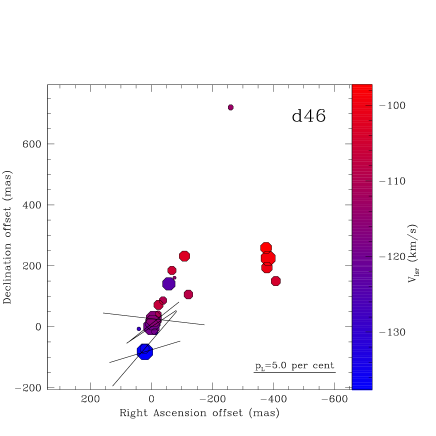
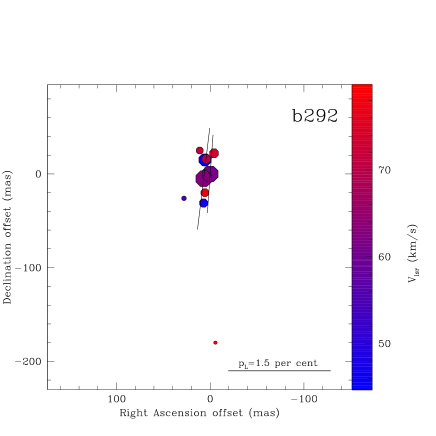
(). In Figure 2 we show
a map of the H2O maser regions for both observed sources.
The size of each feature is scaled according to the peak intensity, the
radial velocity is colour-coded and the vectors show the polarization
angles. We have identified twenty H2O maser features for d46, with
emission detected at velocities from to , red-shifted
respect to the systemic velocity (Deacon et al., 2007).
Fractional linear polarization has been detected for five of the twenty features, particularly for the most
blue-shifted features, with levels from per cent to per cent. No significant
circular polarization was detected.
Ten H2O maser features have been identified in our observation of b292, with emission at velocities
from to . Deacon et al. (2004) have derived
the systemic velocity of the source from the double-peaked 1665-MHz spectrum, obtaining
a stellar velocity of . Thus, because of the limited bandwidth,
our observation was restricted to blue-shifted velocities only.
Fractional linear polarization was detected only for the two brightest features.
As presented in table 1, not only are the fractional linear polarization levels for both features
almost the same, but so is the polarization angle. As was the case for d46,
no significant circular polarization was detected.

4 DISCUSSION
4.1 d46 (IRAS 154455449, OH326.53000.419)
4.1.1 Previous Observations
According to the MSX ([812],[1521]) and IRAS ([1225],[2560]) two-colour diagrams, d46 has been classified as a
highly-evolve late post-AGB object (Sevenster. 2002, Deacon et al. 2004, Bains et al. 2009). After 22-GHz H2O maser
emission was detected with a velocity range
beyond that of the OH masers, it was classified as a water fountain source (Deacon et al., 2007).
Both main-line and 1612-MHz OH maser emission have been detected toward
d46 (Sevenster et al. 1997b, Deacon et al. 2004). Based on the irregular
line profile of the three lines detected, Deacon et al. (2004) suggested
that the source was likely a bipolar object, since irregular OH maser profiles
are associated with sources that almost certainly have bipolar outflows and a remnant
AGB wind. This hypothesis was confirmed by the Mid-infrared images (11.85 and 12.81 )
of the source, obtained with VISIR/VLT and recently published by Lagadec et al. (2011).
From the images the bipolar structure of the object is clear, with
dust emission around the jet lobes. Indeed, the infrared photometry and the IRAS LRS
data reported in the literature (Bains et al. 2009, Lagadec et al. 2011) show that the contribution
at short wavelengths, which is due to the photospheric component,
is still weak and the double-peaked infrared SED, characteristic
of post-AGB objects, is mainly dominated by the dust emission. Therefore,
the central star is surrounded by an optically thick structure (Lagadec et al., 2011)
which could be a dense equatorial torus.
Non-thermal radio continuum emission has been detected at 3, 6 and 13 cm
(Cohen et al. 2006, Bains et al. 2009) with significant flux variation among the observations
(spectral index Cohen et al. 2006, Bains et al. 2009).
Such detections have been associated with synchrotron emission produced by shocks
between the high-velocity wind and the slow AGB remnant. The flux variation has
been interpreted as episodic shocks between both wind components.
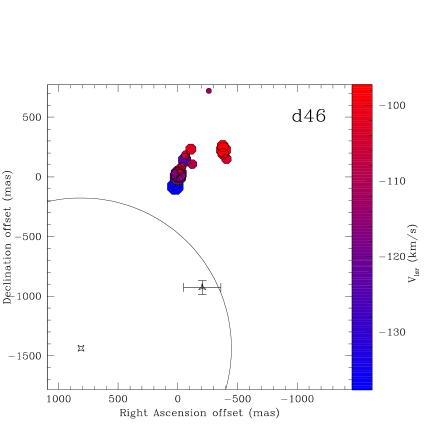
4.1.2 The H2O masers
We have observed H2O maser features only from the red-shifted velocities with respect to the OH maser features, which are centered at (Deacon et al., 2007). The brightest features were detected between 115.0 and 140.0 km , considering the overlapped region, the overall H2O spectrum that we have detected is quite similar to the spectrum detected by Deacon et al. (2007), although as expected with some difference of the flux densities. Figure 2 (left) shows that the projected spatial distribution of the H2O maser features resembles a bow-shock-like structure, similar to that observed by Boboltz & Marvel (2005) for the water fountain OH 12.80.9. Figure 3 (left) shows both the OH and radio continuum positions with respect to the projected distribution of the 22-GHz H2O maser features that we have detected. The solid circle represents the uncertainty on the OH position, the error bars show the accuracy of the radio continuum position, whereas the error on the H2O maser position of each feature is within the size of the symbols. The offset of the radio continuum position with respect to that of the H2O maser agrees very well with the mid-infrared image, and it seems likely that both emitting region are at different points along the jet. In fact, since the H2O maser features have been produced at the red-shifted side of the jet, the position of the radio continuum could be related to the position of the central star. But, because the spectral index of the radio continuum implies non-thermal emission (Deacon et al., 2007) it is more likely synchrotron radiation produced at a region along the jet. This suggests the presence of a strong magnetic field along the axis defined by the direction of the high-velocity outflow. In Figure 4 we show the Mid-Infrared image of d46 recently published by Lagadec et al. (2011). The corrected position of the center of the mid-infrared image is RA 15 48 19.420, DEC 54 58 20.100, with an error circle of radius 2 arcsec (Lagadec, private comunication). Thus, as the relative positions are not known accurately enough, for illustration we have overlaid the H2O maser features with the red-shifted lobe. The offset of the continuum emission suggest that it could arise from the blue-shifted lobe, as an effect of a strong magnetic field, as mentioned above. Although the error of the OH position encloses part of the blue-shifted lobe, it is likely produced in the outer shells of the CSE where the gas has been accelerated to high velocities through wind-wind collisions.
4.1.3 Magnetic field
Two of the maser features were detected to have a high percentage of linear polarization ( per cent), which likely is a result of maser emission in the saturated regime (Vlemmings et al., 2006). For H2O masers, the percentage of linear polarization depends on the degree of saturation of the emiting region and on the angle () between the direction of the maser propagation and the magnetic field lines. Additionally, there is a critical value , such that if , the polarization vectors are parallel to the magnetic field lines, otherwise they both are perpendicular. According to the levels measured, the polarization vectors in figure 2 should be perpedicular to the magnetic field lines. The vectors then appear to trace the poloidal field component, ie, along the direction of the high-velocity outflow. We did not detect circularly polarized emission. As the masers are relatively weak the resulting 3- magnetic field limit is high, mG.
4.2 b292 (IRAS 180432116, OH009.10.4)
4.2.1 Previous Observations
According to its position on the ([8][12],[15][21]) MSX two-colour diagram (Sevenster., 2002), b292 is likely to be a young post-AGB object (Sevenster. 2002, Deacon et al. 2004) . This source was confirmed as a water fountain by Deacon et al. (2007), who have detected 22-GHz H2O maser emission over a wide velocity range of . In later observations performed by Walsh et al. (2009) H2O maser emission over the even larger velocity range of has been detected, one of the largest velocity spread in any Galactic H2O maser source. Until the recent observation of Gomez et al. (2011), it was the water fountain with the largest range in H2O maser velocities. In addition, b292 was the first post-AGB object discovered with emission from the 1720-MHz OH satellite line (Sevenster & Chapman, 2001). The 1720-MHz OH transition is produced in regions with special conditions of temperature and density and it is often associated with both Galactic star-forming regions (SFRs) and Supernova remnants (Lockett et al., 1999). Its detection is interpreted as an indicator of the existence of C-shocks in the emitting regions. The detection of OH maser emission at 1665-MHz and 1612-MHz associated with the position of the 1720-MHz maser region did confirm that all the OH maser transitions are related to the same stellar source (Deacon et al., 2004). In fact, the position offset from the 1665-MHz and 1612-MHz emitting region is less than 0.3” (Sevenster & Chapman, 2001). Neither Sevenster & Chapman (2001) nor Deacon et al. (2004) have detected the OH 1667-MHz maser transition, which is unusual for a source having maser emission at 1665-MHz.
4.2.2 The H2O masers
As mentioned above, Walsh et al. (2009) have detected H2O maser emission at both blue-shifted
and red-shifted velocities relative to the systemic velocity. The projected spatial distribution
and position of such features within the same velocity range (e.g. Figure 2 of Walsh et al. (2009))
is quite consistent with the projected position of those features that we have detected (Figure 2).
But, considering that the observations were carried out with a time period of almost a year in between,
it is important to point out the strong variability of the maser flux intesity.
In our spectra (figure 1 right) there is no maser emission at ,
while Walsh et al. (2009) detected the brightest peak at that velocity. Besides, they have detected our brightest
feature at only a half the intensity.
As pointed out by Walsh et al. (2009), the spread in the projected distribution of the maser features with the most extreme
velocities could be caused by a very small angle between the jet propagation
direction and the line-of-sight. In addition, Sevenster & Chapman (2001) have pointed out that the lack of a second (red-shifted)
peak of the 1720-MHz OH maser emission might be because the line-of-sight
is almost parallel to the jet propagation direction. Although high-resolution images have not
been obtained, we can thus assume that we are looking at the emerging
jet almost pole-on. From Walsh et al. (2009), the projected orientation in the sky of the jets is East-West.
The 22-GHz H2O maser transition is probably excited
by the shock front of the high-velocity outflow, which hits the slow expanding
AGB envelope. Surcis et al. (2011) have reported detection
of 22-GHz H2O maser emission produced in regions under C-shock conditions in a high mass SFR.
In late-type stars, C-shocks should be produced at the tip of the emergent outflows,
whereas the post-shock region seems to achieve the necessary conditions to produce the
1720-MHz OH maser emission. Figure 3 (right) indicates the position of the
OH maser reported by Sevenster et al. (1997a) relative to the 22-GHz H2O maser features identified in our analisys.
The uncertainty of the OH maser position is represented by the solid circle.
4.2.3 Magnetic field
The fractional polarization level detected for the brightest features is low ( per cent) and corresponds to non-saturated H2O maser emission. Consequently, the polarization vectors could be either perpendicular or parallel to the magnetic field component projected in the sky plane. Considering the projected jet direction is East-West, this implies that the B-field is either almost exactly parallel or perpendicular to the jet. The field in the H2O maser region of b292 is thus potentially toroidal, as observed for W43A (Vlemmings et al., 2006) or poloidal as seen in d46. Significant levels of circular polarization were not detected. The 3- upper limit for the field strength is mG.
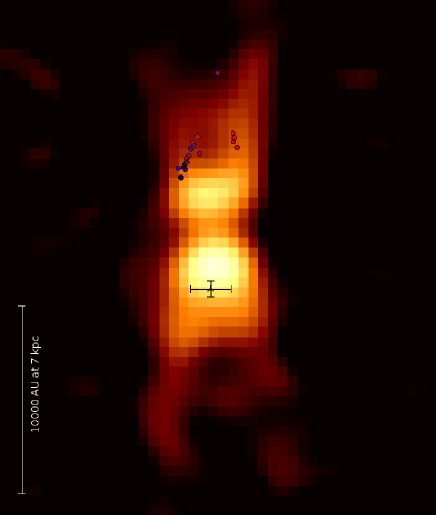
5 CONCLUSIONS
We have used the ATCA to observe high-velocity H2O emission from two late-type stars, d46 and b292. We have presented new high angular resolution images of the H2O maser emission in parts of the jet and measured linear polarization for both sources. The first H2O maser maps of d46 show a bow-shock morphology similar to that of OH 12.80.9. According to the level of that we have measured, the maser emission is in the saturated regime, and the polarization vectors should be perpendicular to the magnetic field lines, which consequently are the poloidal component. In Figure 4 we have overlaid the position of the masers with the red-shifted lobe of the jet on the mid-infrared VLTI image of d46 from Lagadec et al. (2011). The relative position of the radio continuum emission with respect to those maser features suggest that it is arising from the blue-shifted lobe and is likely due to synchrotron radiation, indicating the potential presence of a significant magnetic field in the jet. Circular polarization was not detected, and we cannot infer the magnetic field strength along the line-of-sight to better than a 3- limit of mG for d46. New polarization observations, including that of the radio continuum emission and a broader velocity range of the H2O spectrum could give accurate measurements of the magnetic field strength along the jets of d46. For the H2O of b292 we have measured low levels, and the polarization vectors could be either parallel or perpendicular to the magnetic field lines projected on the sky plane. In fact, the projection of the jets in the sky is likely East-West, and the polarization vectors could be associated to either the poloidal (i.e. East-West) or toroidal (i.e. North-South) component of the B-field. Also in this case, no significant levels of circular polarization were not detected. The 3- upper limit for the magnetic field strength, is mG.
Acknowledgments
The Australia Telescope Compact Array is part of the Australia Telescope National Facility which is funded by the Commonwealth of Australia for operation as a National Facility managed by CSIRO. This research was supported by the Deutsche Forschungsgemeinschaft (DFG) through the Emmy Noether Research grant VL 61/3-1.
References
-
Bains et al. (2009)
Bains, I., Cohen, M., Chapman, J. M., Deacon, R. M.,
& Redman, M. P. 2009, MNRAS, 397, 1386 - Balick & Frank (2002) Balick, B., & Frank, A. 2002, Ann. Rev. A&A, 40, 439
- Boboltz & Marvel (2005) Boboltz, D. A., & Marvel, K. B. 2005, ApJL, 627, L45
- Cohen et al. (2006) Cohen, M., Chapman, J. M., Deacon, R. M., Sault, R. J., Parker, Q. A., & Green, A. J. 2006, MNRAS, 369, 189
- Deacon et al. (2004) Deacon, R. M., Chapman, J. M., & Green, A. J. 2004, ApJS, 155, 595
- Deacon et al. (2007) Deacon, R. M., Chapman, J. M., Green, A. J., & Sevenster, M. N. 2007, ApJ, 658, 1096
- Gomez et al. (2011) Gomez, J. F., Rizzo, J. R., Suarez, O., Miranda, L. F., Guerrero, M. A., & Ramos-Larios, G. 2011, arXiv:1105.5202
- Habing & Olofsson (2003) Habing, H. J., & Olofsson, H. 2003, Asymptotic giant branch stars, by Harm J. Habing and Hans Olofsson. Astronomy and astrophysics library, New York, Berlin: Springer, 2003.
- Lagadec et al. (2011) Lagadec, E., et al. 2011, arXiv:1102.4561
- Likkel & Morris (1988) Likkel, L., & Morris, M. 1988, ApJ, 329, 914
- Lockett et al. (1999) Lockett, P., Gauthier, E., & Elitzur, M. 1999, ApJ, 511, 235
- Sahai et al. (2011) Sahai, R., Morris, M. R., & Villar, G. G. 2011, AJ, 141, 134
- Sault & Killeen (2010) Sault, B., Killeen, N., 2010, MIRIAD user guide
- Sevenster. (2002) Sevenster, M. N. 2002, AJ, 123, 2772
- Sevenster et al. (1997a) Sevenster, M. N., Chapman, J. M., Habing, H. J., Killeen, N. E. B., & Lindqvist, M. 1997, A&A, 122, 79
- Sevenster et al. (1997b) Sevenster, M. N., Chapman, J. M., Habing, H. J., Killeen, N. E. B., & Lindqvist, M. 1997, A&A, 124, 509
- Sevenster & Chapman (2001) Sevenster, M. N., & Chapman, J. M. 2001, ApJ, 546, L119
- Surcis et al. (2011) Surcis, G., Vlemmings, W. H. T., Curiel, S., Hutawarakorn Kramer, B., Torrelles, J. M., & Sarma, A. P. 2011, A&A, 527, A48
- van Winckel (2003) van Winckel, H. 2003, Ann. Rev. A&A, 41, 391
- Vlemmings et al. (2002) Vlemmings, W. H. T., Diamond, P. J., & van Langevelde, H. J. 2002, A&A, 394, 589
- Vlemmings et al. (2006) Vlemmings, W. H. T., Diamond, P. J., & Imai, H. 2006, Nature, 440, 58
- Vlemmings et al. (2006) Vlemmings, W. H. T., Diamond, P. J., van Langevelde, H. J., & Torrelles, J. M. 2006, A&A, 448, 597
- Walsh et al. (2009) Walsh, A. J., Breen, S. L., Bains, I., & Vlemmings, W. H. T. 2009, MNRAS, 394, L70