On the Radial Stellar Content of Early-Type Galaxies as a Function of Mass and Environment
Abstract
Using optical–optical and optical–NIR colors, we analyze the radial dependence of age and metallicity inside massive (), low-redshift (), early-type galaxies (ETGs), residing in both high-density group regions and the field. On average, internal color gradients of ETGs are mainly driven by metallicity, consistent with previous studies. However, we find that group galaxies feature positive age gradients, , i.e. a younger stellar population in the galaxy center, and steeper metallicity gradients, compared to the field sample, whose ranges from negative in lower mass galaxies, to positive gradients at higher mass. These dependencies yield new constraints to models of galaxy formation and evolution. We speculate that age and metallicity gradients of group ETGs result from (either gas-rich or minor-dry) mergers and/or cold-gas accretion, while field ETGs exhibit the characteristic flatter gradients expected from younger, more metal-rich, stars formed inside–out by later gas-cooling.
Subject headings:
galaxies: clusters: general—galaxies: evolution—galaxies: fundamental parameters1. Introduction
Being hot dynamical systems, ETGs are often assumed to be formed from major mergers, where the progenitors can be either gas-rich disks or ETGs. The predominantly old stellar populations found in these galaxies indicate a rapid and intense star formation history, although the detection of compact, massive ETGs at high redshift (Daddi et al., 2005) implies a change in size of a factor 3–5 between z2 and z=0 (see e.g. Trujillo et al., 2007).
Recent studies of the size evolution of massive ETGs over the past 8 Gyr propose a number of alternative scenarios, such as minor mergers (Naab et al. 2009; Trujillo et al. 2011) or a puffing-up of the central regions caused by the baryonic mass loss (Damjanov et al., 2009; Fan et al., 2010). Alternatively, cold accretion – perhaps reminiscent of the monolithic collapse scenario (Larson, 1975) – may provide an independent channel for the formation of massive galaxies, accounting for the highly efficient star formation measured in these systems at high redshift (Dekel et al., 2009). In addition, the environment can contribute as well to the star formation history. As a galaxy enters a group, its hot gas reservoir can be removed, shutting off star formation (“strangulation”). All these processes may be discerned if spatial information within galaxies is taken into account. The majority of studies on the star formation history of ETGs use observations integrated within an aperture, losing the discriminating power. Radial gradients of photo-spectroscopic data represent a fundamental observable to disentangle the different formation channels described above. Studies of local samples of ETGs show that the majority feature red cores (see e.g. Peletier et al., 1990). Blue cores are less frequent, being mostly low-mass () ETGs (Suh et al., 2010). Radial gradients of spectral line strengths reveal a significant trend in metallicity (see e.g. Forbes, Sánchez-Blázquez, & Proctor, 2005; Ogando et al., 2005; Spolaor et al., 2009; Koleva et al., 2011) and an intriguing dependence of the age gradients on environment (Sánchez-Blázquez, Gorgas, & Cardiel, 2006). Extending the analysis to moderate redshift takes advantage of the lookback time, as younger populations are less affected by the age-metallicity degeneracy. The analysis of the color gradients of the GOODS sample of ETGs over a wide redshift range (0.4z1) confirmed a clear metallicity radial gradient for the red cored galaxies, and a significantly younger population at the centers of the blue-cored galaxies (Ferreras et al., 2009), with an increase in the fraction of blue- vs. red-cored profiles towards lower stellar masses.
Galaxy mass and environment are the two main drivers of the formation history of galaxies (see e.g. Weinmann et al., 2009) and recent work on ETGs has revealed a significant difference between the two, with environment only playing a secondary role on the stellar populations (Rogers et al., 2010) although with more significant effects on dynamical relationships such as the Fundamental Plane (La Barbera et al., 2010a, hereafter LLD10) . In this letter, we extend the analysis by inferring age and metallicity radial gradients of low-redshift ETGs from a multi-wavelength dataset in the optical and NIR. Our findings reveal a significant contribution of the environment to the formation and assembly mechanisms of ETGs.
2. SAMPLE
The SPIDER survey consists of a volume-limited sample of bright ETGs () in the redshift range , with photometry from SDSS-DR6. of these galaxies also have imaging from UKIDSS-Large Area Survey ( see LLD10, and references therein, for details on data analysis and sample selection). ETGs are defined as galaxies with a prominent bulge111accounting for of total light,, and a passive spectrum in their central regions (within the SDSS fiber). Galaxies have structural parameters, i.e. effective radius, , mean surface brightness within that radius, , and Sersic index, , homogeneously measured from through with the software 2DPHOT, by fitting galaxy images with seeing-convolved 2D Sersic models. The environment of ETGs is characterized by an FoF catalogue of groups. A shifting gapper technique is applied to this catalogue (see Lopes et al. 2009a) allowing galaxies to be classified as either group members (), non-group members (hereafter “field” galaxies; ), or unclassified (; see LLD10). Each group galaxy has 2D local density, , estimated by its distance to the n-th nearest group member, where scales as the square root of group richness.
We select only galaxies with better quality structural parameters from through ( of the sample; see La Barbera et al. 2010b, hereafter LDD10), and stellar mass , which gives an -complete sample of ETGs222The limit is established with the same approach as in fig. 3 of LDD10.. These selections result into a sample of 9,285 (936) field galaxies with optical (optical+NIR) data available. For group galaxies, we select only ETGs residing in the highest density regions, () for the optical (optical+NIR) sample. These thresholds are chosen to emphasize the environmental dependence of galaxy color gradients, without overly reducing the number of group galaxies333Since optical–NIR color gradients do not depend significantly on (Sec. 3), using the same threshold for both optical and optical+NIR samples would not change our results. However, adopting a lower threshold for the optical+NIR sample allows us to effectively reduce error bars., which consist of (optical) and (optical+NIR) ETGs. Most of the parent systems where these ETGs reside are relatively poor groups, with an average velocity dispersion of . Both field and group ETGs are split among three -bins: “low” (), “intermediate” (), and “high” (), being the number of group ETGs the same in each bin.
3. Internal colors vs. galaxy mass and environment
The internal color gradient of an ETG, defined as the slope of its radial color profile, written as , where , is estimated as described in LDD10, using deconvolved Sersic models of each galaxy to measure colors on concentric ellipses with axis ratio and position angle fixed to the r-band Sersic fit. A line is fitted to the resulting vs. profile, in the radial range of to (as in, e.g., Peletier et al. 1990), where is the equivalent galactocentric distance and is the r-band effective radius. The line slope gives .
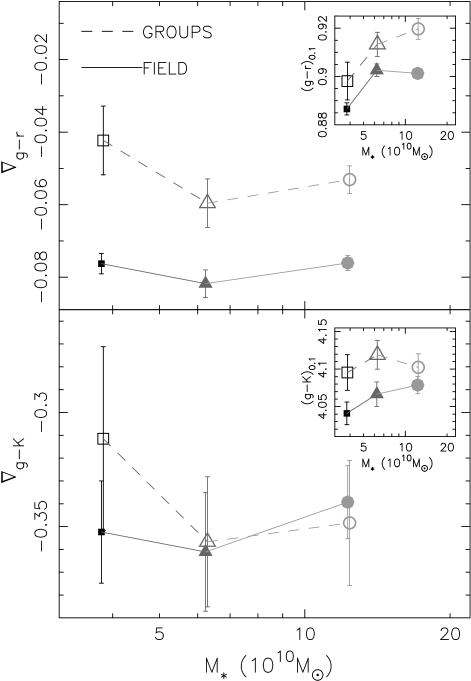
Fig. 1 shows the dependence of median optical–optical and optical–NIR color gradients, and 444The other available colors (, , , , and ) are not shown for brevity, but are included in the stellar population analysis of Sec. 4., as well as central colors, and (computed at ), on galaxy mass and environment (i.e. field vs. group). To a first approximation, optical–optical colors are more sensitive to the age of a stellar population than its metallicity, while optical–NIR colors are more sensitive to metallicity than age (see e.g. de Jong, 1996). Hence, the upper and lower panels of Fig. 1 can be roughly seen as reflecting the behavior of age and metallicity, respectively. At a given stellar mass, group galaxies have significantly shallower optical–optical color gradients than their field counterparts555 We note that this trend cannot be caused by an increase of the E vs. S0 fraction in the group environment, as lenticulars have shallower color gradients (e.g. Roediger et al. 2011)., consistent with La Barbera et al. (2005), who found cluster galaxies to have systematically flatter (by at ) with respect to galaxies in less dense environments. However, optical–NIR color gradients do not exhibit any significant environmental dependence, implying that age (rather than metallicity) gradients are changing with the environment. The small panels in Fig. 1 also show that, at all masses, group galaxies have redder central colors than those in the field. On average, the color difference amounts to mag in , and mag in . This may result from both age and metallicity increasing with mass, and group (relative to field) ETGs having older stellar populations, as found by, e.g., Thomas et al. (2005); Gallazzi et al. (2006); Pasquali et al. (2010).
4. Age and metallicity gradients vs. galaxy mass and environment
We assume that the dependence of internal colors of ETGs on mass and environment is mainly driven by the age and metallicity of the underlying stellar populations, which is motivated by the existence of well-established absorption-line gradients in ETGs (see, e.g., Sánchez-Blázquez et al. 2007; Rawle, Smith, & Lucey 2010). Although a dust component may also generate color gradients (Silva & Wise, 1996), no observational evidence has been found so far that dust can play a major role (Savoy, Welch, Fich 2009; LDD10).
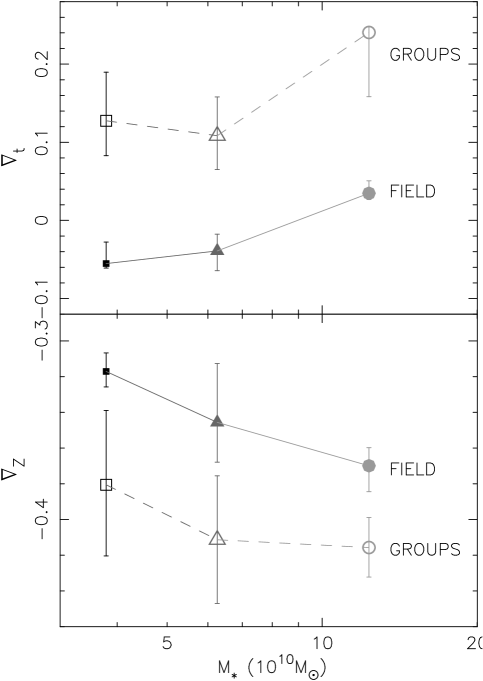
We fit simultaneously all available central colors and color gradients (as shown in Fig. 1) with stellar population (SP) models, inferring galaxy central age and metallicity666 Central age and metallicity are not discussed here, as their estimates are less robust than that of SP gradients, involving an absolute, rather than a relative, matching of model to observed colors., as well as age and metallicity gradients 777i.e. The variation of logarithmic age and metallicity per decade in galactocentric distance., and (as in, e.g., Tortora et al. 2010). Each SP model consists of a pair of Simple Stellar Populations (SSPs) with Chabrier (2003) IMF, from the Charlot & Bruzual (2011, in preparation; CB11) synthesis code. The “inner” SSP is used to model central galaxy colors, while the difference of between the two SSPs is fitted to , providing and . The fitting is done in a sense by varying age and metallicity of both SSPs in the range Gyr and , respectively. We found that similar results are obtained when using Bruzual & Charlot (2003) population synthesis models, or using exponentially declining star-formation models. As shown in Fig. 2, the age and metallicity content of ETGs depends significantly on both galaxy mass and environment, reflecting the behavior of optical–optical and optical–NIR colors of Fig. 1. For all environments and mass bins, the main driver of color gradients in ETGs is a significantly negative () metallicity gradient (consistent with e.g. Peletier et al. 1990; Ferreras et al. 2009), with field galaxies having somewhat shallower (by ) than their group counterparts. However, age is found to play a significant role, and, perhaps more importantly, this depends on the environment where galaxies reside. Group galaxies have positive, albeit small , age gradients (, i.e. an age variation of per radial decade), with the galaxy stellar populations being younger in the center than in the outskirts, while field ETGs exhibit systematically smaller, mostly negative, age gradients, consistent with Ferreras et al. (2009) based on the analysis of the evolution of the color gradients of field ETGs from GOODS data. Notice, however, that at high-mass field galaxies also tend to have slightly positive ().
5. Discussion
The analysis presented in this Letter suggests that there is a significant trend of the internal distribution of age and metallicity in massive ETGs with galaxy mass and environment. The results of Fig. 2 can be qualitatively discussed in the light of current formation scenarios of ETGs, considering that most () of our sample of group galaxies consists of satellite, rather than central, galaxies (according to the definition of Yang et al. 2007):
- Gas-rich mergers. The presence of a younger stellar population (i.e. a positive age gradient) in the center of group ETGs supports a dissipative formation picture, whereby gas-rich mergers fuel the central region with cold gas, allowing for the formation of younger, metal-enriched, stars. In a hierarchical picture of galaxy formation, the more massive ETGs start forming stars at earlier epochs (albeit assembling later, see De Lucia et al. 2006), when disk-like progenitors likely had a more turbulent and clumpy ISM (Förster Schreiber et al., 2009), possibly implying a larger amount of dissipation. This might explain why age (metallicity) gradients tend to marginally increase (decrease) with stellar mass. However, this is not supported by SPH simulations of galaxy formation, with merging producing no correlation of metallicity gradients and mass (Kobayashi, 2004). Moreover, both the light profile shape as well as the size–mass relation of ETGs at provide evidence against an increasing importance of gas dissipation at high mass (Hopkins et al., 2009; Shankar et al., 2011).
- Cold accretion. An alternative scenario to explain positive age gradients involves the accretion of cold (clumpy) gas from the cosmological surroundings, leading to subsequent star formation in the central region. Cold accretion is expected to be more important at high redshift (), being a relevant mode for the formation of galaxies as massive as (Dekel et al. 2009, but see also Keres et al. 2005). In a cold accretion scenario, where the formation process resembles monolithic collapse, the and would naturally correlate with galaxy mass as star formation lasts longer in the center of more massive systems having a deeper central potential well (e.g. Kobayashi 2004; Pipino et al. 2010). This interpretation is also supported by the fact that: (1) the ages and metallicities of the stellar populations within and among ETGs are tightly correlated to the local escape velocity (Scott et al., 2009); and (2) the resulting gradients depend on mass (e.g. Forbes, Sánchez-Blázquez, & Proctor 2005) and, at fixed mass, on the duration of star-formation, a property that can be parametrized by the to iron abundance ratio ( LDD10). One should notice, however, that the existence of a correlation between and mass has been longly debated in the literature (see, e.g., Spolaor et al. 2009; Koleva et al. 2011, and references therein).
- Later gas accretion. While group galaxies have their star formation quenched when entering bigger halos (through “strangulation”), field galaxies can accrete gas longer, by radiative cooling of their dark-matter hot-gas reservoir, and form a younger, more metal-rich, stellar component outwards. This would lower, and eventually invert, the age gradient, making also metallicity gradients shallower, consistent with what we see for field ETGs in Fig. 2.
- Stripping. Environmental effects, such as ram pressure and/or tidal stripping, may also trigger (central) star formation in recently accreted group satellites (e.g. Bekki & Couch 2003). In general, stripping should be less important for high-mass galaxies, inconsistent with the trends seen in Fig. 2.
- Dry merging. ETGs can also form by gas-poor interactions. Minor dry mergers and stellar accretion can drive the formation of the outer envelopes of ETGs, explaining their size evolution with redshift (Naab et al., 2009). Gas-poor mergers should mix the stellar populations within galaxies, flattening pre-existing metallicity and age gradients (White, 1980). Since and steepen with mass (see also LDD10), our data seem to reject major dry-mergers as the main channel for the formation of ETGs, unless the amount of flattening is small (Hopkins et al., 2009). Minor dry-mergers would lead to a deposit of metal-poor, old, stellar material in the outer regions of a galaxy, increasing (decreasing) the age (metallicity) gradients. Therefore, the trends of and in Fig. 2 might also result from minor dry-mergers to be more important at high-mass (consistent with model predictions; see Hopkins et al. 2010; De Lucia et al. 2011) and preferentially in group, relative to field, environments. However, such a trend would be at odds with the finding of a lack of environmental dependence of the redshift evolution of ETGs on the mass-size plane (Rettura et al., 2010).
In summary, although we find that several mechanisms can contribute to the observed age and metallicity gradients in ETGs (among them, cold accretion and minor dry mergers are the most likely ones), we do indeed detect physical differences in the formation mechanisms with respect to environment, with field (relative to group) galaxies having the characteristic flatter gradients expected from inside–out star formation induced by late gas-cooling. Studies of radial gradients outside of the effective radius will shed more light into the mechanisms that drive the formation of early-type galaxies.
References
- Bekki & Couch (2003) Bekki, K., Couch, W.J. 2003, ApJ, 596, 13
- Bruzual & Charlot (2003) Bruzual, G., & Charlot, S. 2003, MNRAS 344, 1000 (BC03)
- Chabrier (2003) Chabrier, G. 2003, PASP, 115, 763
- Daddi et al. (2005) Daddi, E., et al. 2005, ApJ, 626, 680
- Damjanov et al. (2009) Damjanov, I., et al. 2009, ApJ, 695, 101
- de Jong (1996) de Jong, R.S. 1996, A&A, 313, 377
- Dekel et al. (2009) Dekel, A., et al. 2009, Nature, 457, 451
- De Lucia et al. (2006) De Lucia, G., Springel, V., White, S.D.M., Croton, D., Kauffmann, G. 2006, MNRAS, 366, 499
- De Lucia et al. (2011) De Lucia, G., Fontanot, F., Wilman, D., Monaco, P. 2011, MNRAS, 414, 1439
- Fan et al. (2010) Fan, L., Lapi, A., Bressan, A., Bernardi, M., De Zotti, G., Danese, L. 2010, ApJ, 718, 1460
- Ferreras et al. (2009) Ferreras, I., Lisker, T., Pasquali, A., Kaviraj, S. 2009, MNRAS, 395, 554
- Forbes, Sánchez-Blázquez, & Proctor (2005) Forbes, D. A., Sánchez-Blázquez, P., Proctor, R. 2005, MNRAS, 361, L6
- Förster Schreiber et al. (2009) Förster Schreiber, N.M., et al. 2009, ApJ, 706, 1364
- Gallazzi et al. (2006) Gallazzi, A., Charlot, S., Brinchmann, J., White, S.D.M. 2006, MNRAS, 370, 1106
- Hopkins et al. (2009) Hopkins, P.F., Lauer, T.R., Cox, T.J., Hernquist, L., Kormendy, J. 2009, ApJS, 181, 486
- Hopkins et al. (2010) Hopkins, P.F., et al. 2010, ApJ, 715, 202
- Keres et al. (2005) Keres, D., Katz, N., Weinberg, D.H., Davé, R. 2005, MNRAS, 363, 2
- Kobayashi (2004) Kobayashi, C. 2004, MNRAS, 347, 740
- Koleva et al. (2011) Koleva, M., Prugniel, P., De Rijcke, S., Zeilinger, W. W. 2011, MNRAS, in press, arXiv:1105.4809
- La Barbera et al. (2005) La Barbera, F., de Carvalho, R.R., Gal, R.R., Busarello, G., Merluzzi, P., Capaccioli, M., Djorgovski, S.G. 2005, ApJ, 626, 19
- La Barbera et al. (2010a) La Barbera, F., Lopes, P.A.A., de Carvalho, R.R., de la Rosa, I.G., Berlind, A.A. 2010, MNRAS, 408, 1361 (LLD10)
- La Barbera et al. (2010b) La Barbera, F., de Carvalho, R.R., de la Rosa, I.G., Gal, R.R., Swindle, R., Lopes, P.A.A. 2010b, AJ, 140, 1528 (LDD10)
- Larson (1975) Larson, R. B. 1975, MNRAS, 173, 671
- Lawrence et al. (2007) Lawrence, A., et al. 2007, MNRAS, 379, 1599
- Lopes et al. (2009a) Lopes, P.A.A., de Carvalho, R.R., Kohl-Moreira, J.L., Jones, C. 2009, MNRAS, 392, 135
- Naab et al. (2009) Naab, T., Johansson, P. H., Ostriker, J. P. 2009, ApJ, 699, L178
- Ogando et al. (2005) Ogando, R. L. C., Maia, M. A. G., Chiappini, C., Pellegrini, P. S., Schiavon, R. P., da Costa, L. N. 2005, ApJ, 632, L61
- Pasquali et al. (2010) Pasquali, A., et al. 2010, MNRAS, 407, 937
- Peletier et al. (1990) Peletier, R.F., Davies, R.L., Illingworth, G.D.; Davis, L.E., Cawson, M. 1990, AJ, 100, 1091
- Peletier et al. (1990) Peletier, R.F. et al. 1990, A&A, 233, 62
- Pipino et al. (2010) Pipino A., D’Ercole A., Chiappini C., Matteucci, F. 2010, MNRAS, 407, 1347
- Rawle, Smith, & Lucey (2010) Rawle, T.D., Smith, R.J., & Lucey, J.R. 2010, MNRAS, 401, 852
- Rettura et al. (2010) Rettura, A., et al. 2010, ApJ, 709, 512
- Roediger et al. (2011) Roediger, J.C., Courteau, S., MacArthur, L.A., McDonald, M. 2011, MNRAS, submitted (2010arXiv1011.3511R)
- Rogers et al. (2010) Rogers, B., Ferreras, I., Pasquali, A., Lahav, O., Kaviraj, S. 2010, MNRAS, 405, 329
- Sánchez-Blázquez, Gorgas, & Cardiel (2006) Sánchez-Blázquez, P., Gorgas, J., & Cardiel, N., 2006, A& A, 457, 823
- Sánchez-Blázquez et al. (2007) Sánchez-Blázquez, P., Forbes, D.A., Strader, J., Brodie, J., Proctor, R. 2007, MNRAS, 377, 759S
- Savoy, Welch, Fich (2009) Savoy, J., Welch, G.A., Fich, M. 2009, ApJ, 706, 21S
- Scott et al. (2009) Scott, N., et al. 2009, MNRAS, 398, 1835
- Shankar et al. (2011) Shankar, F., Marulli, F., Bernardi, M., Mei, S., Meert, A., Vikram, V. 2011, MNRAS, submitted ()
- Silva & Wise (1996) Silva, D.R., & Wise, M.W. 1996, ApJ, 457, 15
- Spolaor et al. (2009) Spolaor, M., Proctor, R. N., Forbes, D. A., Couch, W. J. 2009, ApJ, 691, L138
- Suh et al. (2010) Suh, H., Jeong, H., Oh, K., Yi, S. K, Ferreras, I., Schawinski, K. 2010, ApJS, 187, 374
- Thomas et al. (2005) Thomas, D., Maraston, C., Bender, R., Mendes de Oliveira, C. 2005, ApJ, 621, 673
- Tortora et al. (2010) Tortora, C., Napolitano, N.R., Cardone, V.F., Capaccioli, M., Jetzer, Ph., Molinaro, R. 2010, MNRAS, 407, 144
- Trujillo et al. (2007) Trujillo, I., Conselice, C. J., Bundy, K., Cooper, M. C., Eisenhardt, P., Ellis, R. S. 2007, MNRAS, 382, 109
- Trujillo et al. (2011) Trujillo, I., Ferreras, I., de la Rosa, I. G. 2011, MNRAS, in press, arXiv:1102.3398
- Weinmann et al. (2009) Weinmann, S. M., et al. 2009, MNRAS, 394, 1213
- White (1980) White, S.D.M. 1980, MNRAS, 191, 1
- Yang et al. (2007) Yang, X., Mo, H.J., van den Bosch, F.C., Pasquali, A., Li, C., Barden, M. 2007, ApJ, 671, 153