11email: tracey.hill@cea.fr 22institutetext: Université de Bordeaux, OASU, Bordeaux, France 33institutetext: Laboratoire d’Astrophysique de Marseille UMR6110, CNRS, Université de Provence, 38 rue F. Joliot-Curie, 13388 Marseille, France 44institutetext: Université de Toulouse, UPS, CESR, 9 avenue du colonel Roche, 31028 Toulouse Cedex 4, France ; CNRS, UMR5187, 31028 Toulouse 55institutetext: National Research Council of Canada, Herzberg Institute of Astrophysics, University of Victoria, Department of Physics and Astronomy, Victoria, Canada 66institutetext: INAF-Istituto Fisica Spazio Interplanetario, via Fosso del Cavaliere 100, 00133 Roma, Italy 77institutetext: INAF- Osservatorio Astronomico di Roma, via di Frascati 33, 00040 Monte Porzio Catone, Italy. 88institutetext: School of Physics and Astronomy, Cardiff University, Queens Buildings, The Parade, Cardiff, CF243AA, UK 99institutetext: Herschel Science Centre, ESAC, Spain 1010institutetext: Canadian Institute for Theoretical Astrophysics, University of Toronto, Toronto, ON, M5S 3H8, Canada 1111institutetext: Institut d’Astrophysique de Paris, and Université Pierre et Marie Curie (UPMC), UMR 7095 CNRS, 98 bis boulevard Arago, 75014 1212institutetext: ESO, Karl Schwarzschild str. 2, 85748 Garching bei Munchen, Germany 1313institutetext: The Rutherford Appleton Laboratory, Chilton, Didcot, OX11 0NL, UK 1414institutetext: Department of Physics and Astronomy, The Open University, Milton Keynes, UK 1515institutetext: Department of Physics and Astronomy, McMaster University, Hamilton, ON, L8S 4M1, Canada 1515email: ††thanks:
Filaments and ridges in Vela C revealed by Herschel††thanks: Herschel is an ESA space observatory with science instruments provided by European-led Principal Investigator consortia and with important participation from NASA.: from low-mass to high-mass star-forming sites††thanks: Fig. 8 is only available in electronic form at http://www.aanda.org.
We present the first Herschel PACS and SPIRE results of the Vela C molecular complex in the far-infrared and submillimetre regimes at 70, 160, 250, 350, and 500 m, spanning the peak of emission of cold prestellar or protostellar cores. Column density and multi-resolution analysis (MRA) differentiates the Vela C complex into five distinct sub-regions. Each sub-region displays differences in their column density and temperature probability distribution functions (PDFs), in particular, the PDFs of the ‘Centre-Ridge’ and ‘South-Nest’ sub-regions appear in stark contrast to each other. The Centre-Ridge displays a bimodal temperature PDF representative of hot gas surrounding the HII region RCW 36 and the cold neighbouring filaments, whilst the South-Nest is dominated by cold filamentary structure. The column density PDF of the Centre-Ridge is flatter than the South-Nest, with a high column density tail, consistent with formation through large-scale flows, and regulation by self-gravity. At small to intermediate scales MRA indicates the Centre-Ridge to be twice as concentrated as the South-Nest, whilst on larger scales, a greater portion of the gas in the South-Nest is dominated by turbulence than in the Centre-Ridge. In Vela C, high-mass stars appear to be preferentially forming in ridges, i.e., dominant high column density filaments.
Key Words.:
ISM: individual objects (Vela C) – Stars: early-type – Stars: protostars – ISM: filaments – ISM: structure – ISM: dust, extinction1 Introduction
Though relatively rare, high-mass ( 8M⊙) stars play a major role in the energy budget of the interstellar medium where they contribute to shape the composition and evolution of their natal neighbourhood, as well as their host galaxy. The earliest stages of high-mass star formation remain a process that is not well understood, due to a lack of suitable high-mass star progenitors. Recent work has focused on finding candidate early stage protostars indicative of the earliest stages of high-mass star formation (e.g. Beuther et al. 2002; Hill et al. 2005; Motte et al. 2007; Rathborne et al. 2007).
The Herschel imaging survey of OB young stellar objects (HOBYS) capitalises on the unprecedented mapping capabilities of the Herschel space observatory (Griffin et al. 2010) to compile the first complete, systematic and unbiased sample of nearby ( 3 kpc) high-mass star progenitors (Motte et al. 2010; Schneider et al. 2010b; Hennemann et al. 2010; di Francesco et al. 2010). The HOBYS programme targets ten molecular complexes forming OB-type stars, one of which is Vela C, at five wavebands from 70 to 500 m. Herschel has already proven useful in tracing both high- and low-mass star formation at all evolutionary stages including prestellar cores, protostars, and filaments, as well as more evolved objects like HII regions (e.g. Motte et al. 2010; André et al. 2010; Molinari et al. 2010; Zavagno et al. 2010).
The Vela molecular region, often called the ‘Vela Molecular Ridge’ in the literature (Murphy & May 1991), is a nearby giant molecular cloud complex within the Galactic plane that is comprised of four components labelled A through D. The entire complex was observed in low resolution (0.5∘) J = 1-0 CO by May et al. (1988), who found intense emission at relatively low radial velocities. They estimated a total molecular mass in the Vela region exceeding 5 105 M⊙, which was later confirmed by Yamaguchi et al. (1999) with low resolution (8 arcmin) J = 1-0 12CO, 13CO, and C18O. From IRAS point sources and protostellar energy distributions, Liseau et al. (1992) suggested that tens of young massive stars exist toward the Vela region. The Balloon-borne Large Aperture Submillimetre Telescope (BLAST; Netterfield et al. 2009), observing at three submillimetre wavelengths (250, 350, 500 m) with resolutions between 36″ and 60″, confirmed that there are a large number of high-mass star formation sites in the Vela molecular complex, including Vela C.
The Vela C giant molecular cloud complex, the most massive component of the Vela region, is an ideal laboratory in which to study star formation. At a distance of 700 pc, Vela C is a nearby star-forming complex at an early stage of star formation ( 106 years), containing molecular outflows and many star-forming regions detected in the far-infrared (IRAS; Wouterloot & Brand 1989; Yamaguchi et al. 1999). Vela C is particularly unusual owing to its proximity and the fact that it houses high, intermediate and low mass star formation (e.g. Massi et al. 2003) and so may provide clues as to what causes the different modes of star formation.
2 Observations, data reduction, source extraction
Vela C was observed on 2010, May 18, as part of the HOBYS guaranteed time key programme. The parallel-scan mode of Herschel was used, allowing simultaneous observations with the PACS (70 and 160 m; Poglitsch et al. 2010) and SPIRE (250, 350, 500 m; Griffin et al. 2010) instruments at five bands, using the slow scan-speed (20″/s). A total area of 3 deg2 was mapped using two orthogonal scan directions. The PACS and SPIRE data were reduced with version 5.0.1975 of the Herschel Interactive Processing Environment (HIPE111http://herschel.esac.esa.int/HIPE_download.shtml; Ott 2010) adopting standard steps of the default pipeline to level-1 including calibration and deglitching. The pipeline was modified, for both PACS and SPIRE, to include data taken during the turn-around of the telescope, allowing better baseline subtraction. Calibration of the PACS data has been found to be within 10% and 20% at 70 and 160 m, respectively (see the PACS observers’ manual), whilst SPIRE calibration is within 10% for all bands (see the SPIRE observers’ manual). Maps were produced using the HIPE level-1 data and v7 of the Scanamorphos software package222http://www2.iap.fr/users/roussel/herschel/index.html which performs baseline and drift removal before regriding (Roussel et al., 2011, submitted). Individual images at each waveband are shown in Fig. 8. Sources were identified using the multi-wavelength multi-resolution getsources extraction routine (Men’shchikov et al. 2010) which is consistent with the MRE-GCL algorithm (Motte et al. 2003) used for the HOBYS programme during the Herschel science demonstration phase (e.g. Motte et al. 2010).
3 Structure analysis
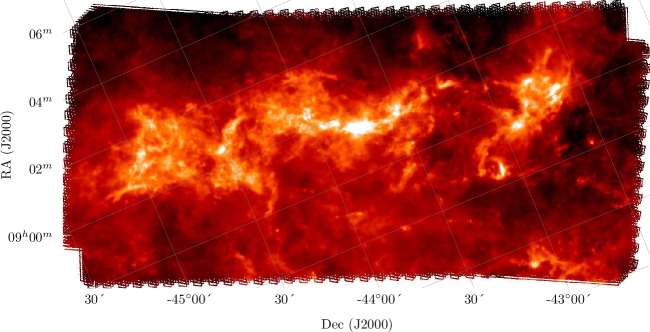
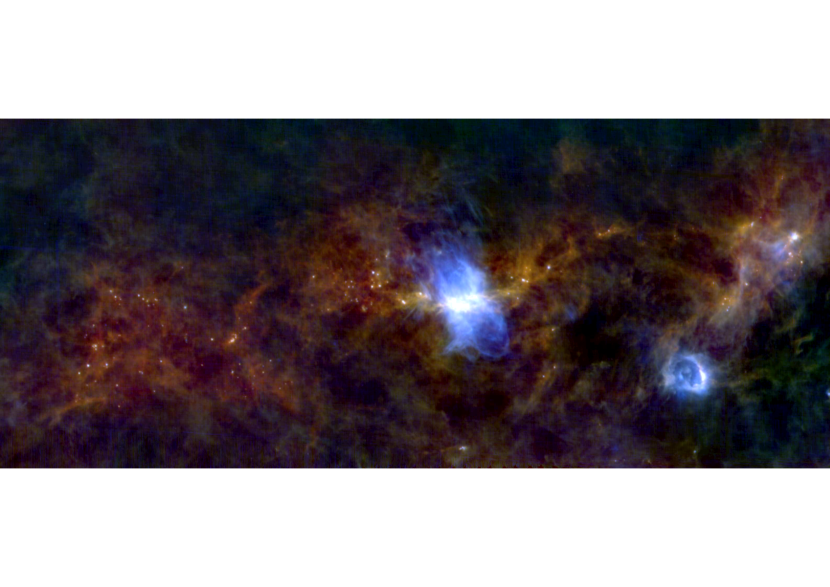
The Herschel maps of Vela C (Figs 1, 8), show cold filamentary structures throughout the entire complex, as well as bright emission at the shorter wavelengths, associated with the RCW 36 cluster at the centre and RCW 34 in the north. RCW 36 is powered by at least one O8 or two O9 stars (Baba et al. 2004).
3.1 Column density & temperature maps
The dust temperature and column density maps (Figs 2 and 3) of Vela C were drawn by fitting pixel-by-pixel spectral energy distributions (SEDs; as described by Hill et al. 2009, 2010) to the four longer Herschel wavebands (at the same 37″ resolution), assuming the dust opacity law of Hildebrand (1983) and a spectral index of 2. Only the four longer wavelength Herschel bands were used for SED fitting, as the 70 m data may not be entirely tracing the cold dust which we are interested in.
The zero offsets were determined following the procedure described in detail by Bernard et al. (2010), and applied to the Herschel maps prior to fitting. This method uses the IRIS (improved reprocessing of the IRAS survey) data (Miville-Deschênes et al. 2005), which is at comparable resolution to that of Planck, as well as the Planck HFI DR2 data (Planck Collaboration a., 2011) to predict the expected brightness in the Herschel PACS and SPIRE bands. The derived offsets are obtained from the correlation between the Planck/IRAS expectation and the actual Herschel data smoothed to the common resolution of the IRAS and Planck high frequency data. This application to Herschel data has been used by Bernard et al. (2010); Juvela et al. (2011). An alternate method was used by Könyves et al. (2010) and Schneider et al. (2010b) who used extinction maps to determine absolute calibration of their Herschel Aquila and Rosette column density maps. Without the proper absolute calibration, the dust temperature map can be overestimated by 10 to 15%. The observed rms of cirrus noise determined directly from the column density map is 3.5 1021 cm-2, consistent with that found for Aquila (André et al. 2010). A lack of emission at IRAS 100 m, meant that the zero offsets could not be determined for the 70 m band, confirming our earlier decision to exclude it from the dust temperature and column density maps.
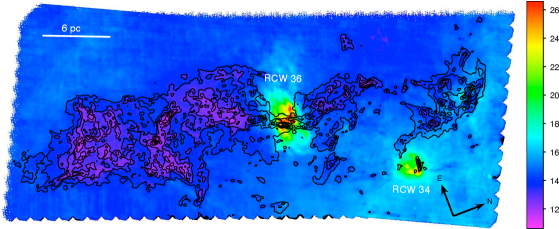
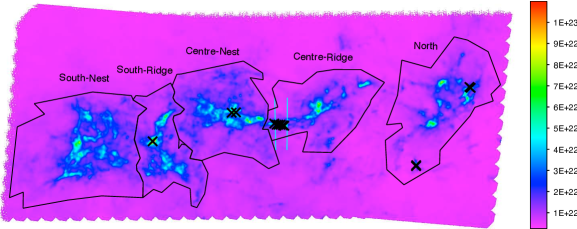
These column density and temperature maps indicate that the southern part of Vela C is dominated by cold, dense material, in contrast to the centre of the map where a cold dense filament (15–18 K), as well as warmer and less dense material coexist.
Recent Herschel results of the Gould Belt survey key programme have revealed the presence of star-forming filamentary structures above an 7 mag (André et al. 2011, 2010), which these authors interpret as being ‘supercritical’ (i.e., gravitationally unstable) filaments forming prestellar cores in their interiors by gravitational instability. At an magnitude333Here we define N = 1 1021 cm-2 mag-1 (Bohlin et al. 1978). of 7, the Vela C complex segregates into five distinct sub-regions: North, Centre-Ridge, Centre-Nest, South-Ridge, South-Nest. (see Fig. 3). The cloud structures which have 2 pc characteristic size-scales supports this segregation of Vela C into five distinct sub-regions as shown by a multi-resolution analysis of the column density map (see Fig. 7 and section 3.2). These sub-regions contain 1.9 – 4.2 106 M⊙ (see Table 1).
The segregation of Vela C into five sub-regions is also seen in molecular line data, such as the CO and C18O observations of Yamaguchi et al. (1999). In their Figure 4a, Vela C clearly segregates into the North, South-Nest and South-Ridge sub-regions. The distinction between Centre-Ridge and Centre-Nest is not as clear but exists, even at the 8′ resolution of these observations. There is a small velocity gradient throughout the Vela C molecular cloud (see, Yamaguchi et al. 1999, for more detail).
3.2 Filaments and mass concentration
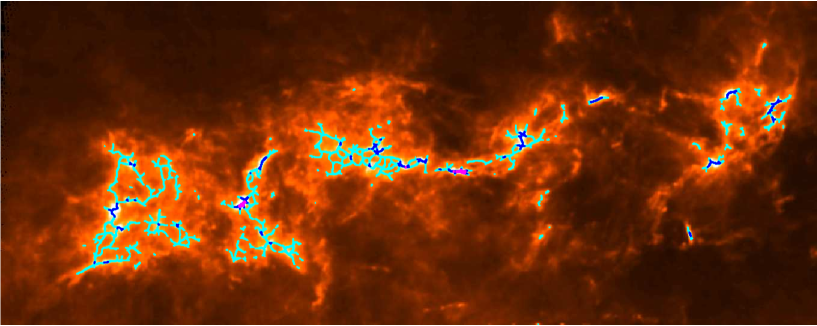
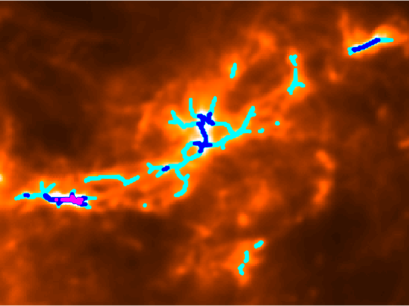
To take a census of the filaments evident in the column density map and trace their crest444The crest is the maximum intensity profile along the filament., the discrete persistent structure extractor (DisPerSE) was applied to the map. DisPerSE works on the principles of computational topology, namely the Morse theory, and the concept of persistence, to identify topological structure such as filaments, and connect their saddle-points to maxima with integral lines (Sousbie 2011; Sousbie et al. 2011).
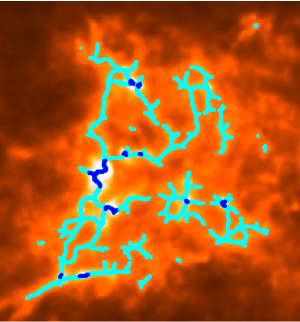
Figure 4 shows the crests identified from DisPerSE. Here, ‘nest’ depicts a disorganised network of filaments in contrast to a single dominating filament which we name ‘ridge’, see Section 5. Since the Centre-Ridge appears to be more efficient in forming high-mass stars than the South-Nest (see Section 4) we utilise analytical tools in the following sections to help quantify this structural difference. Table 1 gives the parameters of the filaments and their crest in each of the five sub-regions of Vela C. This table shows that at low ( = 7 – 25 mag), the filamentary networks are similar in terms of coverage (ratio of the number of crest points to the total number of points, column 3) in all sub-regions. The filamentary networks only differentiate at high because only the Centre-Ridge and the South-Ridge have formed high- structures. This can not be only a statistical result since the South-Nest, Centre-Nest and North sub-regions have slightly more pixels and more mass than the Centre-Ridge and South-Ridge (see Table 1). Above 50 mag all filaments identified have supercritical masses per unit length and are thus likely gravitationally unstable (see discussion in André et al. 2010). Fig. 3 (right) shows that the Centre-Ridge has a filament whose outer radius is 1 – 1.5 pc, in marked contrast to those in the South-Nest which have radii 0.2 – 0.3 pc (see also Fig. 4).
| Region | Total | Tot nb. | Crest | Crest | Crest coverage at | Column density | |||
|---|---|---|---|---|---|---|---|---|---|
| mass | pixels | pixels | coverage | 50 mag | 100 mag | maximum | mean on crest | mean in whole region | |
| 106 M⊙ | 104 | 102 | % | 1022 cm-2 | 1022 cm-2 | 1022 cm-2 | |||
| North | 3.7 | 5.5 | 3.0 | 5.4 | 1.93 | 0 | 9.3 | 1.8 | 1.0 |
| Centre-Ridge | 3.6 | 3.8 | 2.4 | 6.3 | 2.76 | 0.53 | 17.0 | 2.1 | 1.3 |
| Centre-Nest | 3.3 | 4.7 | 3.8 | 8.2 | 1.91 | 0 | 10.0 | 2.2 | 1.6 |
| South-Ridge | 1.9 | 2.9 | 2.2 | 7.5 | 2.79 | 0.44 | 19.6 | 2.5 | 1.6 |
| South-Nest | 4.2 | 7.2 | 4.7 | 6.5 | 0.49 | 0 | 8.2 | 2.1 | 1.4 |
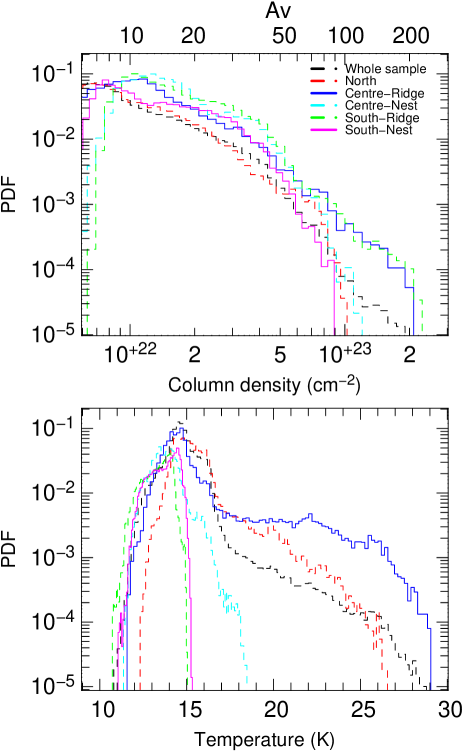
The column density and temperature probability distribution functions (PDFs) are presented in Fig. 5. Interestingly, the South-Ridge and South-Nest are the coolest sub-regions, with steep temperature PDF profiles spanning a small range (16 K). We focus here on the high-column density tails of the PDF, which are clearly flatter (see Table 1, Fig. 5) in sub-regions with high-density filaments: Centre-Ridge and South-Ridge. Note that this behaviour is similar when considering only the pixels along the filaments (i.e. from DisPerSE) and the pixels forming these high-density tails directly correspond to structures which we call ‘ridges’ (see Section 5).
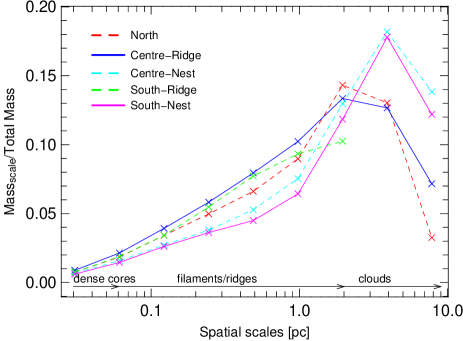
To follow the concentration of material within Vela C, a multi-resolution analysis (MRA) was performed on the column density map. MRA uses the wavelet transform to decompose a data series in a cascade from the smallest scales to the largest (mrtransform, Starck et al. 1994). A MRA decomposition on nine scales, up to 38′, (i.e., 8 pc) was made. Figure 6 shows the mass of cloud structures observed at certain scales after removing negative levels, divided by the total mass, as a function of their characteristic lengthscale. Small scales ( 0.07 pc) represent dense cores, intermediate scales ( 0.07 pc and 3 pc) filaments and ridges while large scales ( 3 pc) represent the clouds. The South-Nest and Centre-Nest regions have similar MRA profiles, as do the Centre-Ridge and South-Ridge regions from scales 1 – 6. While the mass concentration into dense cores ( 2 – 3%) may be roughly equivalent for each sub-region (see Fig. 6), the concentration in filaments/ridges is higher and spans a greater scale range in the Centre-Ridge and South-Ridge than in the South-Nest: about 2/3 up to 1 – 2 pc versus 40% up to 0.6 pc. Such a difference in mean size (average length and outer radius) is confirmed by a multi-resolution analysis of these filaments using a curvelet image built from the column density map (not shown here).
4 Low-mass vs. high-mass star formation in Vela C
The Vela C molecular complex offers a unique opportunity to study nearby high- and low-mass star formation sites at high spatial resolution with Herschel. Vela C is segregated into five distinct sub-regions according to column density, each with different characteristics and filamentary structure. Relying on several methods, such as column density and temperature PDFs, DisPerSE, and MRA we characterise these sub-regions and relate them to their ability to form high-mass stars in the near future. Though the variation of their characteristics is probably continuous, for simplicity we hereafter discuss in detail the two most contrasting regions with respect to temperature and column density - Centre-Ridge and South-Nest. We have identified high-mass ( 8 M⊙) compact sources with the highest signal to noise (S:N 50) in Vela C, see Fig. 3. These 13 objects have masses ranging from 20 – 60 M⊙ and are thus capable of forming high-mass stars. Based on their size of 0.03 – 0.2 pc, these sources correspond to starless or protostellar dense cores. Six of them are found in the Centre-Ridge region, four in the North, two in the Centre-Nest and one in the South-Ridge, while the South-Nest has none. Two of the sources in the North region are associated with the HII region RCW 34, and thus high-mass star formation. Of the remaining 11 high-mass sources identified, seven of them are found in high-density filaments, which we call ‘ridges’ (see Section 5). A census of the low- to intermediate-mass star formation in Vela C is presented in a forthcoming paper by Giannini et al., in prep.
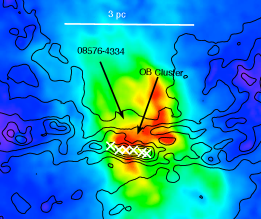
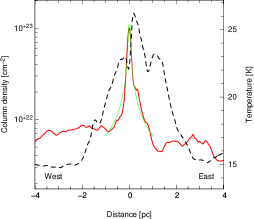
The Centre-Ridge sub-region has already formed a cluster of massive stars, which is heating the low- to medium-density ( 10 mag) molecular cloud next to it. The Centre-Ridge is also home to a radio continuum source (Walsh et al. 1998, 08576-4334), discussed in detail by Minier et al. (in prep). The temperature PDF of the Centre-Ridge (and North) displays a bimodal distribution, affirming the presence of a hot pocket of gas (RCW 36) around the OB cluster, and a cold filament which has not yet been impacted, at least in its centre, by this cluster. The warmer component arises solely from the HII regions present, as expected (Fig. 2). In the absence of this warmer component, the Centre-Ridge displays a temperature PDF profile similar to that of the other regions, though extending to slightly warmer temperatures. We measure a temperature of 15 – 18 K for the inner part of the filament, which is slightly higher than the 10 – 12 K found in other parts of Vela C. Perpendicular to this filament we measure a density profile close to that of the classical r-2 profile. Stellar winds or UV radiation from the nearby OB cluster are expected to steepen a density profile (e.g. Lefloch & Lazareff 1994; Hennebelle et al. 2003). The density profile (Fig. 3, right) of this filament does not show such strong steepening suggesting that it is not yet affected on large scales by the proximity of the OB cluster. We have thus found massive stars forming in a filamentary structure from initial temperature conditions not very different to that found in low-mass star-forming sub-regions like the South-Nest.
Each of the sub-regions of Vela C contains roughly the same mass (1.9 – 4.2 106 M⊙) and, assuming a constant star-formation efficiency, should form approximately the same number of massive stars. In contrast, the Centre-Ridge contains more massive and thus denser cores than the South-Nest that may correspond to the next generation of high-mass stars.
5 Filaments vs. ridges
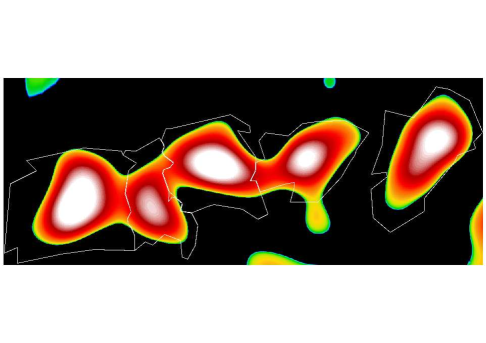
In the column density image (Fig. 3 or 4) there is clear filamentary structure throughout the entire Vela C complex, with the brightest and densest filaments forming a ridge-like structure running through the centre of the map (i.e. the Centre-Ridge). Above an 50 to 100 mag, there is little dense structure detected by DisPerSE (see Fig. 4), whilst above 100 mag only two filamentary structures are detected. We refer to these two notable filamentary structures, which reach a column density greater than 1023 cm-2, as ‘ridges’. Krumholz & McKee (2008) suggest the existence of a column density threshold for massive stars, where only clouds which have a column density 1 g/cm2 (corresponding to N 3 1023 cm-2) can avoid fragmentation and form massive stars. Whilst our results are consistent with the high-mass star formation predictions of Krumholz & McKee (2008), their models are based on a quasi-static view of cloud formation and our data do not suggest the presence of a definitive threshold between high- and low-mass star-forming sites. In Vela C the main ridge is a massive supercritical filament that differs from a filament forming low-mass stars in terms of its larger width (with a statistical distance between filaments 1 pc compared with 0.2 pc) and more complex structure (Minier et al., in prep) leading to a wider FWHM when fit with a single Gaussian (0.3 pc). Two sub-regions (Centre-Ridge and South-Ridge) contain a ridge, (see Fig. 3), which is the dominant density structure of each of these regions. In contrast, the South-Nest region of Vela C houses a network of weaker filaments. These filaments are less ordered than in the other regions of the complex, suggesting governance or formation through turbulence - see Fig. 4.
The few 100 mag 3 pc filamentary structures identified in Fig. 8 (500 m) have no equivalent in low-mass star-forming regions (e.g. Arzoumanian et al. 2011). They correspond to the dominating filaments that we qualified as ridges and could be the potential sites of high-mass star formation. Such ridges have been identified in other star-forming regions such as DR 21 in Cygnus X (Schneider et al. 2010a) or W43-main in W43 (Nguyen Luong et al. 2011). Such self-gravitating, massive cloud structures with large aspect ratios are difficult to form in numerical simulations of molecular clouds in static boxes but a few good candidates may be seen in colliding flows simulations (e.g. Heitsch et al. 2009).
6 Stellar content relative to cloud structure
Star formation is controlled by the interplay between gravity and turbulence. On large scales, turbulence provides stability whilst on smaller scales it can create local high density regions where self-gravity can take hold. When a molecular cloud is mostly shaped by turbulence, the mass of three-dimensional structures should be directly proportional to the radius squared (M r2) (Larson 1981) and when gravity is the dominant factor shaping the molecular cloud, the relation is M r (Bonnor 1956). At small and intermediate scales ( 0.06 - 1 pc) the MRA profiles of Centre-Ridge and South-Nest (Fig. 6) are consistent with a relation for gravitationally-bound (Bonnor-Ebert-like) filaments, while at scales 1 pc, the behaviour of the South-Nest (and Centre-Nest) approaches that of a turbulent medium. A MRA approach (Fig. 6) reveals a stronger concentration of material in the filaments/ridges of the Centre-Ridge than in the South-Nest. The mass distribution of the Centre-Ridge, i.e., well ordered dense structure such as the ridge and several high-mass protostars, suggests that it is governed by gravity rather than turbulence.
The column density probability distribution function has been widely used by observers and theoreticians to statistically characterise the cloud structure as a function of the star-formation activity. Kainulainen et al. (2009) find that the shape of their observed column density distributions changes with the star formation status, clouds with active star formation develop a power-law tail at high column densities, in agreement with some numerical simulations including gravity (e.g. Ballesteros-Paredes et al. 2011). Our PDF analysis focuses on high-column density regions, above the mag mentioned for the beginning of such a power-law tail. The striking difference between the flat tail of the Center-Ridge and the steepening of the South-Nest reflects the presence or absence of a ridge. According to some models, tails are indicative of gravity-dominated regions (Klessen 2000) but others suggest that they are the signature of stronger cloud evolution (Cho & Kim 2011).
Above 30 mag, the Centre-Ridge reaches a higher column density with a flatter PDF than the South-Nest. A flatter slope is expected for coherent structures created via constructive large-scale flows rather than small scale turbulence (e.g. Federrath et al. 2010). A higher column density is achieved when the compression of material is stronger and thus the velocity difference of converging flows is probably higher. The PDFs of the filament crest pixels (from DisPerSE, not shown) mirror the PDFs of the corresponding sub-regions (Fig. 5) derived from the column density map. The steeper PDF and the smaller concentration of material in the South-Nest, with respect to the Centre-Ridge, suggests this region to be more turbulent.
7 Summary
We present 3 square degree Herschel maps of Vela C in the far-infrared and submillimetre, using the PACS and SPIRE instruments. The Vela C molecular complex houses both hot evolved objects such as RCW 36, and more cold diffuse filamentary structure. At = 7 mag, the Vela C complex segregates into five distinct sub-regions, which is confirmed by a multiresolution analysis. Using probability distribution functions and a multiresolution analysis both of the South-Nest and Centre-Ridge sub-regions, the two most contrasting sub-regions, appear to be forming stars though the Centre-Ridge contains more massive protostellar candidates than the South-Nest. The above structure analysis suggests that in Vela C high-mass star formation proceeds preferentially in the very high column density dominant filaments we called ridges (reaching N 1023 cm-2) which may result from the constructive convergence of flows. Such processes have been advocated for the formation of high-mass stars (cf Schneider et al. 2010a; Csengeri et al. 2011).
Acknowledgements.
T.H. is supported by a CEA/Marie-Curie Eurotalents Fellowship. Part of this work was supported by the ANR (Agence Nationale pour la Recherche) project ‘PROBeS’, number ANR-08-BLAN-0241. This work has made use of the TOPCAT (Taylor 2005) and Yorick freeware packages (see http://www.starlink.ac.uk/topcat/, http://yorick.sourceforge.net/). Fig. 8 was generated using APLpy, an open-source plotting package for Python hosted at http://aplpy.github.com. We would like to thank the anonymous referee, whose comments contributed to improve the manuscript. SPIRE has been developed by a consortium of institutes led by Cardiff Univ. (UK) and including Univ. Lethbridge (Canada); NAOC (China); CEA, LAM (France); IFSI, Univ. Padua (Italy); IAC (Spain); Stockholm Observatory (Sweden); Imperial College London, RAL, UCL-MSSL, UKATC, Univ. Sussex (UK); Caltech, JPL, NHSC, Univ. Colorado (USA). This development has been supported by national funding agencies: CSA (Canada); NAOC (China); CEA, CNES, CNRS (France); ASI (Italy); MCINN (Spain); SNSB (Sweden); STFC (UK); and NASA (USA). PACS has been developed by a consortium of institutes led by MPE (Germany) and including UVIE (Austria); KU Leuven, CSL, IMEC (Belgium); CEA, LAM (France); MPIA (Germany); INAF-IFSI/OAA/OAP/OAT, LENS, SISSA (Italy); IAC (Spain). This development has been supported by the funding agencies BMVIT (Austria), ESA-PRODEX (Belgium), CEA/CNES (France), DLR (Germany), ASI/INAF (Italy), and CICYT/MCYT (Spain).References
- André et al. (2010) André, P., Men’shchikov, A., Bontemps, S., et al. 2010, A&A, 518, L102
- André et al. (2011) André, P., Men’shchikov, A., Könyves, V., & Arzoumanian, D. 2011, in IAU Symposium, Vol. 270, IAU Symposium, ed. J. Alves, B. G. Elmegreen, J. M. Girart, & V. Trimble, 255–262
- Arzoumanian et al. (2011) Arzoumanian, D., André, P., Didelon, P., et al. 2011, A&A, 529, L6
- Baba et al. (2004) Baba, D., Nagata, T., Nagayama, T., et al. 2004, ApJ, 614, 818
- Ballesteros-Paredes et al. (2011) Ballesteros-Paredes, J., Vazquez-Semadeni, E., Gazol, A., et al. 2011, ArXiv e-prints
- Bernard et al. (2010) Bernard, J.-P., Paradis, D., Marshall, D. J., et al. 2010, A&A, 518, L88+
- Beuther et al. (2002) Beuther, H., Schilke, P., Menten, K. M., et al. 2002, ApJ, 566, 945
- Bohlin et al. (1978) Bohlin, R. C., Savage, B. D., & Drake, J. F. 1978, ApJ, 224, 132
- Bonnor (1956) Bonnor, W. B. 1956, MNRAS, 116, 351
- Cho & Kim (2011) Cho, W. & Kim, J. 2011, MNRAS, 410, L8
- Csengeri et al. (2011) Csengeri, T., Bontemps, S., Schneider, N., Motte, F., & Dib, S. 2011, A&A, 527, A135
- di Francesco et al. (2010) di Francesco, J., Sadavoy, S., Motte, F., et al. 2010, A&A, 518, L91
- Federrath et al. (2010) Federrath, C., Roman-Duval, J., Klessen, R. S., Schmidt, W., & Mac Low, M.-M. 2010, A&A, 512, A81
- Griffin et al. (2010) Griffin, M. J., Abergel, A., Abreu, A., et al. 2010, A&A, 518, L3
- Heitsch et al. (2009) Heitsch, F., Ballesteros-Paredes, J., & Hartmann, L. 2009, ApJ, 704, 1735
- Hennebelle et al. (2003) Hennebelle, P., Whitworth, A. P., Gladwin, P. P., & André, P. 2003, MNRAS, 340, 870
- Hennemann et al. (2010) Hennemann, M., Motte, F., Bontemps, S., et al. 2010, A&A, 518, L84
- Hildebrand (1983) Hildebrand, R. H. 1983, QJRAS, 24, 267
- Hill et al. (2005) Hill, T., Burton, M. G., Minier, V., et al. 2005, MNRAS, 363, 405
- Hill et al. (2010) Hill, T., Longmore, S. N., Pinte, C., et al. 2010, MNRAS, 402, 2682
- Hill et al. (2009) Hill, T., Pinte, C., Minier, V., Burton, M. G., & Cunningham, M. R. 2009, MNRAS, 392, 768
- Juvela et al. (2011) Juvela, M., Ristorcelli, I., Pelkonen, V.-M., et al. 2011, A&A, 527, A111+
- Kainulainen et al. (2009) Kainulainen, J., Beuther, H., Henning, T., & Plume, R. 2009, A&A, 508, L35
- Klessen (2000) Klessen, R. S. 2000, ApJ, 535, 869
- Könyves et al. (2010) Könyves, V., André, P., Men’shchikov, A., et al. 2010, A&A, 518, L106
- Krumholz & McKee (2008) Krumholz, M. R. & McKee, C. F. 2008, Nature, 451, 1082
- Larson (1981) Larson, R. B. 1981, MNRAS, 194, 809
- Lefloch & Lazareff (1994) Lefloch, B. & Lazareff, B. 1994, A&A, 289, 559
- Liseau et al. (1992) Liseau, R., Lorenzetti, D., Nisini, B., Spinoglio, L., & Moneti, A. 1992, A&A, 265, 577
- Massi et al. (2003) Massi, F., Lorenzetti, D., & Giannini, T. 2003, A&A, 399, 147
- May et al. (1988) May, J., Murphy, D. C., & Thaddeus, P. 1988, A&AS, 73, 51
- Men’shchikov et al. (2010) Men’shchikov, A., André, P., Didelon, P., et al. 2010, A&A, 518, L103
- Miville-Deschênes et al. (2005) Miville-Deschênes, M.-A., Boulanger, F., Reach, W. T., & Noriega-Crespo, A. 2005, ApJ, 631, L57
- Molinari et al. (2010) Molinari, S., Swinyard, B., Bally, J., et al. 2010, A&A, 518, L100
- Motte et al. (2007) Motte, F., Bontemps, S., Schilke, P., et al. 2007, A&A, 476, 1243
- Motte et al. (2003) Motte, F., Schilke, P., & Lis, D. C. 2003, ApJ, 582, 277
- Motte et al. (2010) Motte et al., F. 2010, A&A, 518, L77
- Murphy & May (1991) Murphy, D. C. & May, J. 1991, A&A, 247, 202
- Netterfield et al. (2009) Netterfield, C. B., Ade, P. A. R., Bock, J. J., et al. 2009, ApJ, 707, 1824
- Nguyen Luong et al. (2011) Nguyen Luong, Q., Motte, F., Schuller, F., et al. 2011, A&A, 529, A41+
- Ott (2010) Ott, S. 2010, in Astronomical Society of the Pacific Conference Series, Vol. 434, Astronomical Data Analysis Software and Systems XIX, ed. Y. Mizumoto, K.-I. Morita, & M. Ohishi, 139–143
- Planck Collaboration a., (2011) Planck Collaboration a., Ade, P. A. R., Aghanim, N., et al. 2011, ArXiv e-prints
- Poglitsch et al. (2010) Poglitsch, A., Waelkens, C., Geis, N., et al. 2010, A&A, 518, L2
- Rathborne et al. (2007) Rathborne, J. M., Simon, R., & Jackson, J. M. 2007, ApJ, 662, 1082
- Schneider et al. (2010a) Schneider, N., Csengeri, T., Bontemps, S., et al. 2010a, A&A, 520, A49
- Schneider et al. (2010b) Schneider, N., Motte, F., Bontemps, S., et al. 2010b, A&A, 518, L83
- Sousbie (2011) Sousbie, T. 2011, MNRAS, 414, 350
- Sousbie et al. (2011) Sousbie, T., Pichon, C., & Kawahara, H. 2011, MNRAS, 414, 384
- Starck et al. (1994) Starck, J.-L., Bijaoui, A., Lopez, B., & Perrier, C. 1994, A&A, 283, 349
- Taylor (2005) Taylor, M. B. 2005, in Astronomical Society of the Pacific Conference Series, Vol. 347, Astronomical Data Analysis Software and Systems XIV, ed. P. Shopbell, M. Britton, & R. Ebert, 29
- Walsh et al. (1998) Walsh, A. J., Burton, M. G., Hyland, A. R., & Robinson, G. 1998, MNRAS, 301, 640
- Wouterloot & Brand (1989) Wouterloot, J. G. A. & Brand, J. 1989, A&AS, 80, 149
- Yamaguchi et al. (1999) Yamaguchi, N., Mizuno, N., Saito, H., et al. 1999, PASJ, 51, 775
- Zavagno et al. (2010) Zavagno, A., Russeil, D., Motte, F., et al. 2010, A&A, 518, L81+
Appendix A Online Material
![[Uncaptioned image]](/html/1108.0941/assets/x12.png)
![[Uncaptioned image]](/html/1108.0941/assets/x13.png)
![[Uncaptioned image]](/html/1108.0941/assets/x14.png)
![[Uncaptioned image]](/html/1108.0941/assets/x15.png)