The lesser role of starburstsfor star formation at
Abstract
Two main modes of star formation are know to control the growth of galaxies: a relatively steady one in disk-like galaxies, defining a tight star formation rate (SFR)-stellar mass sequence, and a starburst mode in outliers to such a sequence which is generally interpreted as driven by merging. Such starburst galaxies are rare but have much higher SFRs, and it is of interest to establish the relative importance of these two modes. PACS/Herschel observations over the whole COSMOS and GOODS-South fields, in conjunction with previous optical/near-IR data, have allowed us to accurately quantify for the first time the relative contribution of the two modes to the global SFR density in the redshift interval , i.e., at the cosmic peak of the star formation activity. The logarithmic distributions of galaxy SFRs at fixed stellar mass are well described by Gaussians, with starburst galaxies representing only a relatively minor deviation that becomes apparent for SFRs more than 4 times higher than on the main sequence. Such starburst galaxies represent only 2% of mass-selected star forming galaxies and account for only 10% of the cosmic SFR density at . Only when limited to SFR, off-sequence sources significantly contribute to the SFR density (%). We conclude that merger-driven starbursts play a relatively minor role for the formation of stars in galaxies, whereas they may represent a critical phase towards the quenching of star formation and morphological transformation in galaxies.
Subject headings:
galaxies: evolution — galaxies: interactions — galaxies: nuclei — galaxies: starburst1. Introduction
Star forming galaxies follow a tight correlation between their stellar mass () and star formation rate (SFR), defining a main sequence (MS) that has been recognized in the local Universe (Brinchmann et al. 2004; Salim et al. 2007; Peng et al. 2010), as well as at intermediate redshifts (Noeske et al. 2007; Elbaz et al. 2007; Daddi et al. 2007; Pannella et al. 2009; Rodighiero et al. 2010a, Karim et al. 2011), and beyond (Daddi et al. 2009; Gonzalez et al. 2010). With SFR , the slope can differ substantially depending on sample selection and the procedures for measuring SFR and , with values in the above literature ranging from to . Moreover, its normalization rapidly rises from to –2.5 as , then flattening all the way to the highest redshifts (Daddi et al. 2007, Rodighiero et al. 2010a; Karim et al. 2011). Slope and normalization of the SFR relation play a crucial role in the growth of galaxies and in the evolution of their mass function (Renzini 2009; Peng et al. 2010, 2011). Observations of the CO molecular gas content of MS galaxies indicate that their star formation efficiency does not depend strongly on cosmic epoch to , with the SFR increase being due to higher molecular gas fractions (Daddi et al. 2008; 2010a; Tacconi et al. 2010; Geach et al. 2011).
On the other hand, outliers are known to exist, with very high specific SFR (SSFR) compared to normal MS galaxies, such as local ultra-luminous infrared galaxies (ULIRG, Sanders & Mirabel 1996, Elbaz et al. 2007), and at least some of the submm-selected galaxies (SMG) at (Tacconi et al. 2008; Daddi et al. 2007; 2009; Takagi et al. 2008). What does differentiate such active behemoths from the dominant MS population? Outliers are galaxies in which the SSFR has been boosted by some event, possibly a major merger (e.g., Mihos & Hernquist 1996; di Matteo et al. 2008; Martig et al. 2010; Bournaud et al. 2011), as suggested by local ULIRGs and SMGs being dominated by gas-rich major mergers (e.g. Sanders et al. 1988). Indeed, MS galaxies and outliers appear to be in different star formation regimes: a quasi–steady, long–lasting mode for disks and a more rapid, starburst mode in major mergers or in the densest SF regions (Daddi et al. 2010b; Genzel et al. 2010).
So far it has been unclear by which of these two modes most of the stars in galaxies were formed. While MS galaxies are optically thin in the UV (Daddi et al. 2005; 2007), MS outliers are generally optically thick (Goldader et al. 2002, Chapman et al. 2005) and far-IR observations are required to reliably derive their SFRs. The PACS camera (Poglitsch et al. 2010) onboard Herschel (Pilbratt et al. 2010) now allows for the first time to obtain deep far-IR observation probing SFRs down to MS levels for typical galaxies with at , i.e., at the peak epoch of the cosmic SFR density and of the space density of SMGs (Chapman et al. 2005). In this letter we combine wide area PACS observations of the COSMOS field with deeper data in the GOODS field, both taken as a part of the PEP survey (Lutz et al. 2011), and obtain a first accurate estimate of the relative role of MS and outlier galaxies on the formation of stars at . Red and dead (passive) galaxies, though, exist at these cosmic epochs, and form a separate sequence below the MS of star-forming galaxies. Their contribution will be ignored in this Letter. We use a Salpeter IMF and a standard WMAP cosmology.
2. Sample selection and measurements
In order to obtain a meaningful census of star-forming galaxies on and off the MS, one has to cover the SFR plane down to low SFR and levels, and do so over a large area to include rare objects with the highest SFRs. We reach this goal by combining far-IR-selected (i.e., SFR-selected) and near-IR-selected (i.e., -selected) star-forming samples in the COSMOS and in GOODS-South fields, having both UV- and far IR-based SFR determinations. We first describe the datasets used, sample selections and SFR and measurements. We consider only galaxies within the redshift range of , based either on spectroscopic or photometric redshifts. The datasets include in total 576 and 122 PACS-detected galaxies in the COSMOS and GOODS-South fields, respectively, and 18,981 and 586 BzK-selected (cf. Daddi et al. 2004) sources in the COSMOS and GOODS-South fields.
2.1. SFR-selected Herschel samples
Herschel-PACS observations cover 2.04 square degrees over the COSMOS field down to a limit of 8 and 17 mJy at 100 and 160 m, respectively, well above confusion limits (Lutz et al. 2011). Blending is not a major issue in the PACS data, and photometry was carried out by PSF-fitting at 24m prior positions. The detection limits correspond to yr-1 at (rising to 300 at z=2.5). We cross-matched over a common area of 1.73 square degrees the PACS detections with the IRAC-selected catalog of Ilbert et al. (2010), so to obtain UV-to-8m photometry, accurate photometric redshifts and stellar masses by SED fits as described in Rodighiero et al. (2010b). At the mass completeness is granted above (Ilbert et al. 2010). IR luminosities (hence SFRs) are derived from PACS fluxes using a set of empirical templates of local objects (Polletta et al. 2007; Gruppioni et al. 2010) as described in Rodighiero et al. (2010a). If, instead, we adopt the templates from Chary & Elbaz (2001), consistent SFR estimates are obtained with no bias and a scatter of dex (that represents the typical error associated to our SFRs) . The PACS data in GOODS are deeper than those in COSMOS, reaching detection levels of 1.8, 2.0 and 4.0 mJy at 70, 100 and 160 m, respectively (Berta et al. 2011). The typical SFR limit at is yr-1. For PACS data reduction, photometry, far-IR based SFRs, and estimates we proceeded as for the COSMOS field.
2.2. Mass-selected BzK samples
For the GOODS-S field we used the -band selected sample of star-forming BzK galaxies from Daddi et al. (2007), which reaches over a 120 arcmin2 field, with SFR estimated from the UV rest-frame luminosity corrected for dust reddening and taking advantage of a substantial fraction of spectroscopic redshifts. The deep BzK GOODS sample was complemented with the larger statistics (in particular for the more massive sources) provided by the BzK sample over the COSMOS field (McCracken et al. 2010), where here masses and SFRs have been computed using the same procedure as in Daddi et al. (2007), with typical errors of a factor .
Use of UV-based SFRs allows one to reach down to a few M⊙ yr-1 at . Daddi et al. (2007) performed detailed comparisons of UV-based SFRs with 70m, 850m, radio and X-ray based SFRs from stacking, finding good agreement. Pannella et al. (2009) used more than 30,000 BzK-selected galaxies in COSMOS, finding that UV-based SFRs were slightly underestimated compared to radio. More recently Nordon et al. (2010) suggest that UV-based SFRs might actually be overestimated up to a factor of 1.5-2 at , using Herschel observations (although see Wuyts et al. 2011a for a discussion of how this conclusion depends on sample selections). This relatively low level of uncertainty does not affect the main conclusion of this paper.
3. Results
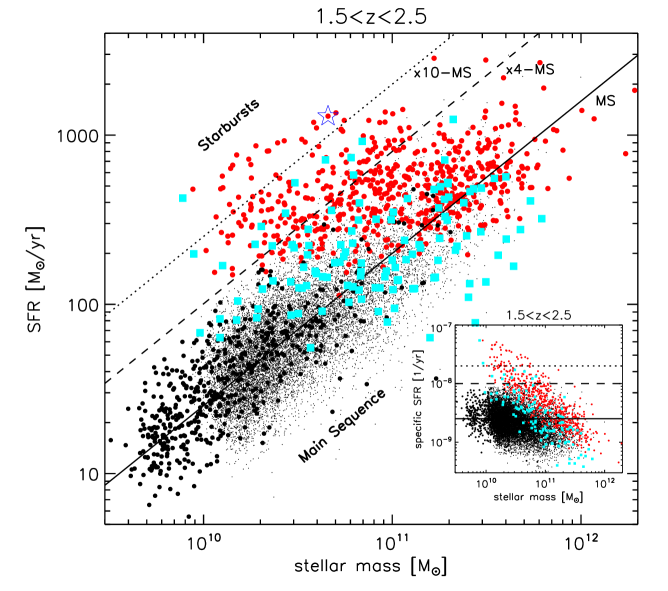
Fig. 1 shows the SFRs versus stellar masses for the four galaxy samples in this study. At first sight the PACS-based SFR relation for the COSMOS sample (red symbols) bears little resemblance to the corresponding UV-based relation (black points). PACS-based SFRs run almost flat with mass, as opposed to the UV-based SFRs that increase almost linearly with mass. We maintain that this different behavior is due to the different selection of the two samples, one being SFR limited, the other being mass limited. It is immediately apparent from Fig. 1 that the vast majority of BzK-selected galaxies of a few to several are not detected by PACS, implying that their SFR is lower than yr-1. Hence the intrinsic SFR relation must be steeper than suggested by the PACS data alone. That this must be the case is indicated by the deeper PACS data over the GOODS field (cyan points), which start populating to lower stellar masses the MS defined by the BzK-selected sample with UV-based SFRs. Still, the PACS SFR-selection cut is visible at , and most BzK galaxies remain undetected below this limit.
The PACS-GOODS sample also allows to populate the region with excess SFRs above the MS, something harder to do with UV-based SFRs due to obscuration. The combination of such datasets is clearly ideal to obtain a statistical census of high-SFR galaxies as well as high SSFR (see the insert of Fig. 1). Indeed, half of PACS-detected sources over the COSMOS field, either do not have a BzK counterpart, or their SFR is a factor or more higher than their UV-based SFR. We interpret this as evidence that most of the SF activity in these galaxies is heavily dust-obscured in the UV.
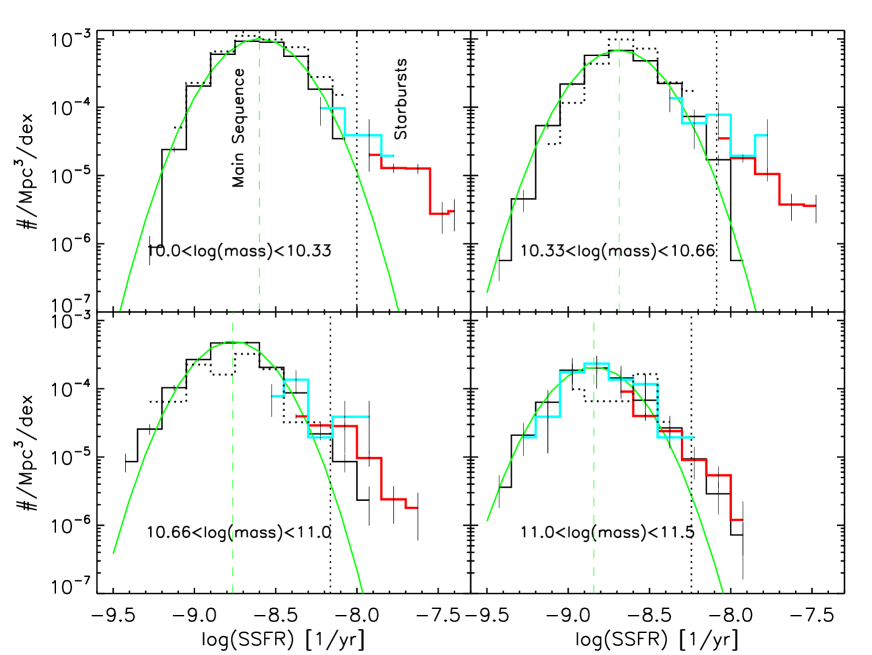
In order to investigate the frequency and relative role of galaxies on and off the MS, we have derived the number density distribution of galaxies in four stellar mass bins as a function of their SSFR (see Fig. 2). We assume no redshift incompleteness for the BzK galaxies over the range (see, e.g., McCracken et al. 2010), whereas for PACS galaxies the flux limits imply different SFR limits as a function of redshifts. Therefore, corrections were computed with the same templates used to derive the IR luminosities. This procedure implicitly assumes no strong evolution of the number density of the population in the probed redshift range. This is confirmed by the average being and , for the COSMOS- and GOODS-PACS samples, respectively. The SSFR distributions from the four samples agree within the errors (Poisson) in the regions of overlap, providing an important cross-check of the solidity of our approach.
In absence of a clear bimodality in Fig. 1, the distribution functions shown in Fig. 2 allow us to objectively define MS outliers, hence starburst galaxies. To this purpose, Gaussians functions are fitted to the BzK distributions in the four mass bins, resulting in a nearly constant dex, slightly lower than reported in Daddi et al. (2007). Deviations from the Gaussian distributions start to be clearly detected at SSFRs 0.6 dex above the average (Fig. 2; or some 2.5), and we adopt this threshold to define on-sequence and off-sequence galaxies. Such deviations are less obvious in the highest mass bin. We also note that the peak positions of the Gaussians shift as a function of the bin central mass, with a slope of in the log(SFR)–log() relation111The MS best-fit is log(SFR)=-6.42+log(mass)*0.79 (slightly shallower than the 0.9 slope reported by Daddi et al. 2007). It is worth emphasizing the good agreement of the four independent samples in the common SSFR bins, in particular for , where PACS-GOODS fully samples the MS distribution around its peak. In this case the UV and IR SFR tracers define exactly the same Gaussian distribution.
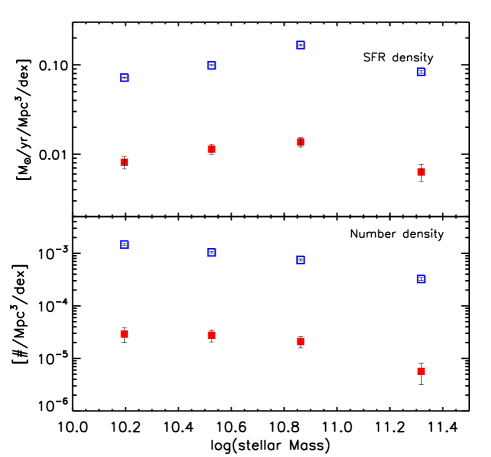

From the histograms in Fig. 2 we have estimated the relative contribution of on-sequence and off-sequence galaxies to the total comoving number density and SFR density, in absolute (Fig. 3) as well as relative (Fig. 4) terms. The space density of galaxies in the highest mass bin is getting lower, as we are entering the exponentially decaying part of the mass function. The MS population dominates the SFR density at all masses, whereas off-sequence starburst galaxies contribute almost constantly of the total, or even less since some outliers may actually be MS objects with exceptionally large errors (in either SFR or M∗). If a top-heavy IMF were really to apply to starbursts, then this fraction would even be largely reduced. The number density of off-sequence sources is also very small, varying between 2 and 3 as a function of the stellar mass. Only in SFR-limited samples (Fig. 4), off-sequence galaxies become important representing % of the galaxies with SFR yr-1 and 20% of those with SFRM⊙ yr-1. This suggests that even among SMGs (or luminous Herschel selected populations) only a fraction of the galaxies are strong MS outliers.
4. Combining UV and IR SFR tracers
An important aspect of this work concerns the combination of UV-based and IR-based SFR indicators for the sources for which both data are available. Indeed, about 70%(80%) of the COSMOS(GOODS) PACS sources have a BzK counterpart. For of these PACS-detected galaxies the IR-based SFRs exceed the UV-based SFRs by factors of 4–10, that we qualify as optically thick starbursts. For these sources the SFR(UV) is totally unreliable. However, these objects are almost all outliers from the MS, and they represent only % of the total BzK population. For the other objects, a direct comparison of UV-based and far IR-based SFRs for GOODS BzK-selected galaxies shows reasonably good agreement, consistently with the results of Nordon et al. (2010) and Reddy et al. (2011 in prep.).
To further test the reliability of the SFR(UV), we analyzed the BzK population with SFR(UV) in the same SFR range accessible by PACS in the deep GOODS field. We restricted our analysis to SFR(UV) objects in two mass bins: a) log(M) and b) log(M), and then stacked on the 160m map the BzK PACS-undetected sources combining them with PACS detections to get a mean far-IR SFR for the BzK samples (as in Rodighiero et al. 2010a). For the two mass bins the result is: a) SFR(UV) and SFR(PACS); b) SFR(UV) and SFR(PACS). Reassuringly, in the common mass and SFR ranges, the PACS and UV SFR are in excellent agreement (with only 10% of UV overestimation in the highest mass bin that would not affect the conclusion of this work).
Summarizing, we found that PACS and UV based SFRs are in good agreement along the MS, while the off-sequence discrepancies (i.e., objects for which UV can dangerously underestimate the actual SFR) are due to dust obscuration at high SFR levels. These objects represent of star-forming galaxies at and .
5. The most extreme Star Forming sources and the obscured AGN activity
We have shown that the distribution of SSFRs in massive galaxies are largely Gaussian with of 0.24 dex, and relatively minor deviations only detected above dex of the main trend. Although some of these high SSFR galaxies will just be normal MS galaxies being scattered there by measurement errors, we conservatively identify all of them as (merging-driven) starbursts. Of course, also galaxies that are still on the MS can be witnessing merging events, given that not all mergers are expected to produce strong SFR enhancements (di Matteo et al. 2008), hence our off-sequence galaxies can be seen as objects where a major merger event has substantially boosted the SSFR, increasing it by a factor of .
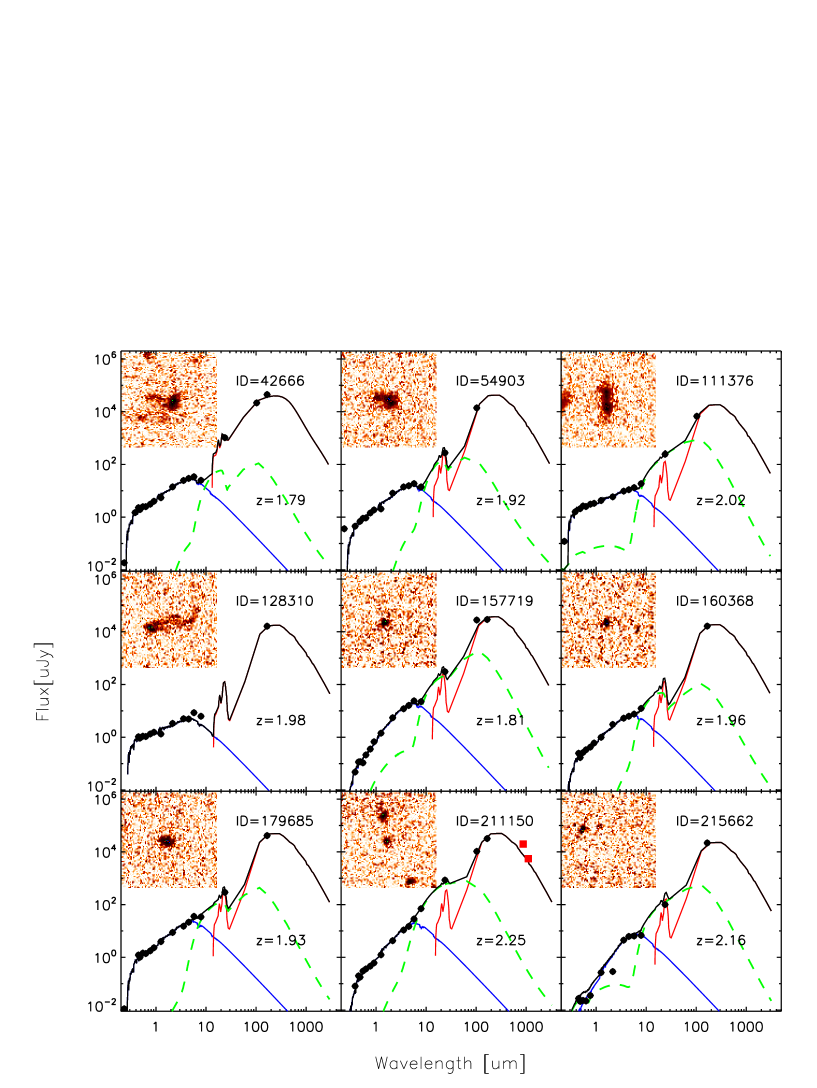
In order to investigate the nature of off-MS galaxies we have focused on the most extreme 28 objects, lying a factor 10 above the MS. We performed a simultaneous three components SED fitting analysis including the emission of stars and star-heated dust, and allowing also for the presence of a dusty torus (AGN), using the method described in Fritz et al. (2006). In Fig. 5 we report an example of the resulting SED fitting obtained for 9 representative objects, selected among the 28 sources. The presence of an AGN is required in most cases (25 out of 28) to reproduce the 24m emission, while its contribution to the is always lower than 5-10%, thus negligible. None of the 16 galaxies observed by Chandra is detected (Elvis et al. 2009), suggesting that the AGNs are extremely obscured. These objects are probably similar to the Fe emitting Compton thick QSO at from Feruglio et al. (2011), that qualifies as a starburst galaxy according to our criterion. Only 2 of our 28 sources fall in the AzTEC area (Scott et al. 2008), and one of them is detected in the millimeter catalog. Fig. 5 also reports ACS-F775W cutouts for the example objects. A few objects are consistent with advanced stage mergers (double components on the -band ACS COSMOS image, Koekemoer, A.M. et al. 2007), others are quite compact (consistent with the analysis of Elbaz et al. 2011), whereas some remain undetected. A more extended morphological analysis is postponed to a future paper (but see also Wuyts et al., 2011b).
6. Discussion
The redshift range corresponds to a Gyr cosmic time interval, hence our star-forming galaxies have on average spent in it Gyr. Therefore, the fact that only % of the massive galaxies are off the main sequence implies that on average each galaxy spends Myr in such a phase. This is actually much shorter than both the gas depletion timescale and the (outer rotation) dynamical time in starburst galaxies (Daddi et al. 2010; Genzel et al. 2010). This is also much shorter than the expected duration of the SFR-excess phase in mergers based on numerical simulations (e.g. di Matteo et al. 2008, Martig et al. 2010), where the duration of the phase with SFR in excess of over the pre-merger SFR is of order of 200-300 Myr (Bournaud et al. 2011). Most likely this is because only a fraction of massive star-forming galaxies undergoes major mergers during this time interval, and/or because most mergers do not produce a substantial increase of the SFR (consistent with the simulations of di Matteo et al. 2008).
All in all, our results quite clearly show that the merger-enhanced SFR phases are relatively unimportant for the formation of stars in galaxies, and probably at all redshifts given that is known to be the ’prime time’ for SMGs (Chapman et al. 2005), and that this is similar to what is observed in the local Universe (e.g. the percentual contribution of starburst is very small, Sanders & Mirabel, 1996). Still, going through this merging-driven starburst phase may be a critical phase for the transformation of star-forming galaxies into passive ellipticals. Hence, we maintain that off-sequence galaxies are likely to be crucial objects for our understanding galaxy formation and evolution.
References
- Berta et al. (2011) Berta, S., et al. 2011, arXiv:1106.3070
- Bournaud et al. (2011) Bournaud, F., et al. 2011, ApJ, 730, 4
- Brinchmann et al. (2004) Brinchmann, J., Charlot, S., White, S. D. M., Tremonti, C., Kauffmann, G., Heckman, T., & Brinkmann, J. 2004, MNRAS, 351, 1151
- Chapman et al. (2005) Chapman, S. C., Blain, A. W., Smail, I., & Ivison, R. J. 2005, ApJ, 622, 772
- Chary & Elbaz (2001) Chary, R., & Elbaz, D. 2001, ApJ, 556, 562
- Daddi et al. (2004) Daddi, E., Cimatti, A., Renzini, A., Fontana, A., Mignoli, M., Pozzetti, L., Tozzi, P., & Zamorani, G. 2004, ApJ, 617, 746
- Daddi et al. (2005) Daddi, E., et al. 2005, ApJ, 631, L13
- Daddi et al. (2007) Daddi, E., et al. 2007, ApJ, 670, 156
- Daddi et al. (2008) Daddi, E., Dannerbauer, H., Elbaz, D., Dickinson, M., Morrison, G., Stern, D., & Ravindranath, S. 2008, ApJ, 673, L21
- Daddi et al. (2009) Daddi, E., et al. 2009, ApJ, 694, 1517
- Daddi et al. (2010) Daddi, E., et al. 2010, ApJ, 713, 686
- Daddi et al. (2010) Daddi, E., et al. 2010, ApJ, 714, L118
- Di Matteo et al. (2008) Di Matteo, P., Bournaud, F., Martig, M., Combes, F., Melchior, A.-L., & Semelin, B. 2008, A&A, 492, 31
- Elbaz et al. (2007) Elbaz, D., et al. 2007, A&A, 468, 33
- Elbaz et al. (2011) Elbaz, D., et al. 2011, arXiv:1105.2537
- Elvis et al. (2009) Elvis, M., et al. 2009, ApJS, 184, 158
- Feruglio et al. (2011) Feruglio, C., Daddi, E., Fiore, F., Alexander, D. M., Piconcelli, E., & Malacaria, C. 2011, ApJ, 729, L4
- Fritz et al. (2006) Fritz, J., Franceschini, A., & Hatziminaoglou, E. 2006, MNRAS, 366, 767
- Geach et al. (2011) Geach, J. E., Smail, I., Moran, S. M., MacArthur, L. A., Lagos, C. d. P., & Edge, A. C. 2011, ApJ, 730, L19
- Genzel et al. (2010) Genzel, R., et al. 2010, MNRAS, 407, 2091
- Goldader et al. (2002) Goldader, J. D., Meurer, G., Heckman, T. M., Seibert, M., Sanders, D. B., Calzetti, D., & Steidel, C. C. 2002, ApJ, 568, 651
- González et al. (2010) González, V., Labbé, I., Bouwens, R. J., Illingworth, G., Franx, M., Kriek, M., & Brammer, G. B. 2010, ApJ, 713, 115
- Gruppioni et al. (2010) Gruppioni, C., et al. 2010, A&A, 518, L27
- Ilbert et al. (2010) Ilbert, O., et al. 2010, ApJ, 709, 644
- Karim et al. (2011) Karim, A., et al. 2011, ApJ, 730, 61
- Koekemoer et al. (2007) Koekemoer, A. M., et al. 2007, ApJS, 172, 196
- Lutz et al. (2011) Lutz, D., et al. 2011, arXiv:1106.3285
- Martig & Bournaud (2010) Martig, M., & Bournaud, F. 2010, ApJ, 714, L275
- McCracken et al. (2010) McCracken, H. J., et al. 2010, ApJ, 708, 202
- Mihos & Hernquist (1996) Mihos, J. C., & Hernquist, L. 1996, ApJ, 464, 641
- Noeske et al. (2007) Noeske, K. G., et al. 2007, ApJ, 660, L43
- Nordon et al. (2010) Nordon, R., et al. 2010, A&A, 518, L24
- Pannella et al. (2009) Pannella, M., et al. 2009, ApJ, 698, L116
- Peng et al. (2010) Peng, Y., et al. 2010, ApJ, 721, 193
- Peng et al. (2011) Peng, Y., Lilly, S. J., Renzini, A., & Carollo, M. 2011, arXiv:1106.2546
- Pilbratt et al. (2010) Pilbratt, G. L., et al. 2010, A&A, 518, L1
- Poglitsch et al. (2010) Poglitsch, A., et al. 2010, A&A, 518, L2
- Polletta et al. (2007) Polletta, M., et al. 2007, ApJ, 663, 81
- Renzini (2009) Renzini, A. 2009, MNRAS, 398, L58
- Rodighiero et al. (2010) Rodighiero, G., et al. 2010, A&A, 518, L25
- Rodighiero et al. (2010) Rodighiero, G., et al. 2010, A&A, 515, A8
- Salim et al. (2007) Salim, S., et al. 2007, ApJS, 173, 267
- Sanders et al. (1988) Sanders, D. B., Soifer, B. T., Elias, J. H., Madore, B. F., Matthews, K., Neugebauer, G., & Scoville, N. Z. 1988, ApJ, 325, 74
- Sanders & Mirabel (1996) Sanders, D. B., & Mirabel, I. F. 1996, ARA&A, 34, 749
- Scott et al. (2008) Scott, K. S., et al. 2008, MNRAS, 385, 2225
- Scoville et al. (2007) Scoville, N., et al. 2007, ApJS, 172, 1
- Tacconi et al. (2008) Tacconi, L. J., et al. 2008, ApJ, 680, 246
- Tacconi et al. (2010) Tacconi, L. J., et al. 2010, Nature, 463, 781
- Takagi et al. (2008) Takagi, T., Ono, Y., Shimasaku, K., & Hanami, H. 2008, MNRAS, 389, 775
- Wuyts et al. (2011) Wuyts, S., et al. 2011, ApJ in press, arXiv:1106.5502
- Wuyts et al. (2011) Wuyts, S., et al. 2011, submitted to ApJ, arXiv:1107.0317