The SEDs and Host Galaxies of the dustiest GRB afterglows††thanks: Based on observations made with GROND at the MPI/ESO 2.2 m telescope and with telescopes at the European Southern Observatory at LaSilla/Paranal, Chile under program 086.A-0533 and obtained from the ESO/ST-ECF Science Archive Facility from programs 177.A-0591 and 078.D-0416.
Abstract
Context. The afterglows and host galaxies of long gamma-ray bursts (GRBs) offer unique opportunities to study star-forming galaxies in the high- Universe. Until recently, however, the information inferred from GRB follow-up observations was mostly limited to optically bright afterglows, biasing all demographic studies against sight-lines that contain large amounts of dust.
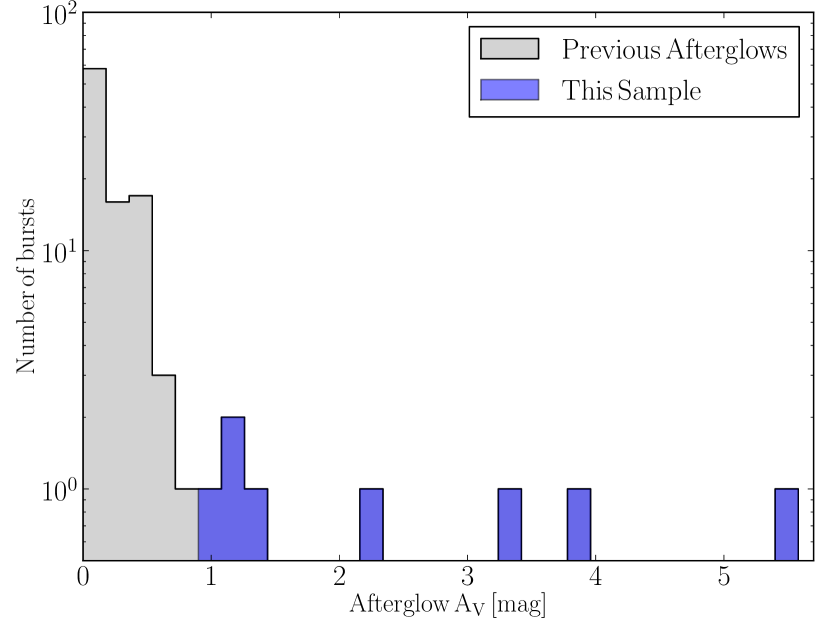
Aims. Here we present afterglow and host observations for a sample of bursts that are exemplary of previously missed ones because of high visual extinction () along the sight-line. This facilitates an investigation of the properties, geometry and location of the absorbing dust of these poorly-explored host galaxies, and a comparison to hosts from optically-selected samples.
Methods. This work is based on GROND optical/NIR and Swift/XRT X-ray observations of the afterglows, and multi-color imaging for eight GRB hosts. The afterglow and galaxy spectral energy distributions yield detailed insight into physical properties such as the dust and metal content along the GRB sight-line as well as galaxy-integrated characteristics like the host’s stellar mass, luminosity, color-excess and star-formation rate.
Results. For the eight afterglows considered in this study we report for the first time the redshift of GRB 081109 (), and the visual extinction towards GRBs 081109 () and 100621A (), which are among the largest ever derived for GRB afterglows. Combined with non-extinguished GRBs, there is a strong anti-correlation between the afterglow’s metals-to-dust ratio and visual extinction.
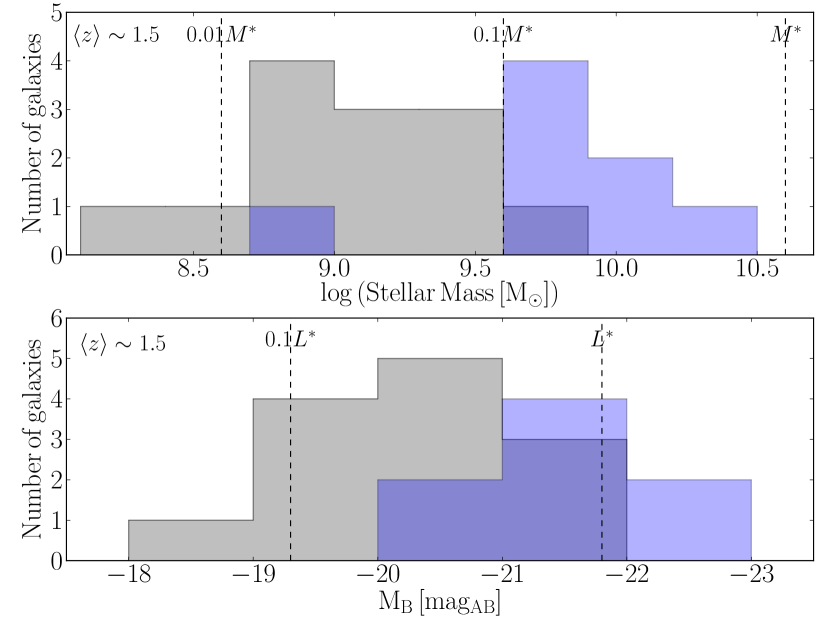
The hosts of the dustiest afterglows are diverse in their properties, but on average redder (), more luminous () and massive () than the hosts of optically-bright events. We hence probe a different galaxy population, suggesting that previous host samples miss most of the massive, chemically-evolved and metal-rich members. This also indicates that the dust along the sight-line is often related to host properties, and thus probably located in the diffuse ISM or interstellar clouds and not in the immediate GRB environment. Some of the hosts in our sample, are blue, young or of small stellar mass illustrating that even apparently non-extinguished galaxies possess very dusty sight-lines due to a patchy dust distribution.
Conclusions. The afterglows and host galaxies of the dustiest GRBs provide evidence for a complex dust geometry in star-forming galaxies. In addition, they establish a population of luminous, massive and correspondingly chemically-evolved GRB hosts. This suggests that GRBs trace the global star-formation rate better than studies based on optically-selected host samples indicate, and the previously-claimed deficiency of high-mass host galaxies was at least partially a selection effect.
Key Words.:
Gamma-ray burst: general, ISM: dust, extinction, Galaxies: star formation1 Introduction
Long gamma-ray bursts (GRBs, see e.g., Zhang 2007, for reviews; Gehrels et al. 2009, for reviews) are linked to core-collapse supernovae and hence star-formation via the death of massive stars (e.g., Galama et al. 1998; Hjorth et al. 2003). At high redshifts, where a significant fraction of the star-formation is thought to be dust-obscured (e.g., Adelberger & Steidel 2000; Chapman et al. 2005), GRBs and their host galaxies offer an independent track towards a better understanding and full census of the star-formation in the early Universe: GRBs, having luminous emission in a simple power-law spectrum provide the ideal background light to illuminate dust-enshrouded star-forming regions which would otherwise remain unexplored, while at the same time pinpointing their host galaxies.
However, the extent to which GRB hosts provide an unbiased picture of the formation of high-mass stars, and whether they preferentially occur in low-metallicity environments remains a much debated issue (e.g., Le Floc’h et al. 2003; Fynbo et al. 2003; Tanvir et al. 2004; Fruchter et al. 2006; Kocevski et al. 2009). In single progenitor models, metal-poor stars are favored by theory (Woosley 1993; MacFadyen & Woosley 1999), as they would in principle be able to keep more angular momentum at the time of stellar collapse due to smaller wind pressures and losses throughout their evolution (e.g., Yoon & Langer 2005; Mokiem et al. 2007). However, binary progenitor channels could also play an important role in the formation of long GRBs (e.g., Fryer et al. 1999), having somewhat relaxed metallicity constraints relative to single star progenitors (Fryer et al. 2007). Observations of GRB hosts are hence not only important in a cosmological context, but provide relevant clues to the exact nature of GRB progenitors.
A fundamental limit of hitherto available GRB host galaxy samples is the incompleteness which arises from the non-detection of the optical afterglow of a GRB (e.g., Groot et al. 1998; Fynbo et al. 2001). These optically dark bursts could be caused by either high-redshift (e.g., Greiner et al. 2009; Tanvir et al. 2009; Salvaterra et al. 2009; Cucchiara et al. 2011), large columns of dust (e.g., Klose et al. 2000, 2003; Tanvir et al. 2008; Perley et al. 2011b) or an intrinsically fainter optical afterglow as compared to the extrapolation of X-ray data when using synchrotron emission theory, i.e., a decoupled optical/X-ray afterglow light-curve (e.g., Panaitescu et al. 2006; Ghisellini et al. 2009; Nardini et al. 2010). New afterglow samples became available through the recent advent of dedicated afterglow follow-up campaigns on medium-to-large aperture telescopes (e.g., Fynbo et al. 2009a; Cenko et al. 2009; Greiner et al. 2011). These new afterglow samples reach completeness levels of 90% (Greiner et al. 2011) and settled the dark-burst issue: Around three quarters of dark bursts are the result of a dusty afterglow line of sight (e.g., Perley et al. 2009; Greiner et al. 2011). Accurate positions from afterglow observations are necessary to unambiguously associate galaxies to GRBs. The lack of optical/NIR afterglows for dark GRBs therefore implies an inherent bias against the associated host galaxies.
The available host population is not as complete as the most recent afterglow samples. Instead, it is largely selected from optically bright afterglows and shows a prevalence of young and vigorously star-forming galaxies with sub- luminosities and masses around (e.g., Bloom et al. 1998; Le Floc’h et al. 2003; Christensen et al. 2004; Fruchter et al. 2006; Savaglio et al. 2009, referenced as SGL09, hereafter). However, it is an open question whether this is a physical consequence of GRBs preferring low-metallicity environments, or merely a selection effect: Host galaxies of dark GRBs were typically not identified, and hence are under-represented in the available host sample.
Whether the physical characteristics of hosts of optically dark and bright GRBs are distinct is also the subject of discussion. Previous sample studies (e.g., Berger et al. 2003; Le Floc’h et al. 2003; Perley et al. 2009) have not revealed strong evidence of a significant difference. A handful of single dark GRBs were however hosted by red and dusty galaxies with high metallicities and stellar masses over (e.g., Levan et al. 2006; Berger et al. 2007; Levesque et al. 2010; Hashimoto et al. 2010; Küpcü Yoldaş et al. 2010; Chen et al. 2010). Recently Perley et al. (2010a, 2011a) suggested, that the general galaxy population hosting dark bursts is redder and more luminous and hence suggestive of a higher metallicity than those selected via optically bright afterglows.
In this paper, we study the nature of GRB hosts that previously escaped detection due to the dust bias, and are hence exemplary of those missing from demographic studies. We avail of dedicated GRB afterglow campaigns with high completeness to preselect the GRB hosts for this study. These afterglow data do not only provide accurate positions for host identifications, but for the first time allow us to directly select dust extinguished (and not only optically faint) GRBs via well-sampled broad-band (NIR to X-ray) afterglow observations.
After selecting afterglows with visual extinctions exceeding unity, we search for the associated hosts with the Gamma-Ray Optical and Near-Infrared Detector (GROND, Greiner et al. 2008) as well as the ESO Very Large and New Technology Telescopes (VLT and NTT, respectively) and the Ultra-Violet Optical Telescope (UVOT, Roming et al. 2005) onboard the Swift satellite (Gehrels et al. 2004).
The obtained data allow us to study the physical properties of the hosts of high- GRBs in detail, and to investigate the bias against dust in GRB host samples. As an ultimate consequence they address the role of GRB host galaxies as tracers of galaxy formation and evolution. Furthermore, they link afterglow diagnostics, i.e., detailed information about a single sight line, to host-integrated properties, and in this combination directly probe the nature of dust and its properties in high-redshift, star-forming galaxies.
Throughout this work, we adopt the convention that the flux density of the afterglow can be described as , and concordance (, , km/s/Mpc) CDM cosmology. All errors are given at confidence unless indicated otherwise. All magnitudes and colors are given or converted into the AB system.
2 Sample Selection
The host galaxy sample presented in this work is based on a direct measurement of large visual extinction along the GRB line of sight () from multi-color (NIR to X-ray) afterglow observations. Specifically, eight GRB afterglows (GRBs 070306, 070802, 080605, 080607, 080805, 081109, 090926B and 100621A) fulfill the selection criterion and define our initial host sample. Our host sample is a direct result of afterglow observations. The selection itself is hence not limited by galaxy brightness, nor introduces a bias towards luminous galaxies. Afterglow measurements for the initial selection have been obtained from the literature or by analyzing photometric optical/NIR data from the GROND archive. In the latter case, they are detailed in Sect. 3.1.
Our eight GRBs have a median redshift of . This is significantly lower than the published mean of Swift GRBs with measured redshifts (, Fynbo et al. 2009a111Including updates from http://www.mpe.mpg.de/~jcg/grbgen.html and http://www.raunvis.hi.is/~pja/GRBsample.html), but larger than the one of the previous host sample ( from SGL09), which includes a large number of pre-Swift events. Within the selected eight afterglows, four of them show a clear 2175Å dust feature (GRBs 070802, 080605, 080607, 080805), which is with the exception of GRB 080603A (Guidorzi et al. 2011; Kann et al. 2011) the full sample where a significant detection of this feature has been reported to date (e.g., Zafar et al. 2011). In fact, the 2175 Å feature could not have been detected in the rest of the sample. This arises from the combination of a large dust column, and not deep and rapid enough follow-up in the case of GRBs 070306 and 090926B, or no observational wavelength coverage at (GRBs 081109, 100621A).
While observationally challenging, the requirement of a dust measurement has several obvious advantages over a selection based on the optical-to-X-ray flux ratio (, Jakobsson et al. 2004; Rol et al. 2005; van der Horst et al. 2009, see e.g.,). Most importantly, the selection is the result of a measurement rather than an extrapolation, and provides a clean selection of dusty GRBs: Our afterglows are chosen accord to their visual extinction, instead of only their optical faintness. The latter events could of course also be at high- or have different emission mechanisms in the optical and X-ray regime.
We note, that our selection is still somewhat model-dependent, specifically that the afterglow emits synchrotron radiation in the optical/NIR and X-ray regime. Despite the lack of conclusive alternatives to the standard synchrotron-fireball model, there are still puzzling features in well-sampled multi-color light curves, such as chromatic222Chromatic light-curve breaks are breaks in the X-ray regime not associated with contemporanous breaks in the optical/NIR bands, and vice versa. breaks, optical and/or X-ray flares or plateaus (e.g., Panaitescu et al. 2006; Evans et al. 2009; Krühler et al. 2009; Oates et al. 2011, also illustrated in Fig. 3). The apparently decoupled optical and X-ray light curve for some bursts results in a strong dependence of on the time of the observation (which in fact is directly observed in some cases, see e.g., Filgas et al. 2011), and hence the dark burst definition depends also on observational constraints and not only physical properties.
In addition, the required optical and/or NIR afterglow detection yields the GRB position to sub-arcsec accuracy, and hence negligible chance-coincidence probabilities for field galaxies, which is particularly important for small sample sizes as in this work. For all events a spectroscopic redshift is available from the literature, or could be obtained via host galaxy spectroscopy. This enables quantitative studies, such as the comparison between specific sight-lines against host-integrated properties, as well as an investigation of the relation between the dusty hosts to the host sample of SGL09.
Due to the inherent difficulties to accurately localize high- afterglows, most previous afterglow samples are biased towards small visual extinctions. This is illustrated in Fig. 1, which shows the visual extinction of GRBs selected for this work as compared to previously compiled values. The latter were taken from Kann et al. (2006, 2010); Schady et al. (2010); Greiner et al. (2011) and Zafar et al. (2011).
3 Observations
3.1 Afterglows
Optical and near-infrared measurements of the afterglows of GRBs 070306, 070802, 080605, 080607, 080805 and 090926B or results thereof are taken from Jaunsen et al. (2008), Krühler et al. (2008), Perley et al. (2011b), Greiner et al. (2011), and Zafar et al. (2011), respectively. GROND observations of the afterglows of GRB 081109 and GRB 100621A are not presented elsewhere and are shortly described in the following.
3.1.1 GRB 081109
Swift triggered on GRB 081109 (Immler et al. 2008), and X-ray and NIR measurements of the afterglow were rapidly reported by Beardmore et al. (2008) and D’Avanzo et al. (2008). GROND observations in seven optical/NIR filters () simultaneously, started 17.1 hr after the GRB trigger (Clemens et al. 2008b) and a preliminary analysis of the spectral energy distribution (SED) already revealed significant reddening of the optical/NIR afterglow (Clemens et al. 2008a). GROND continued to observe the transient at 2, 3, 6 and 378 days after the trigger, where the host brightness was derived from the last epoch. GROND afterglow and host measurements are given in Table 1, and Tables 3 and 4, respectively. A possible host galaxy was also reported in the UVOT white filter (Kuin & Immler 2008). High-energy prompt and afterglow data, early NIR imaging and a light curve and X-ray spectral analysis of this burst are presented by Jin et al. (2009).
3.1.2 GRB 100621A
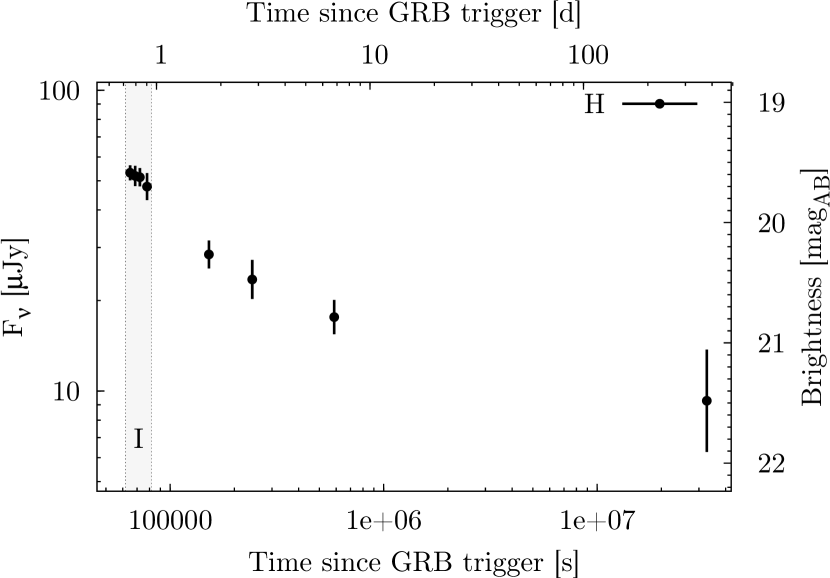
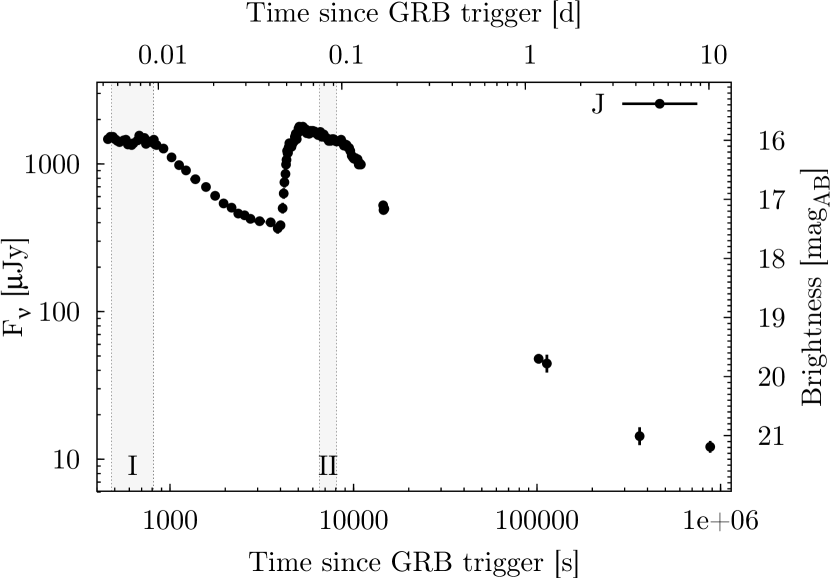
GROND reacted immediately (Updike et al. 2010) to the Swift trigger of GRB 100621A (Ukwatta et al. 2010b) taking the first images at 230 s after the burst. Simultaneous imaging in continued for 3.05 h, and was resumed on night 2, 4 and 10 after the burst. Analysis of the Swift/X-ray data and further detections of the NIR afterglow were reported by Stratta et al. (2010) and Naito et al. (2010), respectively. Early GROND data already revealed evidence for substantial reddening and host emission dominating the flux in the bluest filters, which was also seen by Swift/UVOT (Oates & Ukwatta 2010). Afterglow and host measurements are again shown in Tables 1, 3 and 4. The temporal evolution of the optical/NIR afterglow is complex with a very steep increase in brightness of around 1.5 mag in the band from 3.5 to 4.5 ks after the trigger. The light curve is hence very similar the one of GRB 081029 (Nardini et al. 2011), where an analogous behavior could be associated with the intrinsic properties of the GRB and not to changes in the intervening dust content. For completeness, the -band light curve of GRB 100621A is shown in Fig. 3, but its detailed modeling and interpretation is beyond the scope of this paper, and will be discussed in a future work.
3.2 Hosts
Once the sample based on afterglow host extinction was defined, late follow-up observations were initiated first with GROND, and in case of non-detections in individual filters, were continued with telescopes of successively increasing aperture size, specifically with EFOSC/SOFI at the NTT (4m class) and FORS2/HAWKI at the VLT (8m class). In one case without published redshift (GRB 081109), the photometric imaging was complemented by low-resolution spectroscopy with FORS2. Public VLT data for known hosts (GRBs 070306 and 070802) were obtained from the ESO archive. Ground-based data were complemented by Swift/UVOT imaging for GRBs 081109 and 100621A. In the case of GRB 080607 all host measurements were taken from Chen et al. (2010, 2011).
4 Data reduction and SED fitting
4.1 Swift/XRT & UVOT data
X-ray data have been retrieved from the HEASARC archive333http://heasarc.gsfc.nasa.gov/cgi-bin/W3Browse/swift.pl, and reduced with the xrtpipeline. Spectra have been grouped to yield a minimum of 20 counts per bin, while the light curve was taken from the Swift/XRT light curve repository (Evans et al. 2007, 2009). Swift/UVOT photometry has been obtained following Poole et al. (2008) and is provided in Table 2.
4.2 Ground-based optical/NIR photometry
All optical (GROND, EFOSC, FORS1/2) and near-infrared (GROND, SOFI, HAWK-I, ISAAC) imaging was reduced in a standard manner using pyraf/IRAF (Tody 1993) similar to the procedure outlined in Krühler et al. (2008). For afterglow and host photometry, point-spread function (PSF) fitting and aperture photometry was used, respectively. The aperture diameter for individual hosts ranges between typically to , corresponding to values between 1.5 to 4 times the PSF FWHM. It has been chosen sufficiently large to include the largest fraction of host flux, and given the typical extent of these galaxies (, i.e., at ), the fraction of missed low-surface brightness emission is very likely not a major contribution to the presented measurements.
PSF and aperture photometry were then flux calibrated against GROND observations of SDSS fields (Abazajian et al. 2009) taken immediately before or after the GRB field for the optical filters. photometry was obtained by creating a set of secondary standards from the GROND photometry of field stars and the color terms from Lupton444http://www.sdss.org/dr7/algorithms/sdssUBVRITransform.html. -band photometry was tied to observations of Landolt standard stars (Landolt 1992) taken during the same night at different airmasses, which allowed a reliable correction of the atmospheric extinction to be applied.
NIR photometry was measured against point sources from the 2MASS catalog (Skrutskie et al. 2006) in the field of view of GROND. The zeropoint for the NIR imagers with smaller field of views (in particular SOFI and ISAAC) was then derived using secondary standards common in the GROND and SOFI/ISAAC/HAWK-I frames. The HAWK-I -band imaging was calibrated against the and measurements from field stars using the color term
where all magnitudes are in the AB system. This color term has been obtained from synthetic photometry of stars with the templates of Pickles (1998) and Chabrier et al. (2000), and yields an rms residual scatter for individual stars of 0.07 mag.
This procedure resulted in typical absolute accuracies of 2-5% for the optical ( to ) filters and 4-8% in the NIR (), which have been added in quadrature to the error introduced by photon noise. All data used in the analysis have been corrected for the expected Galactic foreground extinction according to Schlegel et al. (1998) with . For the selected fields, this correction is small, i.e., in all cases. The uncertainty of order of 10% in the Galactic foreground correction is hence not going to affect the overall results of this work. Ground-based photometric measurements of the afterglows and hosts are shown in Tables 1, 3 and 4, respectively.
| GRB | t [ks] | |||||||
|---|---|---|---|---|---|---|---|---|
| 081109 | 65 | 24.53 | 24.75 | 23.6(4) | 22.8(3) | 21.24(17) | 19.78(11) | 18.83(08) |
| 100621A | 7.6 | 21.56(17) | 19.92(08) | 18.67(06) | 17.71(04) | 16.02(04) | 15.02(05) | 14.32(06) |
Notes: t is the mean time of the observation after the GRB trigger. All magnitudes are in the AB system and uncorrected for Galactic foreground reddening. Values in brackets correspond to photometric errors in units of valid digits. Upper limits are given at 3 confidence.
| Host | ||||
|---|---|---|---|---|
| GRB 081109 | 24.1 | 23.6(3) | 23.4(3) | 22.9 |
| GRB 100621A | 22.31(04) | 22.23(06) | 22.20(07) | 21.95(06) |
Notes: All measurements in the AB system and uncorrected for the Galactic foreground reddening. Values in brackets correspond to photometric errors in in units of valid digits. Upper limits are given at 3 confidence.
| Host | ||||||||
|---|---|---|---|---|---|---|---|---|
| GRB 070306 | — | 22.90(09) | — | 23.08(09) | 23.00(09) | 22.81(13) | — | 22.86(17) |
| GRB 070802 | — | — | — | — | 25.20(09) | 25.5(3) | — | — |
| GRB 080605 | — | 23.15(07) | — | 22.82(07) | — | 22.81(08) | — | 22.76(11) |
| GRB 080805 | — | — | 25.7(2) | — | 25.5(2) | 25.7(4) | — | — |
| GRB 081109 | 23.23(14) | 23.07(07) | 22.85(06) | 22.74(07) | — | 22.01(08) | 21.96(09) | 21.99(09) |
| GRB 090926B | 23.71(13) | 23.31(07) | — | 22.96(06) | — | 22.92(12) | — | 22.44(10) |
| GRB 100621A | 21.95(10) | 21.86(06) | — | 21.48(06) | — | 21.15(06) | — | 21.46(06) |
Notes: All magnitudes in the AB system and uncorrected for the Galactic foreground reddening. Values in brackets correspond to photometric errors in units of valid digits. Upper limits are given at 3 confidence. Data for the host of GRB 080607 were taken from Chen et al. (2010, 2011), and are not shown in the table.
| Host | |||||||
|---|---|---|---|---|---|---|---|
| GRB 070306 | — | 21.9(4) | 21.62(08) | 21.5(4) | 21.20(12) | 21.1 | 21.38(10) |
| GRB 070802 | — | — | 24.5(3) | — | — | — | 23.4(3) |
| GRB 080605 | — | 21.9(2) | — | 22.3(3) | — | 21.1 | — |
| GRB 080805 | — | — | 23.6(2) | — | — | — | 23.1(2) |
| GRB 081109 | 21.63(08) | 21.40(17) | 21.37(06) | 21.5(4) | — | 20.6 | 21.05(08) |
| GRB 090926B | — | 22.3(4) | 21.88(13) | 21.6 | 21.9(3) | 20.9 | 21.44(19) |
| GRB 100621A | 21.10(06) | 21.22(10) | 21.43(06) | 21.18(14) | — | 21.1 | 21.23(11) |
Notes: All measurements are given in the AB system and are uncorrected for the Galactic foreground reddening. Values in brackets correspond to photometric errors in units of valid digits. Upper limits are given at 3 confidence.
4.3 Long-slit spectroscopy
In addition to the photometric observations, the host of GRB 081109 was also observed spectroscopically with the VLT equipped with FORS2. In total s spectra were obtained with the grisms 300 and 300 and a long-slit width of . Acquisition images were taken in the and filter. The spectroscopic data were obtained at airmasses of and seeing of , which results in a line-spread function of approximately nm at nm. The data were reduced using standard procedures in pyraf/IRAF, with the wavelength solution obtained against an HeHgCd arclamp exposures with 25 lines leaving residuals of around nm rms. Flux-calibration was performed against the spectro-photometric standard BPM16274555http://www.eso.org/sci/observing/tools/standards/spectra/bpm16274.html. The wavelength- and flux-calibrated spectrum was corrected for Galactic foreground extinction and renormalized to the available photometry.
4.4 SED fitting
4.4.1 Afterglows
For the afterglow SED analysis, X-ray ( keV) and optical/NIR data were fit together under the assumption that the underlying continuum emission is well represented by synchrotron emission (e.g., Sari et al. 1998; Galama & Wijers 2001; Schady et al. 2007; Rossi et al. 2011a).
Rest-frame soft X-ray photons are absorbed by metals, predominantly -chain elements, while UV over optical to NIR wavelengths are decreasingly affected by dust absorption. Good coverage above 1 keV combined with NIR observations allows for an accurate determination of the continuum, and hence good constraints on the dust abundance (represented by the absorption in the rest-frame, optical -band, ), the extinction law and total metal content (converted into a Hydrogen-equivalent column density assuming solar abundances from Anders & Grevesse 1989) along the line of sight. Specifically, single and broken power-law continua were used, where in the latter case the two power-law slopes and were fixed to yield as expected for the cooling break of synchrotron emission in the slow cooling regime (e.g., Sari et al. 1998; Granot & Sari 2002).
The NIR to X-ray SEDs were fit in X-spec (Arnaud 1996) using extinction laws for the Milky Way (MW), and Small (SMC) and Large (LMC) Magellanic Clouds from Pei (1992). For the GROND photometry, measurements from the time frame indicated in Fig. 2 and 3 were used, where we chose interval II for GRB 100621A due to a better signal-to-noise ratio. Data taken at interval I yield consistent results for and . In the X-ray regime, where spectral changes in the late evolution of an afterglow are typically very moderate or in most cases even completely absent, the full XRT data set with a constant hardness ratio was used to create a time-averaged spectrum. The latter was then rescaled to the flux value at the time of the GROND observations derived from fitting the XRT light-curve with simple afterglow models. The early steep decay of the X-ray light curve and epochs of flaring activity were excluded from the combined spectrum as well as the light-curve fitting.
4.4.2 Hosts
UV/optical/NIR photometry of the hosts of the selected GRBs were analyzed in a standard way using stellar population synthesis (SPS) techniques to convert luminosities into stellar masses (e.g., Bell et al. 2003; Ilbert et al. 2010) within LePhare666http://www.cfht.hawaii.edu/arnouts/LEPHARE. In detail, galaxy templates based on models from Bruzual & Charlot (2003) with a universal IMF (Chabrier 2003) and different ages, star formation histories, extinction laws, reddening values and metallicities were fit to the data. In addition, emission lines are taken into account by converting the de-reddened UV luminosity into a star formation rate, and hence line strengths of Ly-, , , [OII] and [OIII] following Kennicutt (1998) and Ilbert et al. (2009). In particular for vigorously star-forming galaxies such as GRB hosts, this effect is a significant contribution to even broad-band photometry (e.g., Watson et al. 2011) and reaches values of up to (Ilbert et al. 2009). For a direct comparison with results published in the literature (e.g., Fontana et al. 2006; Marchesini et al. 2009; Ilbert et al. 2010, SGL09), the attenuation law from Calzetti et al. (2000) derived for starburst galaxies is used, unless different reddening laws provide a better fit to the host data at 90% confidence. We caution that access to the rest-frame NIR, which is the best tracer of the stellar mass of the galaxy, is somewhat limited for part of the sample. However, all hosts are detected in at least one filter redwards of the 4000 Å break, which allows a reasonable estimate of of a galaxy (e.g., Glazebrook et al. 2004; Ilbert et al. 2009, SGL09).
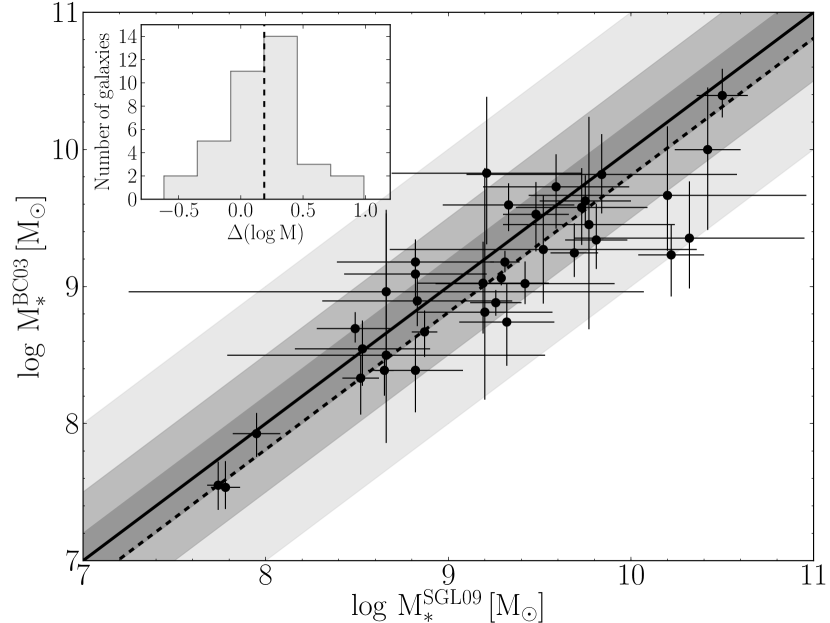
Systematic uncertainties of up to an average of dex on are present due to the specific details of the stellar population models and the assumed attenuation/extinction law (Pozzetti et al. 2007; Küpcü Yoldaş et al. 2007; Kajisawa et al. 2009; Ilbert et al. 2010). Despite the small sample size of GRB hosts, there is evidence for an offset of around 0.2 dex between the presented method and the one of SGL09 as shown in Fig 4. In the following the recalculated stellar masses of the long GRB hosts with the photometric data compiled in SGL09 are used as a comparison sample.
The SPS fit returns not only the luminosity and mass of the galaxy, but also other physical properties of the host, such as the age of the dominant stellar population , its color-excess and the star-formation rate (SFR) derived from the rest-frame UV flux. Reported physical host properties are the median of the probability distribution of the total grid over all galaxy templates at the fixed spectroscopic redshift. Errorbars represent the maximum and minimum value of the respective parameter in the global -distribution of the multi-dimensional parameter grid. Typically, errors are asymmetric and dominated by the uncertainty of the color excess in the host galaxy, which results in logarithmic errors on all galaxy parameters. Absolute magnitudes and masses are compared against the redshift dependent galaxy luminosity functions (Willmer et al. 2006; Marchesini et al. 2007), and stellar mass function (Marchesini et al. 2009; Ilbert et al. 2010)
5 Results
5.1 Afterglow extinction and metals-to-dust ratios
| Afterglow | Redshift(∗) | / d.o.f. | |||||
|---|---|---|---|---|---|---|---|
| [s] | [mag] | ||||||
| GRB 070306 | 1.496 | 210(a) | 1.00 | 123 / 108 | |||
| GRB 070802(b,c) | 2.452 | 16.4(d) | 0.60 | / | / | 15 / 14 | |
| GRB 080605(b,c) | 1.640 | 20(e) | 0.67 | / | / | 428 / 327 | |
| GRB 080607(c,f) | 3.036 | 79(g) | / | / | 70 / 39 | ||
| GRB 080805(b,c) | 1.505 | 78(h) | / | / | 23 / 18 | ||
| GRB 081109 | 0.979 | 190(i) | 1.10 | 48 / 63 | |||
| GRB 090926B(b) | 1.24 | 110(j) | 0.73 | 33 / 31 | |||
| GRB 100621A | 0.542 | 63.6(k) | 0.79 | 138 / 124 |
(∗) Redshifts from Jaunsen et al. (2008), Elíasdóttir et al. (2009), Fynbo et al. (2009a), Fynbo et al. (2009b) and Milvang-Jensen et al. (2010).
(∗∗) is the duration in which the GRB emits from 5% to 95% of its -rays, and is used to discriminate between short and long bursts. Typically, long GRBs have (Kouveliotou et al. 1993). All GRBs in this work are hence unambigously long events.
is tied to in the fitting, and hence has the same error.
Notes: Afterglow measurements were taken from the reference denoted with the superscript in the first line. When two references are given, we quote both values for and , but values for and only from the first one for the sake of clarity.
References: (a) Barthelmy et al. (2007), (b) Greiner et al. (2011), (c) Zafar et al. (2011), (d) Cummings et al. (2007), (e) Cummings et al. (2008), (f) Perley et al. (2011b), (g) Stamatikos et al. (2008), (h) Palmer et al. (2008), (i) Markwardt et al. (2008), (j) Baumgartner et al. (2009), (k) Ukwatta et al. (2010a)
Out of the total of eight afterglows in the sample, the extinction properties for five of them (GRBs 070802, 080605, 080607, 080805, 090926B) are extensively discussed in previous works (Krühler et al. 2008; Elíasdóttir et al. 2009; Perley et al. 2011b; Greiner et al. 2011; Zafar et al. 2011). In these cases, also the published afterglow analysis is comparable to the approach of this work, and it is therefore not repeated here, with results from the literature being summarized in Table 5. For the remaining three events (GRBs 070306, 081109, 100621A), we present either new data and their modeling (GRBs 081109, 100621A), or a new analysis (GRB 070306) in the following.
The afterglow of GRB 070306 was discussed in Jaunsen et al. (2008). As their analysis is significantly different from our approach, we refit the available afterglow data following Sect. 4.4.1. The broad-band SED in Fig. 5 is reasonably well fit ( d.o.f.) with a single power-law continuum with spectral index , an and cm-2 at 90% confidence, which implies a metals-to-dust ratio of cm-2/mag. Given the redshift of , and the sparse wavelength coverage in the NIR (probing the rest-frame optical red-ward of 400 nm, where there is little distinction between local extinction laws), all local dust models provide equally good fits to the data of course, and within errors compatible values of , , and . No strong statements can be made either with respect to a possible presence of a break between NIR and X-ray data. We adopt the model with the least number of free parameters (single power-law continuum, which also yields the lowest ), but note that in the case of a break between the two wavelength regimes (as seen in most early GRB afterglows, Greiner et al. 2011) the fit is of comparable quality (), and yields an best-fit which would be significantly lower (), but within errors consistent with the single power-law values.
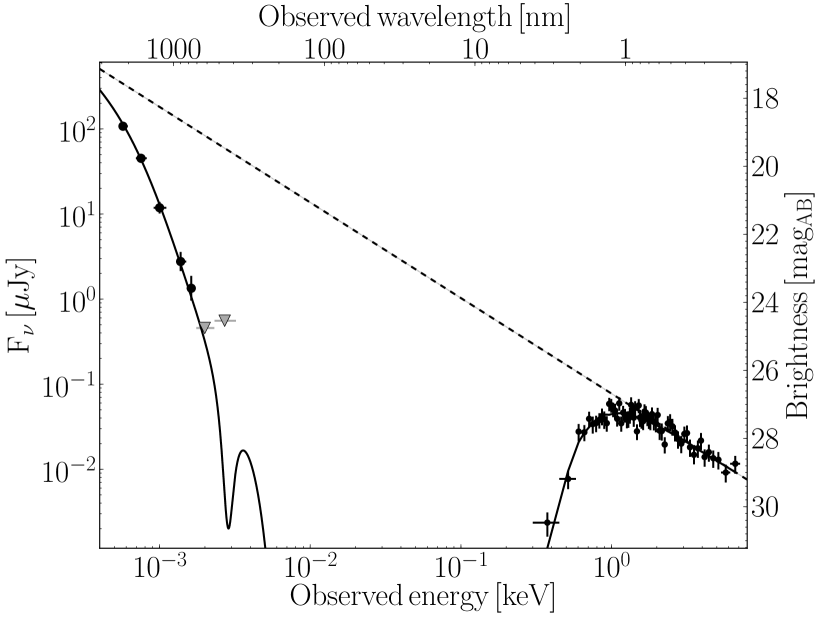
The afterglow SED for GRB 081109 at has been constructed from GROND and Swift data and is shown in Fig. 6. After subtraction of the late host epoch, no residual flux is detected in the two bluest GROND filters and . The afterglow is detected in all five redder bands, which implies an extremely red color of and . The combined GROND and XRT data are well fit with a single power-law continuum, indicating that both the optical/NIR and the X-ray regimes probe the same part of the synchrotron spectrum. The obvious curvature in the GROND data is accuratly described with either of the local dust models, with best-fit parameters of , , and cm-2 at 90% confidence and a of 48.1 for 63 d.o.f. in a MW-like extinction law. SMC and LMC models yield within errors comparable parameters and provide equally good fits to the data (s of 48.2 and 48.8, respectively).
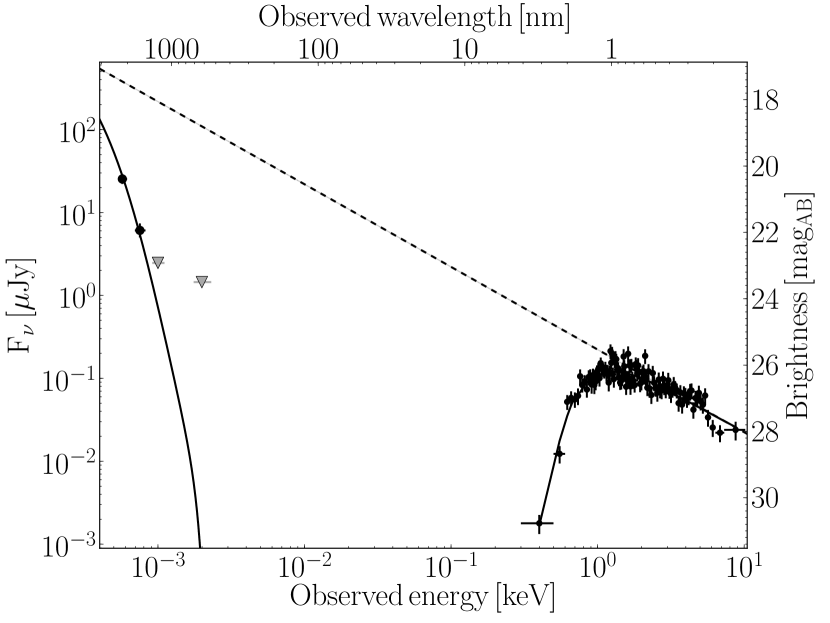
The SED of the afterglow of GRB 100621A at (Milvang-Jensen et al. 2010) is shown in Fig. 7. Similarly to the SED of GRB 081109 there is strong curvature and obvious reddening in the optical/NIR part of the SED. The inferred ultra-red color of 5.8 mag, and the value of 0.39 provide evidence for strong dust extinction. The best fit is obtained with a broken power-law with spectral indices , as well as for an LMC-like extinction law, and cm-2 at 90% confidence ( of 138 for 124 d.o.f.). Given the rest-frame coverage of nm all local dust models return comparable values with values of for an SMC- and for a MW-type extinction law. All data bluewards and including the filter are consistent with this extinction laws, while the -band photometry is somewhat () brighter than the best fit predicts. This could indicate a discrepancy between the details of the specific dust extinction law and local models similar as observed e.g., in GRBs 070802 or 080607 (Elíasdóttir et al. 2009; Perley et al. 2011b).
The visual extinctions for GRBs 070306, 081109 and 100621A are among the largest ever measured directly along GRB sight-lines, and further imply metals-to-dust ratio of cm-2/mag. Compared to previous afterglow measurements, these values are relatively low, and within a factor of 2-3 similar to as observed in the SMC, LMC and MW (see also Sect. 6.4). The results of afterglow SED fitting, as well as values taken from the literature, are summarized in Table 5.

5.2 Host properties
| Host | R.A.(a) | Decl.(a) | Offset(b) | Probability(c) | Instruments(d) | |||
|---|---|---|---|---|---|---|---|---|
| J2000 | J2000 | arcsec | ||||||
| GRB 070306 | 1.496 | 09:52:23.31 | +10:28:55.4 | 0.002 | FGI | |||
| GRB 070802 | 2.452 | 02:27:35.72 | -55:31:39.0 | 0.011 | EFHI | |||
| GRB 080605 | 1.640 | 17:28:30.05 | +04:00:56.0 | 0.002 | G | |||
| GRB 080805 | 1.505 | 20:56:53.43 | -62:26:39.3 | 0.030 | EH | |||
| GRB 081109 | 0.979 | 22:03:09.63 | -54:42:39.9 | 0.002 | EFGHU | |||
| GRB 090926B | 1.24 | 03:05:13.91 | -39:00:22.6 | 0.018 | EFGS | |||
| GRB 100621A | 0.542 | 21:01:13.08 | -51:06:22.2 | 0.0006 | EGHU |
Notes: Redshifts from Jaunsen et al. (2008), Elíasdóttir et al. (2009), Fynbo et al. (2009a), Fynbo et al. (2009b) and Milvang-Jensen et al. (2010). The host of GRB 080607 is not shown in this table. All measurements were directly taken from Chen et al. (2010, 2011)
(a) Host position derived after tying the astrometric solution to the USNO-B1 catalog (Monet et al. 2003). Typical absolute uncertainties are .
(b) Relative offset calculated by registering the host images against astrometric templates derived from afterglow images with a typical precision of 40 mas rms
(d) G is GROND at the 2.2 m MPG/ESO telescope, E/S are EFOSC/SOFI at the NTT, and F/H/I are HAWK-I, FORS1/2 and ISAAC at the VLT, and U UVOT onboard Swift respectively.
| Host | Redshift | MB | Age | SFR | SSFR | L | /Nfilt | ||
|---|---|---|---|---|---|---|---|---|---|
| magAB | Gyr | mag | /yr | yr-1 | |||||
| GRB 070306 | 1.496 | (2) | 11.8/12 | ||||||
| GRB 070802 | 2.452 | (2) | 2.3/4 | ||||||
| GRB 080605 | 1.640 | (2) | 3.3/6 | ||||||
| GRB 080607 | 3.036 | 3.9/5 | |||||||
| GRB 080805 | 1.505 | (2) | 0.3/5 | ||||||
| GRB 081109 | 0.979 | 11.2/14 | |||||||
| GRB 090926B | 1.24 | 7.3/9 | |||||||
| GRB 100621A | 0.542 | 16.5/14 |
5.2.1 The host of GRB 070306
The galaxy hosting the strongly extinguished GRB 070306 at was previously discussed in Jaunsen et al. (2008). In addition to the public VLT imaging data (FORS , ISAAC ), the host of GRB 070306 was observed with GROND ( simultaneously), and its SED (Fig. 8) is further complemented by published and -band data (Jaunsen et al. 2008). The host is bright (), mildly red777We compare GRB host colors against the median color from the SGL09 sample with and shows evidence of a break. The data are well fit with a non-extinguished ()888For galaxies, we use , or to indicate measured attenuation and effective reddening, since these quantities depend for example on the topology of the ISM and galaxy geometry (Pierini et al. 2004), and on galaxy scales are different from the corresponding values of a given extinction law. host template, and yield an absolute AB magnitude of , which, at corresponds to . The stellar mass of puts the galaxy among the most massive hosts compared to the sample of SGL09. The star-formation rate estimate from the rest-frame UV flux is /yr, which gives a specific star formation rate (SSFR = SFR/) of Gyr-1, or growth timescale (i.e., 1/SSFR) of 2 Gyr. The SFR is in reasonable agreement with the one derived from the [OII] emission line (Jaunsen et al. 2008). We note, that the ISAAC -band host image was obtained only 2.5 days after the GRB, and hence very likely contains a significant fraction of afterglow light, explaining the blue color. The physical properties of the host, however, are comparable if fit with or without the ISAAC filter.


5.2.2 The host of GRB 070802
The host of GRB 070802 at was discovered in deep FORS and ISAAC band imaging (Elíasdóttir et al. 2009). The afterglow SED is characterized by a prominent 2175 Å dust feature, and significant dust in the range of (Krühler et al. 2008; Elíasdóttir et al. 2009). To construct the optical/NIR host SED, the host is further observed with EFOSC/NTT in and HAWK-I/VLT in the -band. The galaxy is moderately red () and its SED (Fig. 8) shows a break, but the age of the dominant stellar population is not well constrained by the available data ( 1 Gyr). There is no strong evidence for internal reddening, and the best-fit absolute magnitude is , which is at with . Using the rest-frame UV flux derived from the galaxy model fitting, an estimate for the SFR of /yr, and the SSFR of Gyr-1 can be derived.
5.2.3 The host of GRB 080605
The host of GRB 080605 at was discovered in late GROND follow-up observations of the burst field 22 days after the GRB trigger. The afterglow SED shows evidence for a 2175 Å dust feature, and significant in the range of (Greiner et al. 2011; Zafar et al. 2011), and will be further discussed in Nicuesa et al. (in preparation). The host is bright (), and blue with a flat color, and as estimated from the best fit galaxy model (Fig. 8). The SED fit further yields , which is at , and . The dominant stellar population of the host is young ( Gyr), and there is no evidence for reddening at the level (). The host galaxy is vigorously star-forming with a SFR of /yr and a SSFR of Gyr-1.
5.2.4 The host of GRB 080607
The afterglow of GRB 080607 is heavily reddened (), has a modest 2175 Å dust feature and is characterized by a strong neutral hydrogen absorber with roughly solar metallicity and molecular gas (Prochaska et al. 2009; Perley et al. 2011b). Data from Chen et al. (2011) show a , very red host with a synthetic color of (Fig. 8). The host is well described with an extinguished galaxy template (), and physical parameters of , which is at , , an extinction corrected SFR of /yr, and SSFR of Gyr-1. These values are in good agreement with previously published ones (Chen et al. 2011).
5.2.5 The host of GRB 080805
GRB 080805 had a very red afterglow, where both an SED and spectral analysis showed a large dust column (), and evidence for a 2175 Å dust feature (Fynbo et al. 2009a; Greiner et al. 2011; Zafar et al. 2011). Its host is discovered in late EFOSC/HAWK-I imaging in five filters (, see Fig. 8), is relatively bright () and red (), with best-fit physical parameters of ( at ) and . The remaining galaxy properties are not well constrained by the available data, yielding a limit on the galaxy reddening , an age of the stellar population of Gyr, a SFR of /yr, and SSFR of Gyr-1.
At a distance of 2.5 north-east of the afterglow/host position, there is another , and even redder () galaxy, a plausible candidate for the strong Mg II absorbing system at reported in Fynbo et al. (2009a).
5.2.6 The host of GRB 081109
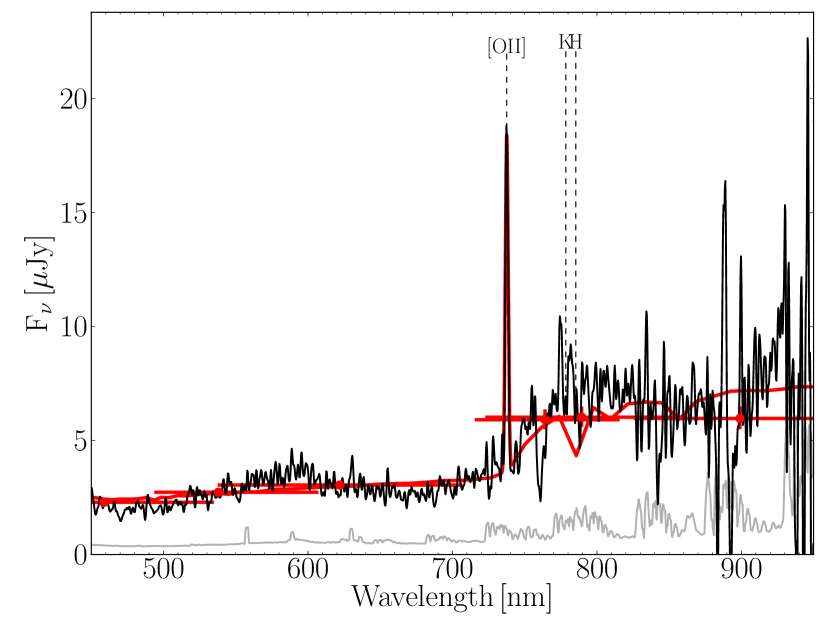
GRB 081109 is the only burst in the sample where no spectroscopic redshift was available in the literature. However, the host is bright (), moderately red () and our host spectrum (see Fig. 9) reveals a single emission line above a well-detected continuum. Within the wavelength coverage of the spectrum ( nm), this emission line is interpreted as [OII][] at . If it were any of the other prominent nebular lines (H, [OIII], H), we would have expected to detect [OII][] in the spectrum as well. At this redshift, there is further spectroscopic evidence for a Balmer break, and a tentative absorption of the Ca II HK doublet (see Fig. 9).
The host SED is shown in Fig. 8 and well fit with a young ( Gyr) and reddened () stellar population. The absolute magnitude of corresponds to at . The stellar mass obtained from the SPS fit is , with a SFR of /yr, which together yields a SSFR of Gyr-1. The emission line flux of [OII][] is , which includes a systematic error contribution from the absolute flux normalization. This corresponds to a dust un-corrected star-formation rate of /yr (Kennicutt 1998), or /yr when using the upper measurement, which is in good agreement with the SFR from the UV continuum.
5.2.7 The host of GRB 090926B
Promptly after the trigger, Fynbo et al. (2009b) reported the detection of the host galaxy of GRB 090926B based on a prominent [OII] emission line in a VLT/FORS spectrum. The host is also imaged in later GROND and NTT observations with a brightness of , and a mildly red color () as shown in Fig. 8. The host SED is well fit with an extinguished host model () with ( at ) and . The SFR based on the extinction corrected UV flux is /yr which is among the highest ever measured from optical data, but not well constrained given the uncertainty on the dust extinction properties. The constraints on the age of the stellar population and SSFR are weak, with values of Gyr and the SSFR of Gyr-1, respectively.
5.2.8 The host of GRB 100621A
The host of GRB 100621A was reported very early after the trigger as a DSS2 source, providing a constant contribution to the afterglow in the UV/blue light curve (Updike et al. 2010; Oates & Ukwatta 2010). In fact, the redshift of of GRB 100621A is based on emission lines from a bright host (Milvang-Jensen et al. 2010). The SED of the mag host is well-sampled from the UV to the NIR and shown in Fig. 8. In strong contrast to the extremely red afterglow mag, the host is blue with an inferred color of and . The SPS host fit returns an intrinsic extinction of for a very young stellar population of age Gyr. This host has the lowest stellar mass in the presented sample with , and an absolute magnitude of , which is at . The SFR and SSFR are /yr and Gyr-1, respectively.
6 Discussion
6.1 Dust reddening in GRB afterglow SEDs
The visual extinction measured from X-ray-to-NIR SED-fitting towards GRBs 070306 (), 081109 () and 100621A () are among the largest ever derived from optical/NIR data for GRB afterglows (e.g., Savaglio et al. 2003; Kann et al. 2006; Greiner et al. 2011). They clearly show that a large dust column can be the dominating feature in a GRB afterglow SED. The dust properties inferred from afterglow measurements are well represented with local models in the rest-frame 300-1100 nm, and at the resolution of broad-band imaging (see also e.g., Fynbo et al. 2001; Watson et al. 2006; Kann et al. 2006; Schady et al. 2007; Starling et al. 2007), while noteworthy exceptions exist in the literature (e.g., Savaglio & Fall 2004; Perley et al. 2010b; Clemens et al. 2011). The good fit provided by local dust extinction laws further suggests an abundance of small dust grains comparable to the MW/LMC or SMC. There is hence no direct evidence that the dust towards these GRBs through their hosts is different than observed along local sight-lines. A different dust grain size distribution would have been expected if the dust were located in the immediate vicinity ( cm) of the GRB and shaped through its intense radiation, i.e., through dust destruction (Waxman & Draine 2000; Fruchter et al. 2001; Draine & Hao 2002). In addition, the metals-to-dust ratios for these afterglows are only a few times the Galactic value of cm-2/mag (Predehl & Schmitt 1995). For un-extinguished GRB sight-lines this ratio is generally found to be a factor of 10-100 times larger than those of the Magellanic Clouds or Milky Way (e.g., Galama & Wijers 2001; Stratta et al. 2004). This is suggestive of a dependence of the metals-to-dust ratio on the amount of visual extinction. We will return to this issue in Sect. 6.4.
6.2 The hosts of the dustiest afterglows
The general properties of the selected GRB host galaxies are diverse. They have colors ranging from flat and blue to extremely red with an average color of , and host extinction values between and . Also, their stellar mass and absolute magnitude distributions are broad, with values between to () and between mag and mag (). These absolute brightnesses are in a range between several tenths to few () as compared to the general field galaxy population at the same redshift. The average SFR and SSFR are about /yr and , respectively. The average growth time is Gyr, which illustrates that not only optically-selected hosts, but also those of highly-reddened afterglows are very efficient in producing stars. A rough estimate on the metallicity of the hosts can be obtained if these GRB hosts follow the fundamental plane as defined from nearby SDSS galaxies (Mannucci et al. 2010a). With a given stellar mass and SFR, the host galaxies in this sample are expected to have metallicities in a range between and , with an average of . We caution that the SFRs were derived using the rest-frame UV flux, which is quite sensitive to the dust extinction properties.
Although not well-constrained in all cases, the average luminosity-weighted effective reddening inferred from host photometry is typically smaller or equal to that measured from afterglow observations. This is not a particularly surprising result, given that the sample selection was based on high visual extinctions of the afterglow SEDs in the first place. It directly indicates some variation in the dust distribution of the hosts, which again is not a surprising result, given the differences in extinction properties along different sight-lines through the diffuse ISM to Giant Molecular Clouds in the Local Group (e.g., Gordon et al. 2003; Fitzpatrick 2004), and the geometrical differences between a single sight-line and an extended distribution of star-light and dust (e.g., Gordon et al. 1997; Silva et al. 1998).
One intriguing case is the host of GRB 100621A. Although having one of the most extinguished afterglows ever detected (even in the presented sample), its host shows very blue colors, and is one of the youngest and the least massive galaxy in this work. This particular example provides evidence for a patchy dust component where the geometry of the dust distribution and not the properties of the host galaxy makes the single GRB sight-line dust-enriched.
6.3 Comparison to previous GRB host samples
One key result of this study is the success rate of the discovery of the selected hosts. Out of eight hosts, which were selected given their afterglow properties (hence a selection independent on host properties, in particular galaxy brightness), all are luminous enough to detect in optical ground-based imaging. This fraction is significantly larger than expected from a host sample based on XRT detections (Fynbo et al. 2008; Malesani et al. 2009). The effect of an increased detection rate is even stronger in the NIR: Seven out of eight are detectable in the -band, while this fraction is only 35% for the general host population of Swift/GRBs (Malesani et al. 2009). Partially, this is the result of the lower average redshift of the selected hosts () as compared to all Swift GRBs with .
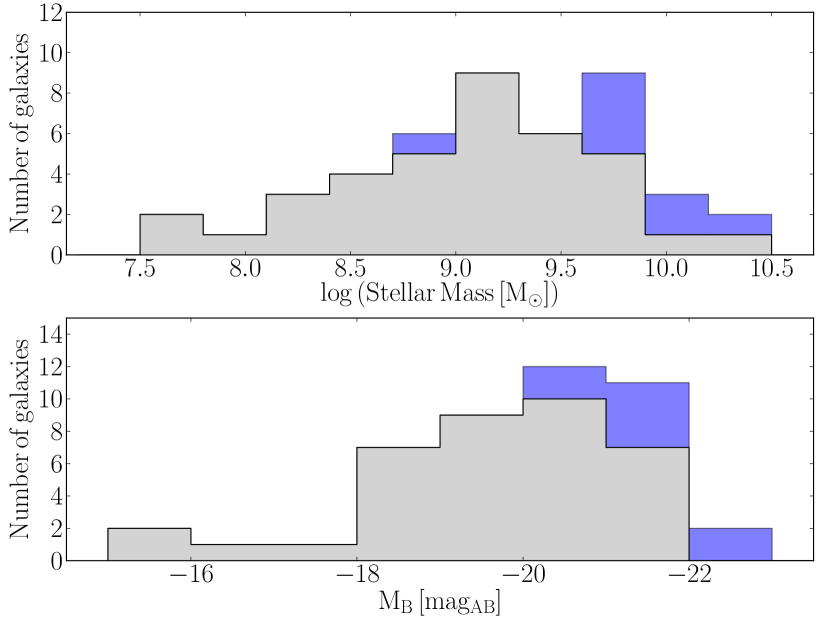
The lower redshift is however not the only reason for the high detection rate. The selected hosts are on average redder and, as shown in Fig. 10, have typically higher luminosities and stellar masses than the (sensitivity-limited) SGL09 sample which has , and . A two-sample K.-S. test returns -values of 0.002 for the stellar mass, and 0.006 for the absolute magnitude distributions respectively, which is tentative evidence that both distributions are not drawn from the same parent sample. However, given the small sample size of only eight high- events, larger samples are required to statistically establish the existence of a difference at higher significance. Of course, both distributions are drawn from the same physical parent sample (GRB hosts), indicating that the different selection criteria probe different host properties.
A possible explanation of the different host properties would be the now on-average higher redshift relative to the SGL09 sample, where star-formation was driven by more massive galaxies as compared to the more nearby Universe (e.g., Cowie et al. 1996; Hopkins 2004). To test this hypothesis, we selected a sub-sample from SGL09 with a median redshift comparable to the hosts in this work. This essentially removes all SGL09 hosts and leaves only 13 events for comparison (see histograms in Fig. 11). Despite the small number statistics, the and values are again placed at the high-mass and high-luminosity end of their respective distribution, and a K.-S. test is also marginally suggestive of a difference (-values of 0.001 and 0.034 for the masses and absolute magnitudes).
We conclude that by selecting extinguished afterglows we are very likely probing a more luminous, massive and chemically-evolved population of GRB hosts.
As it is clear that these were largely missing from previous samples due to their poor localizations, there is a selection bias and the host population is missing most of its massive, evolved and metal-rich members. As a direct consequence, GRB hosts trace the global SFR closer than indicated in studies which are based on host samples of optically selected GRB afterglows, and the apparant deficiency of high-mass host galaxies is at least partially a selection effect.
Similar conclusions apply for all galaxies hosting afterglows that show a significant 2175 Å dust feature in their SED. Four out of five currently known afterglows are within the presented sample, which argues for a direct connection between large dust columns and the presence of the UV bump (see e.g., Greiner et al. 2011; Zafar et al. 2011). Their, on average, more massive and luminous hosts suggest a qualitative relation between the stellar mass of a galaxy and the presence of a 2175 Å feature, where the latter is only present in fairly massive and metal-enriched galaxies (see also e.g., Noll & Pierini 2005). Conversely, a strong 2175 Å feature in an afterglow SED is also very likely a good proxy for the stellar mass and luminosity of the GRB host.
6.4 Metals-to-dust ratios in context
The ratio between the line-of-sight extinction and the total metal column for GRB afterglows has been investigated in a number of papers (e.g., Galama & Wijers 2001; Stratta et al. 2004; Savaglio & Fall 2004; Kann et al. 2006; Schady et al. 2007, 2010; Greiner et al. 2011; Zafar et al. 2011) where ratios typically much higher than the ones observed in the Local Group were derived. Measurements for different Galactic sight-lines (e.g., Predehl & Schmitt 1995; Güver & Özel 2009) show an almost universal value of around cm-2/mag, while the matter probed by afterglows can yield metals-to-dust ratios up to and sometimes even above -times higher (e.g., Watson et al. 2007; Rau et al. 2010).
6.4.1 An anti-correlation between metals-to-dust ratio and sight-line extinction
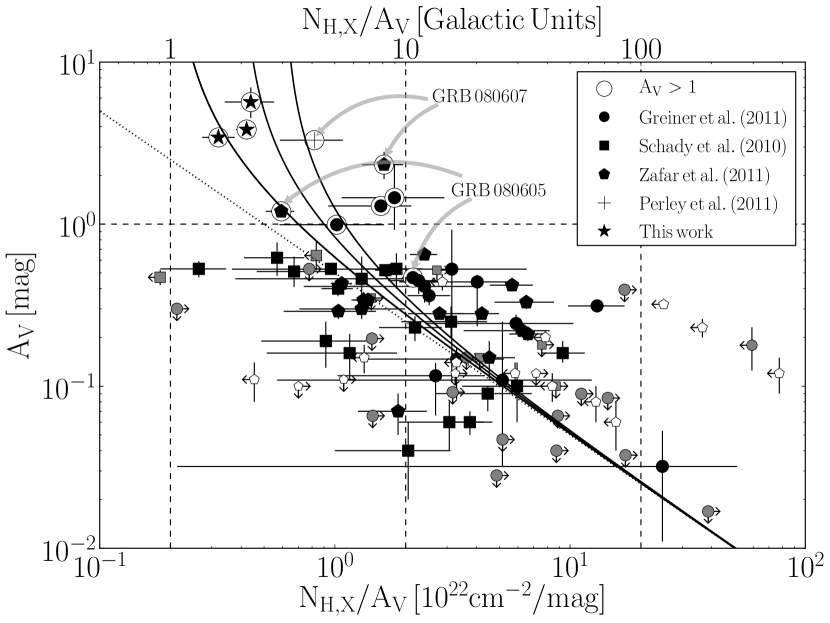
Figure 12 shows the ratio for a large number of afterglows and illustrates its dependence on the sight-line dust extinction. With the afterglows in this work, there is now for the first time reasonable coverage in the range. Intriguingly, the metals-to-dust ratio is strongly anti-correlated with , confirming the tentative trend reported by Perley et al. (2009). A Spearman rank-order correlation analysis for the combined sample in Figure 12 returns a correlation coefficient , with a two-tailed -value of , in strong contrast to a constant, universal ratio.
There are two straight forward ways to reconcile this result: One is a dependence of the metals-to-dust ratio on the specific environment such that evolved and dust-enriched hosts are more efficient in forming dust out of their metals (and in fact we do observe on average larger stellar masses for the hosts of high afterglows). The other is the presence of two physically independent absorbers, where the first dominates the total metal column, the other the visual extinction measurements. This trivially produces a non-correlation between and , and consequently an to anti-correlation.
Some outliers of the metals-to-dust anti-correlation (Fig. 12) might be explained with difficulties of measuring the respective physical parameters. This is also illustrated by the example of two individual events (GRBs 080605 and 080607) where different values have been published in the literature. Assumptions on the continuum emission and the extinction law, notably the total-to-selective reddening , but also its parametrization can affect the measurement. In addition, there is the possibility that the cooling break is located close to or within the range of the UV/optical/NIR measurements. In a standard analysis, the introduced curvature caused by the spectral break is then interpreted as an increased dust column (Krühler et al. 2011). The measurements are prone to errors as well: spectral variation intrinsic to the afterglow can lead to wrong estimates on the soft X-ray absorption (e.g., Butler & Kocevski 2007).
6.4.2 Metals-to-dust ratio compared to host mass
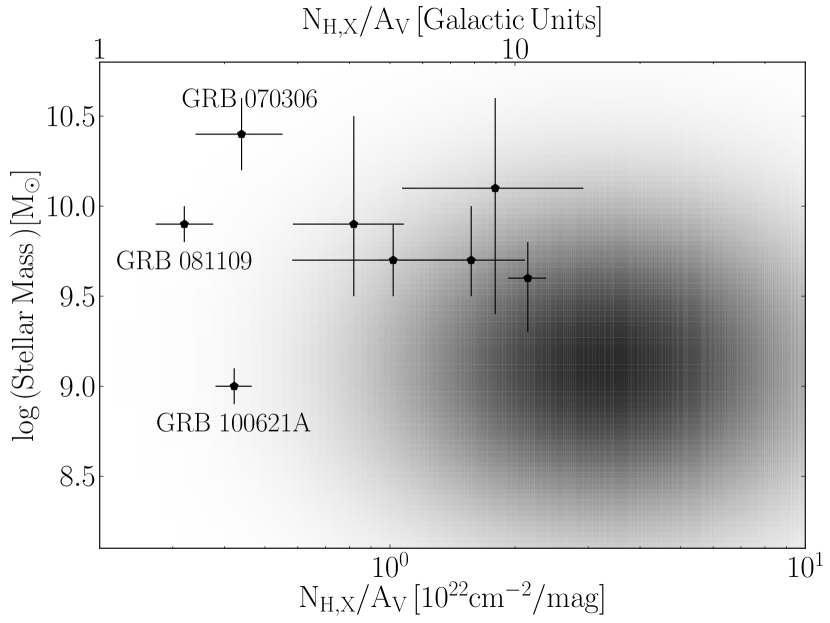
As shown in Sect. 6.2, the hosts of dusty afterglows are on average more massive and luminous than their non-extinguished counterparts, but there is a broad range of galaxy properties and the only common feature between all afterglows/hosts in this work is hence the dusty line of sight. In particular, if the environment were responsible for the observed to visual extinction anti-correlation, we would expect the metals-to-dust ratio for GRB 100621A to be comparable to the bulk of optically bright afterglows. It is, however, one of the lowest ever observed for GRB afterglows and a factor of 5 lower than the median for afterglows with hosts of similar mass (see Fig. 13). Although we note that number counts are still too low to derive strong constraints with high statistical significance, this suggests that the specific host environment is not responsible for the observed dependence on the metals-to-dust ratio to the visual extinction.
6.4.3 A system of two absorbers
In the second scenario, two to first order physically independent (one neutral, host-galaxy related, one ionized, circumburst specific) columns of material contribute to the observed absorption, denoted as , in the following. measures the sum of both, whereas the column would only be associated with the absorber. Such a circumburst environment is not unexpected: The intense afterglow radiation should not only photo-ionize the vicinity of the burst, but also destroy the associated dust to large amounts (Waxman & Draine 2000; Draine & Hao 2002; Perna et al. 2003), albeit with different effective radii.
For sight-lines, directly results in a large metals-to-dust ratio. With an increasing column of around , the absorber contributes significantly to the total metal column (): this is illustrated in Fig. 12 by the solid lines, where the ratio asymptotically reaches 1, 2 or 3 times the Local Group value. Even larger columns than present in this work can test this hypothesis. For an sight-line, for example, is much larger than and the expected metals-to-dust ratio would be comparable to its intrinsic value, and to the Local Group value (if universal).
For the bulk of standard, un- or mildly extinguished afterglows, the large column of ionized metals with an equivalent cm-2 in the circumburst material dominates the total measurement, whereas the visual extinction is very likely caused by dust further out, either in the diffuse ISM, or localized in interstellar clouds (see also Sect. 6.5). Hence, for optically bright GRBs the total metal absorption as probed by the soft X-ray absorption is neither a good measure nor a direct tracer of the dust extinction along the line of sight. Or, in other words, an column even as large as cm-2 does not necessarily imply a significant visual extinction (see also, e.g., Galama & Wijers 2001; Kann et al. 2006; Schady et al. 2007).
Also, the shape of the extinction law, which is typically consistent with sight-lines through galaxies of the Local Group argues against an association of the absorbing dust with the immediate vicinity of the burst. The steepness of the UV rise of the extinction law as probed by GRB afterglows is comparable to the one of the LMC (Schady et al. 2011b), generally suggestive of an abundance of small dust grains. These grains, however, are expected to be destroyed first and the grain-size distribution function would be skewed to larger grains. This would result in flat, or grey extinction properties, in contrast to the ultra-red afterglows of GRB 081109, or GRB 100621A, for example.
We thus conclude that the anti-correlation between metals-to-dust ratio and sight-line extinction indicates the presence of two absorbing systems, which are to first order physically independent. One of them is dusty, the other ionized and dust-free, where the former is probed by the optical/NIR data and the latter typically dominates the measurement.
6.5 Location and geometry of the absorbing dust column
A natural question about the nature of the absorbing dust, gas and metal columns detected in the afterglow SEDs and spectra is their locations, and if they are directly related to the burst environment. A number of previous studies have already revealed some clues about the geometry of the absorbing matter, which have been derived quite exclusively from sight-lines with low total dust content: The distance of the cold-neutral material, linked to the DLA and the low-ionization metal absorption lines has been constrained to few hundreds of pc to few kpc (Prochaska et al. 2006; Vreeswijk et al. 2007). In contrast, the high metal column densities as derived from soft X-ray absorption were associated with a fully ionized circumburst medium up to few to several tens of pc (Watson et al. 2007; Schady et al. 2011a). For bursts with largely unextinguished afterglows, most of the metals along the sight-line are typically in a highly ionized state and only 10% of the absorbing gas is neutral (Schady et al. 2011a). In addition, there is no statistically significant correlation between the soft X-ray absorption and the dust column as inferred from optical/NIR data nor the metallicity of the neutral material (e.g., Schady et al. 2007; Zafar et al. 2011), nor the darkness of a GRB (Campana et al. 2010). There is however a trend of higher visual extinctions with larger neutral metal columns, an anti-correlation between gas-to-dust ratio and metallicity (Zafar et al. 2011), and dark bursts have stronger neutral metal absorption lines in their optical spectrum (Christensen et al. 2011).
The dustiest afterglows and their hosts add two further hints. Firstly, there is the previously discussed anti-correlation between metals-to-dust ratio and sight-line extinction, albeit with a large scatter for individual events. And secondly, their hosts are on average redder, more luminous and massive, and supposedly also more evolved, dust- and metal-rich than their low- counterparts (e.g., Kobulnicky & Kewley 2004; Savaglio et al. 2005). There is hence a relation between the dust along the sight-line towards the GRB and physical host properties. Such a relation is expected if the dust probed by the afterglow is located at large enough distances to be fairly representative of the size of the host galaxy, its global dust enrichment and chemical state. In contrast, dust in the surrounding environment of a GRB, even if present and able to survive the intense afterglow or progenitor radiation, would rather be related to the very specific details of its circumburst environment or the GRB’s birth cloud.
An overlap with optically selected hosts clearly exist: very young, blue and low-mass galaxies possess sight-lines through dusty regions as demonstrated through the afterglows and hosts of, e.g., GRBs 080605 and 100621A. For this kind of events the data are clearly not consistent with a uniform dust-shield. In a few cases the observations rather indicate a patchy dust distribution where the dust is located in clumps of small enough covering factor and large enough extinction to be negligible in the integrated host light distribution. The variations on the visual extinction in some cases are therefore a geometrical effect (see also, e.g., Berger et al. 2003; Perley et al. 2009).
This raises questions about the validity of star-formation estimates obtained for young and blue galaxies. Afterglow observations show that there is extinguished star-formation ongoing even in apparently unextinguished galaxies. Here, either the covering factor of the dusty clump is just too small to remove significantly from the host light, or the clump completely absorbs all UV light from the star-forming region, thus having a negligible effect on the host galaxy colors. In the latter case, the UV-derived SFRs would strictly represent lower limits on the ongoing star-formation in these galaxies. Far-infrared and sub-mm observations with and ALMA, respectively, would enable to measure the galaxies SFR, dust mass and temperature and would help to clarify this issue.
A coherent picture of highly extinguished afterglows in combination with their diverse, but on average redder and more massive hosts could be obtained within a complex dust distribution made out of several constituents related to extinction in the diffuse ISM, extended interstellar clouds, or localized in fairly compact and dense regions such as giant molecular clouds.
The dust extinction is hence very likely not directly associated with the GRB environment but plausibly with the neutral absorber at distances of a few hundred pc to one kpc. We stress, however, that the effective radii of dust destruction and photo-ionization will shape the detailed gas-to-dust and metals-to-dust ratios, adding further complexity to the absorbing system(s) in front of GRB afterglows. Furthermore, the dust distribution in high- galaxies could be even more complex due to dusty galaxy outflows, and reflect the absence of a uniform chemical enrichment on scales up to one kpc (e.g., Noll et al. 2009).
7 Conclusions
The afterglows of GRBs 081109 () and 100621A () join the growing sample of highly extinguished events. Their continuum emission is well-constrained by the combination of X-ray and NIR data, and the optical observations provide a detailed measurement of the dust properties along the sight-lines. While some diversity in their extinction properties, particularly dust abundance, clearly exists, GRBs 081109 and 100621A provide compelling evidence that a highly obscured afterglow is also a highly reddened one, and that extinction laws derived from local sight-lines accurately estimate the dust properties towards even highly extinguished GRBs.
Having a large enough sample of coeval afterglows with multi-wavelength data would ideally enable to advance from single sight-line, pencil beam investigations to a statistically symmetric geometry where each GRB afterglow represents a different sight-line through its host galaxy. In analogy to the case studied by Witt & Gordon (1996), this could provide a good description of the structure and evolution of the absorbing medium and help constrain the opacity and filling factors of the dust geometry and clumps from the distribution of values in star-forming galaxies out to very high redshift.
The hosts of the dustiest afterglows provide a different picture of GRB host galaxies compared to the hosts of optically-selected bursts. Although both samples are overlapping in their properties, the galaxies in this work have typical luminosities of around and stellar masses of , more luminous and massive when compared to the hitherto discovered faint and blue hosts. Although the number counts are still low, this work indicates that a selection based on a large picks up preferentially the more massive and chemically-evolved GRB hosts, which is in qualitative agreement with searches for dark GRB hosts (Perley et al. 2010a, 2011a; Rossi et al. 2011b).
This suggests that the properties of complete GRB host samples are diverse, and complex selection biases are still present: not only are the very faintest GRB hosts missing due to inherent sensitivity limits, but also some of the brightest, most luminous, and chemically evolved ones, because they have not been localized accurately enough. Fairly large and massive, dusty, and metal-rich galaxies are able to host GRBs, and the trend of low-metallicity GRB hosts is not as significant as claimed in previous studies, and possibly a selection effect of the young galaxy population dominating the global SFR at low- (e.g., Berger et al. 2007; Mannucci et al. 2010b). This has substantial implications for the feasibility of tracing the star-formation history with GRB hosts and also for the progenitor channels of GRB production as a result of their metallicity dependence. In the former case, this work indeed indicates that the deficiency of high-mass GRB host galaxies in previous studies was at least partially due to a selection bias. The latter case, however, depends quite strongly on the assumption that the host-inferred metallicities are representative of the composition of the progenitor star, while different sight-lines through a GRB host can show a dispersion in metallicity of around a factor 100 (Pontzen et al. 2010).
Intriguingly, all GRBs with have metals-to-dust ratios significantly below what is typically measured for GRB afterglows, and more in line with measurements from the Local Group. In addition, there is a strong anti-correlation between the metals-to-dust ratio and the visual extinction along the GRB sight-line. This effect seems independent on the specific host properties and can be interpreted as evidence of two physically independent absorbers: dust-free, ionized metals in the circumburst environment (and probed by soft X-ray absorption), and in contrast a dusty absorber further out (and probed by reddening measurements in the UV/optical/NIR).
A dust column independent of the immediate circumburst environment is further supported by the relation between afterglow and host properties, in particular the on-average higher stellar mass and redder colors. Coupled with the blue and very young hosts of, e.g., GRBs 080605 or 100621A it indicates a complex dust geometry with different constituents in the diffuse ISM and in localized patches, which are plausibly associated with the cold-neutral absorber detected in rest-frame UV/optical spectra.
Further advances can now be made by getting direct observational access to more dusty sight-lines including events at an increasing redshift interval. Similar observations for a large enough sample would investigate the dependence of the global dust enrichment with cosmic evolution, and constrain the fraction of dust-enshrouded star-formation out to very high redshifts. A sophisticated observational strategy coupled with state-of-the-art instrumentation makes such a challenging study feasible: A rapid response of the order of several minutes by a NIR imager at an 8m-class telescope would have enabled the detection of the afterglows of GRB 100621A () up to , GRB 081109 () up to , and GRB 070802 () up to , which subsequently could have been followed-up using NIR spectroscopy. Once an accurate localization as well as detailed information about the GRB sight-line is available, their hosts should be readily accessible for multi-wavelength surveys via large ground- and space-based facilities, yielding information about otherwise fully extinguished environments and unprecedented insights into the conditions of star-forming galaxies throughout the Universe.
Acknowledgements.
We thank the referee for valuable comments. TK acknowledges support by the DFG cluster of excellence ’Origin and Structure of the Universe’ and support by the European Commission under the Marie Curie IEF Programme in FP7. Part of the funding for GROND (both hardware as well as personnel) was generously granted from the Leibniz-Prize to Prof. G. Hasinger (DFG grant HA 1850/28-1). The Dark Cosmology Centre is funded by the Danish National Research Foundation. PS acknowledges support by DFG grant SA 2001/1-1. SS acknowledges support through project M.FE.A.Ext 00003 of the MPG. SK, DAK & ANG acknowledge support by DFG grant Kl 766/16-1. ARo acknowledges support from the BLANCEFLOR Boncompagni-Ludovisi, née Bildt foundation. SMB acknowledges support of a European Union Marie Curie European Reintegration Grant within the 7th Program under contract number PERG04-GA-2008-239176. This work made use of data supplied by the UK Swift Science Data Centre at the University of Leicester.References
- Abazajian et al. (2009) Abazajian, K. N., Adelman-McCarthy, J. K., Agüeros, M. A., et al. 2009, ApJS, 182, 543
- Adelberger & Steidel (2000) Adelberger, K. L. & Steidel, C. C. 2000, ApJ, 544, 218
- Anders & Grevesse (1989) Anders, E. & Grevesse, N. 1989, Geochim. Cosmochim. Acta., 53, 197
- Arnaud (1996) Arnaud, K. A. 1996, in Astronomical Society of the Pacific Conference Series, Vol. 101, Astronomical Data Analysis Software and Systems V, ed. G. H. Jacoby & J. Barnes, 17
- Barthelmy et al. (2007) Barthelmy, S. D., Barbier, L., Cummings, J., et al. 2007, GCN, 6173
- Baumgartner et al. (2009) Baumgartner, W. H., Barthelmy, S. D., Cummings, J. R., et al. 2009, GCN, 9939
- Beardmore et al. (2008) Beardmore, A. P., Page, K. L., & Immler, S. 2008, GCN, 8506
- Bell et al. (2003) Bell, E. F., McIntosh, D. H., Katz, N., & Weinberg, M. D. 2003, ApJS, 149, 289
- Berger et al. (2003) Berger, E., Cowie, L. L., Kulkarni, S. R., et al. 2003, ApJ, 588, 99
- Berger et al. (2007) Berger, E., Fox, D. B., Kulkarni, S. R., Frail, D. A., & Djorgovski, S. G. 2007, ApJ, 660, 504
- Bloom et al. (1998) Bloom, J. S., Djorgovski, S. G., Kulkarni, S. R., & Frail, D. A. 1998, ApJ, 507, L25
- Bloom et al. (2002) Bloom, J. S., Kulkarni, S. R., & Djorgovski, S. G. 2002, AJ, 123, 1111
- Bruzual & Charlot (2003) Bruzual, G. & Charlot, S. 2003, MNRAS, 344, 1000
- Butler & Kocevski (2007) Butler, N. R. & Kocevski, D. 2007, ApJ, 663, 407
- Calzetti et al. (2000) Calzetti, D., Armus, L., Bohlin, R. C., et al. 2000, ApJ, 533, 682
- Campana et al. (2010) Campana, S., Thöne, C. C., de Ugarte Postigo, A., et al. 2010, MNRAS, 402, 2429
- Cenko et al. (2009) Cenko, S. B., Kelemen, J., Harrison, F. A., et al. 2009, ApJ, 693, 1484
- Chabrier (2003) Chabrier, G. 2003, PASP, 115, 763
- Chabrier et al. (2000) Chabrier, G., Baraffe, I., Allard, F., & Hauschildt, P. 2000, ApJ, 542, 464
- Chapman et al. (2005) Chapman, S. C., Blain, A. W., Smail, I., & Ivison, R. J. 2005, ApJ, 622, 772
- Chen et al. (2010) Chen, H., Perley, D. A., Wilson, C. D., et al. 2010, ApJ, 723, L218
- Chen et al. (2011) Chen, H., Perley, D. A., Wilson, C. D., et al. 2011, ApJ, 727, L53
- Christensen et al. (2011) Christensen, L., Fynbo, J. P. U., Prochaska, J. X., et al. 2011, ApJ, 727, 73
- Christensen et al. (2004) Christensen, L., Hjorth, J., & Gorosabel, J. 2004, A&A, 425, 913
- Clemens et al. (2011) Clemens, C., Greiner, J., Krühler, T., et al. 2011, A&A, 529, A110
- Clemens et al. (2008a) Clemens, C., Kruehler, T., & Greiner, J. 2008a, GCN, 8515
- Clemens et al. (2008b) Clemens, C., Kruehler, T., Greiner, J., & Szokoly, G. 2008b, GCN, 8510
- Cool et al. (2007) Cool, R. J., Eisenstein, D. J., Hogg, D. W., et al. 2007, GCN, 6170
- Cowie et al. (1996) Cowie, L. L., Songaila, A., Hu, E. M., & Cohen, J. G. 1996, AJ, 112, 839
- Cucchiara et al. (2011) Cucchiara, A., Levan, A. J., Fox, D. B., et al. 2011, ApJ, 736, 7
- Cummings et al. (2007) Cummings, J., Barbier, L., Barthelmy, S. D., et al. 2007, GCN, 6699
- Cummings et al. (2008) Cummings, J., Barthelmy, S. D., Baumgartner, W., et al. 2008, GCN, 7841
- D’Avanzo et al. (2008) D’Avanzo, P., Covino, S., Antonelli, L. A., et al. 2008, GCN, 8501
- Draine & Hao (2002) Draine, B. T. & Hao, L. 2002, ApJ, 569, 780
- Elíasdóttir et al. (2009) Elíasdóttir, Á., Fynbo, J. P. U., Hjorth, J., et al. 2009, ApJ, 697, 1725
- Evans et al. (2009) Evans, P. A., Beardmore, A. P., Page, K. L., et al. 2009, MNRAS, 397, 1177
- Evans et al. (2007) Evans, P. A., Beardmore, A. P., Page, K. L., et al. 2007, A&A, 469, 379
- Filgas et al. (2011) Filgas, R., Krühler, T., Greiner, J., et al. 2011, A&A, 526, A113
- Fitzpatrick (2004) Fitzpatrick, E. L. 2004, in ASPC Conf. Ser., Vol. 309, Astrophysics of Dust, ed. A. N. Witt, G. C. Clayton, & B. T. Draine, 33
- Fontana et al. (2006) Fontana, A., Salimbeni, S., Grazian, A., et al. 2006, A&A, 459, 745
- Fruchter et al. (2001) Fruchter, A., Krolik, J. H., & Rhoads, J. E. 2001, ApJ, 563, 597
- Fruchter et al. (2006) Fruchter, A. S., Levan, A. J., Strolger, L., et al. 2006, Nature, 441, 463
- Fryer et al. (2007) Fryer, C. L., Mazzali, P. A., Prochaska, J., et al. 2007, PASP, 119, 1211
- Fryer et al. (1999) Fryer, C. L., Woosley, S. E., & Hartmann, D. H. 1999, ApJ, 526, 152
- Fynbo et al. (2008) Fynbo, J. P. U., Hjorth, J., Malesani, D., et al. 2008, in The Eleventh Marcel Grossmann Meeting, ed. H. Kleinert, R. T. Jantzen, & E. Ruffini , 726–735
- Fynbo et al. (2003) Fynbo, J. P. U., Jakobsson, P., Möller, P., et al. 2003, A&A, 406, L63
- Fynbo et al. (2009a) Fynbo, J. P. U., Jakobsson, P., Prochaska, J. X., et al. 2009a, ApJS, 185, 526
- Fynbo et al. (2001) Fynbo, J. P. U., Jensen, B. L., Gorosabel, J., et al. 2001, A&A, 369, 373
- Fynbo et al. (2009b) Fynbo, J. P. U., Malesani, D., Jakobsson, P., & D’Elia, V. 2009b, GCN, 9947
- Galama et al. (1998) Galama, T. J., Vreeswijk, P. M., van Paradijs, J., et al. 1998, Nature, 395, 670
- Galama & Wijers (2001) Galama, T. J. & Wijers, R. A. M. J. 2001, ApJ, 549, L209
- Gehrels et al. (2004) Gehrels, N., Chincarini, G., Giommi, P., et al. 2004, ApJ, 611, 1005
- Gehrels et al. (2009) Gehrels, N., Ramirez-Ruiz, E., & Fox, D. B. 2009, ARA&A, 47, 567
- Ghisellini et al. (2009) Ghisellini, G., Nardini, M., Ghirlanda, G., & Celotti, A. 2009, MNRAS, 393, 253
- Glazebrook et al. (2004) Glazebrook, K., Abraham, R. G., McCarthy, P. J., et al. 2004, Nature, 430, 181
- Gordon et al. (1997) Gordon, K. D., Calzetti, D., & Witt, A. N. 1997, ApJ, 487, 625
- Gordon et al. (2003) Gordon, K. D., Clayton, G. C., Misselt, K. A., Landolt, A. U., & Wolff, M. J. 2003, ApJ, 594, 279
- Granot & Sari (2002) Granot, J. & Sari, R. 2002, ApJ, 568, 820
- Greiner et al. (2008) Greiner, J., Bornemann, W., Clemens, C., et al. 2008, PASP, 120, 405
- Greiner et al. (2009) Greiner, J., Krühler, T., Fynbo, J. P. U., et al. 2009, ApJ, 693, 1610
- Greiner et al. (2011) Greiner, J., Krühler, T., Klose, S., et al. 2011, A&A, 526, A30
- Groot et al. (1998) Groot, P. J., Galama, T. J., van Paradijs, J., et al. 1998, ApJ, 493, L27
- Guidorzi et al. (2011) Guidorzi, C., Kobayashi, S., Perley, D. A., et al. 2011, arXiv:1105.1591
- Güver & Özel (2009) Güver, T. & Özel, F. 2009, MNRAS, 400, 2050
- Hashimoto et al. (2010) Hashimoto, T., Ohta, K., Aoki, K., et al. 2010, ApJ, 719, 378
- Hjorth et al. (2003) Hjorth, J., Sollerman, J., Møller, P., et al. 2003, Nature, 423, 847
- Hopkins (2004) Hopkins, A. M. 2004, ApJ, 615, 209
- Ilbert et al. (2009) Ilbert, O., Capak, P., Salvato, M., et al. 2009, ApJ, 690, 1236
- Ilbert et al. (2010) Ilbert, O., Salvato, M., Le Floc’h, E., et al. 2010, ApJ, 709, 644
- Immler et al. (2008) Immler, S., Beardmore, A. P., Cummings, J. R., et al. 2008, GCN, 8500
- Jakobsson et al. (2004) Jakobsson, P., Hjorth, J., Fynbo, J. P. U., et al. 2004, ApJ, 617, L21
- Jaunsen et al. (2008) Jaunsen, A. O., Rol, E., Watson, D. J., et al. 2008, ApJ, 681, 453
- Jin et al. (2009) Jin, Z. P., Xu, D., Covino, S., et al. 2009, MNRAS, 400, 1829
- Kajisawa et al. (2009) Kajisawa, M., Ichikawa, T., Tanaka, I., et al. 2009, ApJ, 702, 1393
- Kann et al. (2006) Kann, D. A., Klose, S., & Zeh, A. 2006, ApJ, 641, 993
- Kann et al. (2011) Kann, D. A., Klose, S., Zhang, B., et al. 2011, ApJ, 734, 96
- Kann et al. (2010) Kann, D. A., Klose, S., Zhang, B., et al. 2010, ApJ, 720, 1513
- Kennicutt (1998) Kennicutt, Jr., R. C. 1998, ARA&A, 36, 189
- Klose et al. (2003) Klose, S., Henden, A. A., Greiner, J., et al. 2003, ApJ, 592, 1025
- Klose et al. (2000) Klose, S., Stecklum, B., Masetti, N., et al. 2000, ApJ, 545, 271
- Kobulnicky & Kewley (2004) Kobulnicky, H. A. & Kewley, L. J. 2004, ApJ, 617, 240
- Kocevski et al. (2009) Kocevski, D., West, A. A., & Modjaz, M. 2009, ApJ, 702, 377
- Kouveliotou et al. (1993) Kouveliotou, C., Meegan, C. A., Fishman, G. J., et al. 1993, ApJ, 413, L101
- Krühler et al. (2009) Krühler, T., Greiner, J., McBreen, S., et al. 2009, ApJ, 697, 758
- Krühler et al. (2008) Krühler, T., Küpcü Yoldaş, A., Greiner, J., et al. 2008, ApJ, 685, 376
- Krühler et al. (2011) Krühler, T., Schady, P., Greiner, J., et al. 2011, A&A, 526, A153
- Kuin & Immler (2008) Kuin, N. P. M. & Immler, S. 2008, GCN, 8523
- Küpcü Yoldaş et al. (2010) Küpcü Yoldaş, A., Greiner, J., Klose, S., Krühler, T., & Savaglio, S. 2010, A&A, 515, L2
- Küpcü Yoldaş et al. (2007) Küpcü Yoldaş, A., Salvato, M., Greiner, J., et al. 2007, A&A, 463, 893
- Landolt (1992) Landolt, A. U. 1992, AJ, 104, 340
- Le Floc’h et al. (2003) Le Floc’h, E., Duc, P., Mirabel, I. F., et al. 2003, A&A, 400, 499
- Levan et al. (2006) Levan, A., Fruchter, A., Rhoads, J., et al. 2006, ApJ, 647, 471
- Levesque et al. (2010) Levesque, E. M., Kewley, L. J., Graham, J. F., & Fruchter, A. S. 2010, ApJ, 712, L26
- MacFadyen & Woosley (1999) MacFadyen, A. I. & Woosley, S. E. 1999, ApJ, 524, 262
- Malesani et al. (2009) Malesani, D., Hjorth, J., Fynbo, J. P. U., et al. 2009, in AIPC Ser., Vol. 1111, AIPC Ser., ed. G. Giobbi, et al., 513–519
- Mannucci et al. (2010a) Mannucci, F., Cresci, G., Maiolino, R., Marconi, A., & Gnerucci, A. 2010a, MNRAS, 408, 2115
- Mannucci et al. (2010b) Mannucci, F., Salvaterra, R., & Campisi, M. A. 2010b, MNRAS, in press, arXiv:1011.4506
- Marchesini et al. (2007) Marchesini, D., van Dokkum, P., Quadri, R., et al. 2007, ApJ, 656, 42
- Marchesini et al. (2009) Marchesini, D., van Dokkum, P. G., Förster Schreiber, N. M., et al. 2009, ApJ, 701, 1765
- Markwardt et al. (2008) Markwardt, C. B., Barthelmy, S. D., Baumgartner, W. H., et al. 2008, GCN, 8507
- Milvang-Jensen et al. (2010) Milvang-Jensen, B., Goldoni, P., Tanvir, N. R., et al. 2010, GCN, 10876
- Mokiem et al. (2007) Mokiem, M. R., de Koter, A., Vink, J. S., et al. 2007, A&A, 473, 603
- Monet et al. (2003) Monet, D. G., Levine, S. E., Canzian, B., et al. 2003, AJ, 125, 984
- Naito et al. (2010) Naito, H., Sako, T., Suzuki, D., et al. 2010, GCN, 10881
- Nardini et al. (2010) Nardini, M., Ghisellini, G., Ghirlanda, G., & Celotti, A. 2010, MNRAS, 403, 1131
- Nardini et al. (2011) Nardini, M., Greiner, J., Krúhler, T., et al. 2011, A&A in press, arXiv:1105.0917
- Noll & Pierini (2005) Noll, S. & Pierini, D. 2005, A&A, 444, 137
- Noll et al. (2009) Noll, S., Pierini, D., Cimatti, A., et al. 2009, A&A, 499, 69
- Oates et al. (2011) Oates, S. R., Page, M. J., Schady, P., et al. 2011, MNRAS, 412, 561
- Oates & Ukwatta (2010) Oates, S. R. & Ukwatta, T. N. 2010, GCN, 10878
- Palmer et al. (2008) Palmer, D., Barthelmy, S. D., Baumgartner, W., et al. 2008, GCN, 8068
- Panaitescu et al. (2006) Panaitescu, A., Mészáros, P., Burrows, D., et al. 2006, MNRAS, 369, 2059
- Pei (1992) Pei, Y. C. 1992, ApJ, 395, 130
- Perley et al. (2010a) Perley, D. A., Bloom, J. S., & Cenko, S. B. 2010a, in Bulletin of the American Astronomical Society, Vol. 42, AAS Meeting Abstracts, 405.09
- Perley et al. (2011a) Perley, D. A., Bloom, J. S., Cenko, S. B., et al. 2011a, in AAS Meeting Abstracts, Vol. 217, 108.02
- Perley et al. (2010b) Perley, D. A., Bloom, J. S., Klein, C. R., et al. 2010b, MNRAS, 406, 2473
- Perley et al. (2009) Perley, D. A., Cenko, S. B., Bloom, J. S., et al. 2009, AJ, 138, 1690
- Perley et al. (2011b) Perley, D. A., Morgan, A. N., Updike, A., et al. 2011b, AJ, 141, 36
- Perna et al. (2003) Perna, R., Lazzati, D., & Fiore, F. 2003, ApJ, 585, 775
- Pickles (1998) Pickles, A. J. 1998, PASP, 110, 863
- Pierini et al. (2004) Pierini, D., Gordon, K. D., Witt, A. N., & Madsen, G. J. 2004, ApJ, 617, 1022
- Pontzen et al. (2010) Pontzen, A., Deason, A., Governato, F., et al. 2010, MNRAS, 402, 1523
- Poole et al. (2008) Poole, T. S., Breeveld, A. A., Page, M. J., et al. 2008, MNRAS, 383, 627
- Pozzetti et al. (2007) Pozzetti, L., Bolzonella, M., Lamareille, F., et al. 2007, A&A, 474, 443
- Predehl & Schmitt (1995) Predehl, P. & Schmitt, J. H. M. M. 1995, A&A, 293, 889
- Prochaska et al. (2006) Prochaska, J. X., Chen, H., & Bloom, J. S. 2006, ApJ, 648, 95
- Prochaska et al. (2009) Prochaska, J. X., Sheffer, Y., Perley, D. A., et al. 2009, ApJ, 691, L27
- Rau et al. (2010) Rau, A., Savaglio, S., Krühler, T., et al. 2010, ApJ, 720, 862
- Rol et al. (2005) Rol, E., Wijers, R. A. M. J., Kouveliotou, C., Kaper, L., & Kaneko, Y. 2005, ApJ, 624, 868
- Roming et al. (2005) Roming, P. W. A., Kennedy, T. E., Mason, K. O., et al. 2005, Space Sci. Rev., 120, 95
- Rossi et al. (2011a) Rossi, A., Schulze, S., Klose, S., et al. 2011a, A&A, 529, A142
- Rossi et al. (2011b) Rossi, A. et al. 2011b, A&A, submitted
- Salvaterra et al. (2009) Salvaterra, R., Della Valle, M., Campana, S., et al. 2009, Nature, 461, 1258
- Sari et al. (1998) Sari, R., Piran, T., & Narayan, R. 1998, ApJ, 497, L17
- Savaglio & Fall (2004) Savaglio, S. & Fall, S. M. 2004, ApJ, 614, 293
- Savaglio et al. (2003) Savaglio, S., Fall, S. M., & Fiore, F. 2003, ApJ, 585, 638
- Savaglio et al. (2009) Savaglio, S., Glazebrook, K., & Le Borgne, D. 2009, ApJ, 691, 182
- Savaglio et al. (2005) Savaglio, S., Glazebrook, K., Le Borgne, D., et al. 2005, ApJ, 635, 260
- Schady et al. (2007) Schady, P., Mason, K. O., Page, M. J., et al. 2007, MNRAS, 377, 273
- Schady et al. (2010) Schady, P., Page, M. J., Oates, S. R., et al. 2010, MNRAS, 401, 2773
- Schady et al. (2011a) Schady, P., Savaglio, S., Krühler, T., Greiner, J., & Rau, A. 2011a, A&A, 525, A113
- Schady et al. (2011b) Schady, P. et al. 2011b, A&A, submitted
- Schlegel et al. (1998) Schlegel, D. J., Finkbeiner, D. P., & Davis, M. 1998, ApJ, 500, 525
- Silva et al. (1998) Silva, L., Granato, G. L., Bressan, A., & Danese, L. 1998, ApJ, 509, 103
- Skrutskie et al. (2006) Skrutskie, M. F., Cutri, R. M., Stiening, R., et al. 2006, AJ, 131, 1163
- Stamatikos et al. (2008) Stamatikos, M., Barthelmy, S. D., Baumgartner, W., et al. 2008, GCN, 7852
- Starling et al. (2007) Starling, R. L. C., Wijers, R. A. M. J., Wiersema, K., et al. 2007, ApJ, 661, 787
- Stratta et al. (2010) Stratta, G., D’Elia, V., & Ukwatta, T. N. 2010, GCN, 10877
- Stratta et al. (2004) Stratta, G., Fiore, F., Antonelli, L. A., Piro, L., & De Pasquale, M. 2004, ApJ, 608, 846
- Tanvir et al. (2004) Tanvir, N. R., Barnard, V. E., Blain, A. W., et al. 2004, MNRAS, 352, 1073
- Tanvir et al. (2009) Tanvir, N. R., Fox, D. B., Levan, A. J., et al. 2009, Nature, 461, 1254
- Tanvir et al. (2008) Tanvir, N. R., Levan, A. J., Rol, E., et al. 2008, MNRAS, 388, 1743
- Tody (1993) Tody, D. 1993, in Astronomical Society of the Pacific Conference Series, Vol. 52, Astronomical Data Analysis Software and Systems II, ed. R. J. Hanisch, R. J. V. Brissenden, & J. Barnes, 173
- Ukwatta et al. (2010a) Ukwatta, T. N., Barthelmy, S. D., Baumgartner, W. H., et al. 2010a, GCN, 10875
- Ukwatta et al. (2010b) Ukwatta, T. N., Barthelmy, S. D., Baumgartner, W. H., et al. 2010b, GCN, 10870
- Updike et al. (2010) Updike, A., Nicuesa, A., Nardini, M., Kruehler, T., & Greiner, J. 2010, GCN, 10874
- van der Horst et al. (2009) van der Horst, A. J., Kouveliotou, C., Gehrels, N., et al. 2009, ApJ, 699, 1087
- Vreeswijk et al. (2007) Vreeswijk, P. M., Ledoux, C., Smette, A., et al. 2007, A&A, 468, 83
- Watson et al. (2011) Watson, D., French, J., Christensen, L., et al. 2011, ApJ submitted, arXiv:1010.1783
- Watson et al. (2006) Watson, D., Fynbo, J. P. U., Ledoux, C., et al. 2006, ApJ, 652, 1011
- Watson et al. (2007) Watson, D., Hjorth, J., Fynbo, J. P. U., et al. 2007, ApJ, 660, L101
- Waxman & Draine (2000) Waxman, E. & Draine, B. T. 2000, ApJ, 537, 796
- Willmer et al. (2006) Willmer, C. N. A., Faber, S. M., Koo, D. C., et al. 2006, ApJ, 647, 853
- Witt & Gordon (1996) Witt, A. N. & Gordon, K. D. 1996, ApJ, 463, 681
- Woosley (1993) Woosley, S. E. 1993, ApJ, 405, 273
- Yoon & Langer (2005) Yoon, S. & Langer, N. 2005, A&A, 443, 643
- Zafar et al. (2011) Zafar, T., Watson, D., Fynbo, J. P. U., et al. 2011, ApJ submitted, arXiv:1102.1469
- Zhang (2007) Zhang, B. 2007, Chinese Journal of Astronomy and Astrophysics, 7, 1